● INTRODUCTION
The advent of pulsed and color Doppler techniques in the early and late eighties allowed for the noninvasive examination of the fetal cardiovascular system. This significant imaging advancement enhanced our understanding of fetal hemodynamic changes in normal and abnormal conditions, including structural cardiac anomalies as well as in fetal diseases such as intrauterine growth restriction, anemia, fetal hydrops, and others. Pulsed Doppler studies of fetal vasculature provided quantitative information on flow patterns, which allowed for the diagnosis of anatomic cardiac abnormalities and blood flow disturbances in fetal disease states. In this chapter we will focus on the use of pulsed Doppler in the study of blood flow changes at the levels of the cardiac valves and neighboring arteries and veins. Fetal cardiac function assessment by various techniques will be discussed in Chapter 14.
● DOPPLER PRINCIPLE
The concept of color and pulsed Doppler ultrasonography is derived from the Doppler effect, which is based on the apparent variation in the frequency of a light or a sound wave as its source approaches or moves away, relative to an observer (1). When an ultrasound wave with a certain transmitted frequency insonates a blood vessel, the reflected frequency or frequency shift is directly proportional to the speed at which the red blood cells are moving (blood flow velocity) within that particular vessel (Fig. 13.1). This frequency shift is also proportional to the cosine of the angle that the ultrasound beam makes with this vessel (the angle of incidence) and to the frequency of the insonating ultrasound wave (see Fig. 13.1). The Doppler frequency shift, therefore, reflects but does not actually measure the velocity of blood flow.
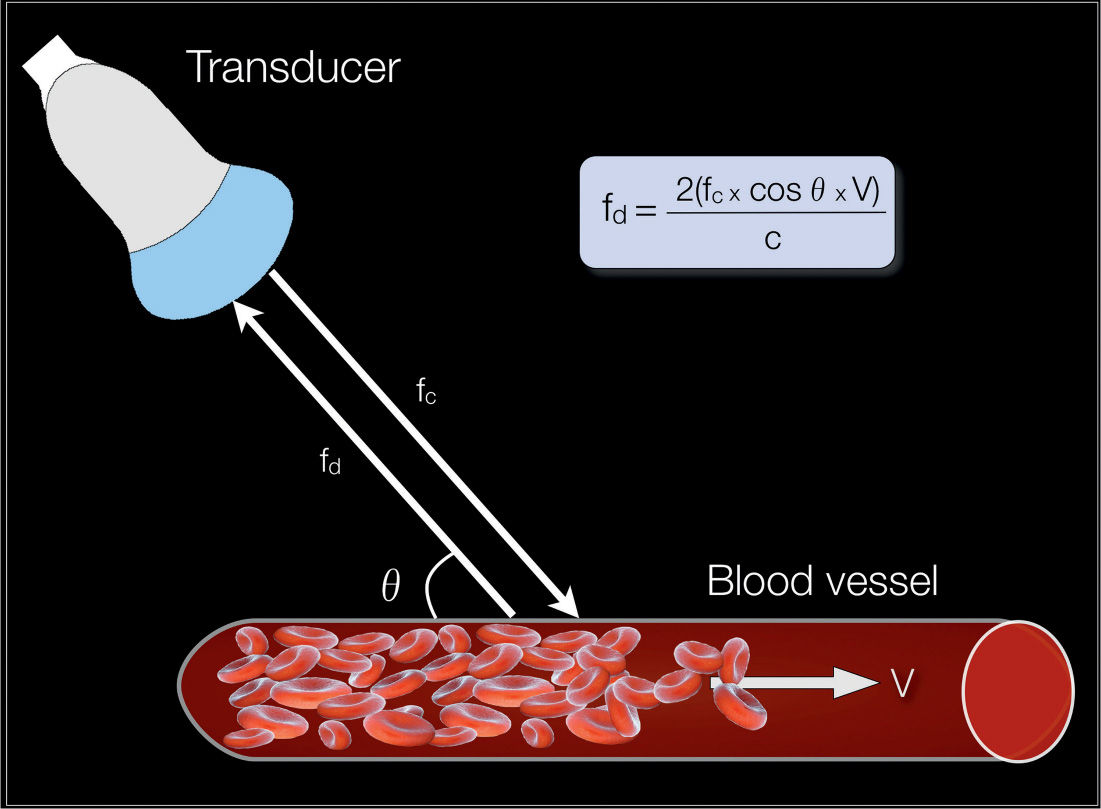
Figure 13.1: The Doppler effect in ultrasonography: When an ultrasound wave insonates a blood vessel, the frequency shift of the reflected ultrasound wave (fd) is directly proportional to the frequency of the insonating ultrasound wave (fc), the velocity of blood flow within the vessel (V), and the cosine of the angle that the ultrasound beam makes with the direction of blood flow (q); and inversely proportional to a constant (C), which reflects the milieu that the ultrasound beam is traversing.
In spectral Doppler ultrasonography, the frequency spectrum is displayed in a graphic form (Figs. 13.2 and 13.3). In this display, the vertical axis represents the frequency shift (or the calculated velocity) and the horizontal axis represents the temporal change of this frequency shift as it relates to the events of the cardiac cycle (see Figs. 13.2 and 13.3). The frequency shift can therefore be easily measured at any point along the cardiac cycle and cardiac function parameters can be calculated from the corresponding Doppler waveforms (Figs. 13.3 and 13.4).
In clinical applications, Doppler velocimetry is mostly used to assess the downstream resistance to the flow of blood (2). This is based on the concept that the mean flow is proportional to the mean pressure and inversely proportional to the mean downstream resistance (Qm = Pm/Rm). This concept, however, applies only to steady nonpulsatile flow conditions. In a medical setting where flow is pulsatile, vascular impedance rather than vascular resistance describes opposition to flow (3). Downstream resistance is just one component of vascular impedance, which is also dependent on the pulse frequency, blood inertia, distensibility of the vessel wall, and wave reflection (3–6). In a laboratory setting where the ability to measure vascular impedance is present, Doppler indices correlate well with impedance to pulsatile flow, pressure pulsatility, and vascular resistance (7). The frequency shift therefore provides information on the downstream impedance to flow of whichever vascular bed is being studied. Doppler applications also allow for the measurement of true velocity of blood flow, which is of value in fetal anemia. Furthermore, Doppler of great vessels, along with measurements of vessel diameters, allows for cardiac output calculations.
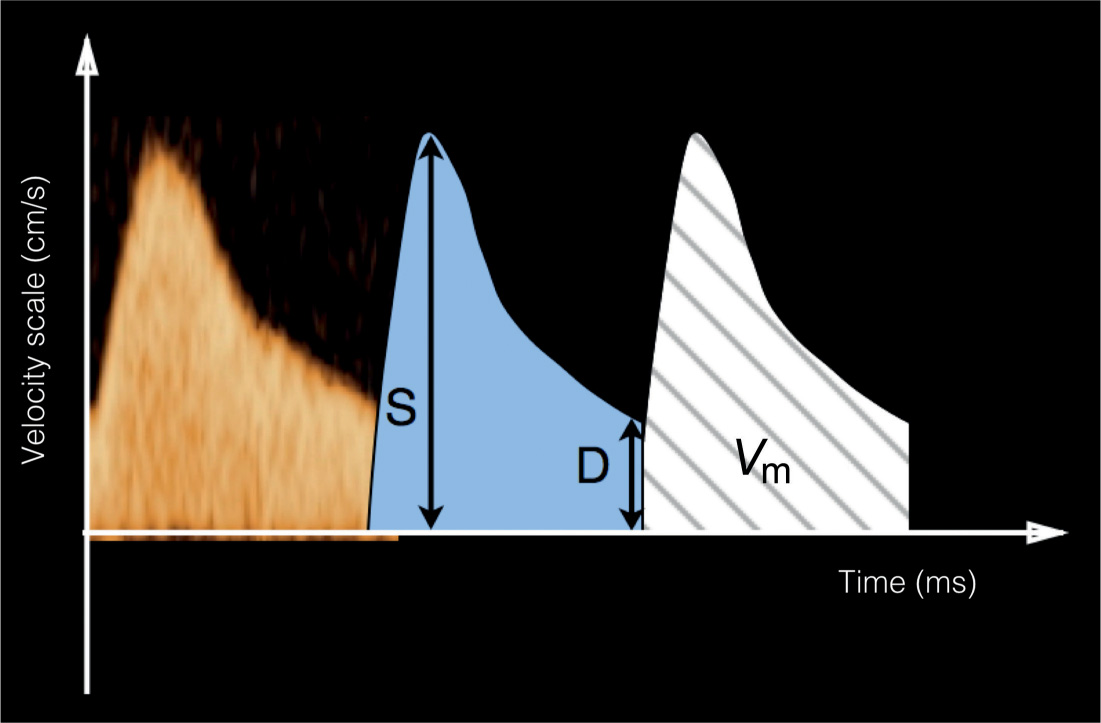
Figure 13.2: Spectral Doppler ultrasonography of a fetal artery. The vertical axis represents the frequency shift (velocity scale) (cm/s) and the horizontal axis represents time (ms). In this spectrum, the temporal change of the frequency shift is displayed as it relates to the events of the cardiac cycle. Doppler indices that are commonly used in the fetal vasculature are presented in Table 13.1. The peak systolic velocity (S), the end-diastolic velocity (D), and the mean velocity (Vm) are parameters that are commonly used in waveform quantification.
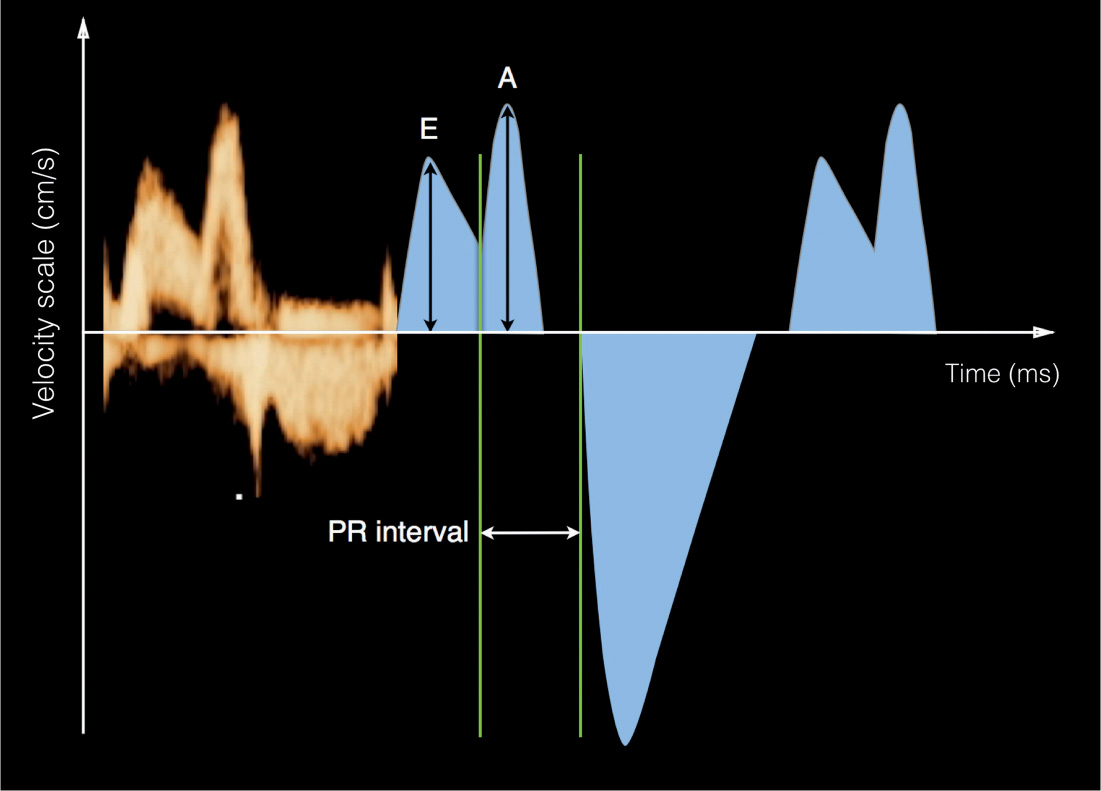
Figure 13.3: Doppler waveform quantification across the atrioventricular valves. E/A ratio is used for waveform quantification, where E represents peak velocity during early ventricular filling and A represents peak velocity during the atrial contraction phase of diastole. The mechanical PR interval, corresponding to the electrical P and R waves from ECG, can be measured from this waveform. See text and Table 13.2 for details.
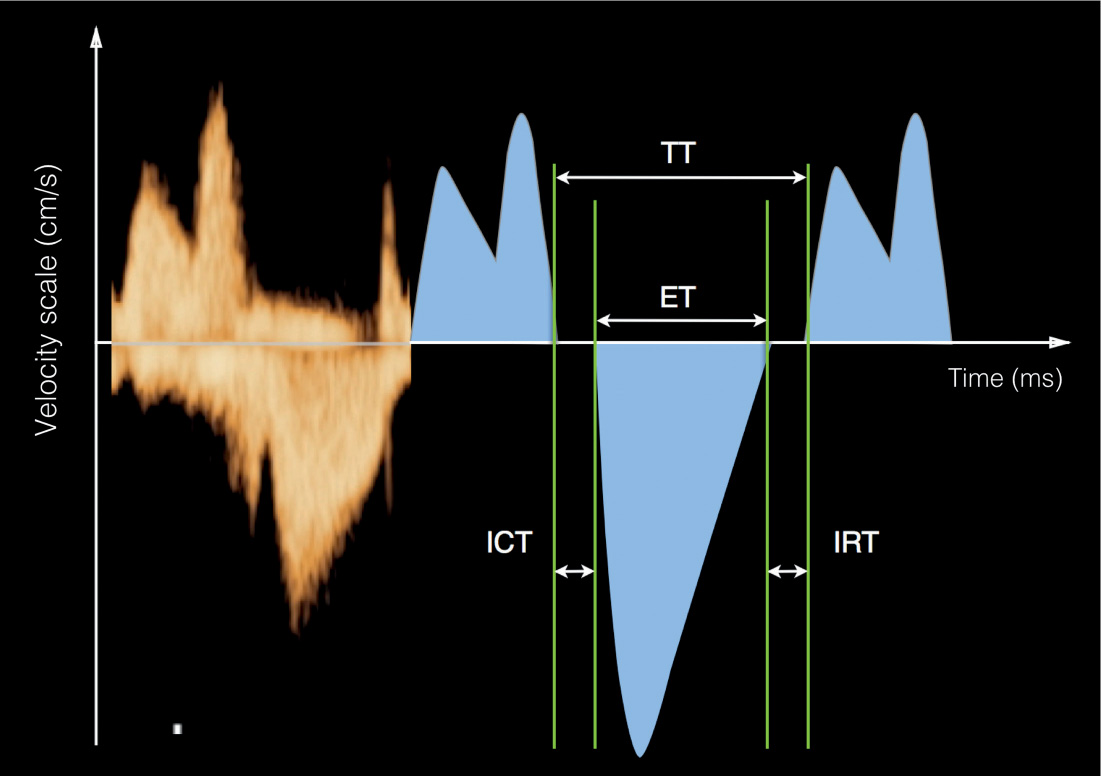
Figure 13.4: Doppler waveforms across the mitral valve showing parameters commonly used in the assessment of cardiac function. ET represents the systolic ejection time, ICT represents the isovolumetric contraction time, IRT represents the isovolumetric relaxation time, and the TT is the total time. TT = ET+ICT+IRT.
● DOPPLER WAVEFORM QUANTIFICATION
Quantification of Doppler spectrum depends highly on the region examined. In general, three parts of the cardiovascular system can be distinguished: the arterial system, the cardiac valves, and the venous system. In each of these regions, a very similar pattern of the velocity waveform with some specific variations can be found, but the quantification is similar. In order to obtain accurate Doppler waveforms in fetal echocardiography, the sample volume is placed distal to the respective valves or within the vessel, the insonating angle should be within 15 to 20 degrees of the direction of blood flow, Doppler waveforms should be obtained during fetal apnea, and multiple measurements should be made. Color Doppler is used to direct placement of the sample volume; placing the sample volume at the brightest colors of the blood flow segment will ensure the best measurements. Obtaining several measurements at different cardiac cycles will also ensure reproducibility of results. Table 13.1 lists the step-by-step approach to fetal pulsed Doppler echocardiography.
Pulsed Doppler Assessment of the Fetal Arteries
Flow velocity waveform in the fetal arterial system, as described later, is characterized by a high pulsatility with the presence of a systolic peak and low flow during diastole (Figs. 13.2 and 13.5). An exception is the coronary arterial flow (8), which is not discussed here. Commonly used Doppler indices for the peripheral arteries are listed in Table 13.2, namely, the pulsatility index, the resistance index, and the S/D ratio, which are independent of the angle of insonation. Typical vessels of interest are the umbilical arteries, the descending aorta, the middle cerebral artery, the ductus arteriosus, the aortic isthmus, and the branch pulmonary arteries. See Table 13.2 for the definition of Doppler waveform quantification and Doppler indices.
• Place sample volume distal to targeted valves or within the vessel (veins). • Keep insonating angle at less than 30 degrees from direction of blood flow. • Place sample volume at brightest colors of blood flow segment. • Obtain Doppler waveforms during fetal apnea. • Obtain multiple measurements. |
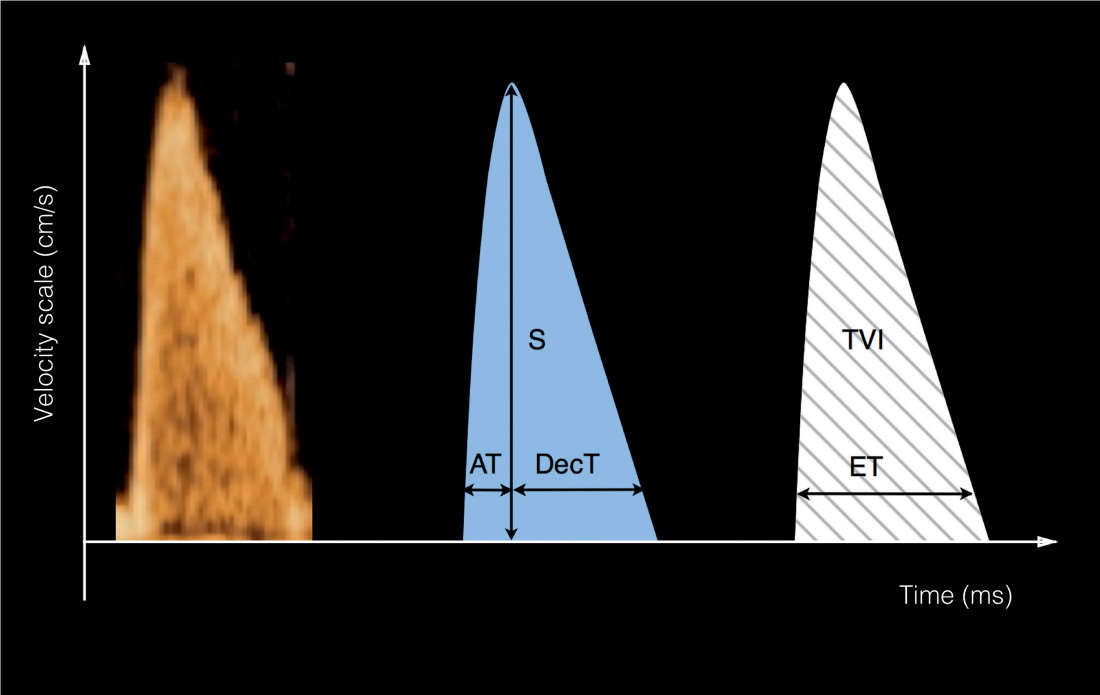
Figure 13.5: Doppler waveform quantification across the semilunar valves. AT is the acceleration time or time-to-peak velocity, and DecT is the deceleration time. S is the peak systolic velocity. ET represents systolic ejection time. TVI represents the time–velocity integral (area under the curve). See text and Table 13.2 for details.
Pulsed Doppler Assessment of the Cardiac Valves
Although Doppler indices are widely used in the evaluation of the fetal peripheral circulation, Doppler waveform quantification at the cardiac level has mostly relied on measurements of absolute values, which, unlike Doppler indices, are angle dependent. Doppler assessment across both atrioventricular and semilunar valves is explained in the next sections. Flow across the valves shows separate diastolic and systolic flow events. Since the insonation of the valves can be approached with an optimal angle, absolute measurements can be obtained in addition to the ratio of velocities or time measurements. The ratio of the early diastolic to atrial contraction peak velocities (E/A ratio) (Fig. 13.3) can be calculated in addition to peak velocities of semilunar valves (Fig. 13.5). Typically, the mean velocity can be measured, and in combination with vessel area measurements, cardiac flow can be reliably quantified (Table 13.3). Doppler measurements of cardiac valves are summarized in Table 13.3.
Value | Definition |
Peak systolic velocity (S) (cm/s) | Maximum velocity of Doppler spectrum in systole |
End-diastolic velocity (D) (cm/s) | Velocity of end-diastolic flow |
Time–velocity integral (TVI) (cm) | Area under the Doppler waveform over one cardiac cycle |
Mean velocity (Vm) (cm/s) | Time Velocity Integral |
| Duration of Cardiac Cycle |
Pulsatility index (PI) | Systolic Velocity – Diastolic Velocity |
| Mean Velocity |
Resistance index (RI) | Systolic Velocity – Diastolic Velocity |
| Systolic Velocity |
S/D ratio | Systolic Velocity |
| Diastolic Velocity |
Stroke volume (SV) of LV (mL) | TVI × Cross-sectional area of aortic valve |
Stroke volume (SV) of RV (mL) | TVI × Cross-sectional area of pulmonary valve |
Cardiac output (CO) of LV (mL/min) | Stroke volume of LV × Fetal heart rate |
Cardiac output (CO) of RV (mL/min) | Stroke volume of RV × Fetal heart rate |
LV, left ventricle; RV, right ventricle.
Value | Definition |
E wave | Peak velocity over the early diastolic peak (E) of mitral or tricuspid valve |
A wave | Peak velocity during atrial contraction phase of diastole (A) of mitral or tricuspid valve |
E/A ratio | Early Diastolic Peak Velocity Atrial Contraction Diastolic Peak Velocity |
Acceleration time = Time-to-peak velocity | Time from onset to peak systolic velocity (ms) |
Deceleration time | Time from peak systolic to the intersection of descending slope with the baseline (ms) |
Ejection (or systolic) time | Systolic time of cardiac cycle |
Filling (or diastolic) time | Diastolic time of cardiac cycle |
Total time | Duration of one cardiac cycle |
Isovolumetric contraction time (ICT) (ms) | Contraction of myocardium with increase in ventricular pressure while no change in volume. All valves closed. |
Isovolumetric relaxation time (IRT) (ms) | Relaxation of myocardium with drop in ventricular pressure, while no change in volume. All valves closed. |
PR interval | Time between the end of early diastolic filling and the begin of systole, in analogy to the electric event duration on ECG from peak to R-wave time |
Pulsed Doppler Assessment of the Fetal Veins
Flow velocity waveforms in the fetal venous system typically show continuous flow in the peripheral veins, and increased pulsatility in veins connected to the fetal heart. With the exception of the intrahepatic umbilical vein, which shows continuous flow, Doppler waveforms of the fetal veins draining into the heart are characterized by three peaks: S-, D-, and A waves (9). S corresponds to peak velocity during ventricular systole, D corresponds to peak velocity during cardiac diastole, and A corresponds to antegrade or reverse velocity during the atrial contraction at the end of diastole (Figs. 13.6 and 13.7). Some veins, such as the ductus venosus and pulmonary veins, show antegrade flow throughout the cardiac cycle, whereas other veins, such as the superior and inferior vena cavae and the hepatic veins, show a reversal of flow during the atrial contraction. Pulsatility index and peak velocity index are Doppler indices for quantification of venous flow. In the presence of reverse flow of the A wave, the percentage of reverse flow or the preload index can be assessed as well. Doppler measurements of the fetal veins are summarized in Table 13.4.
● VALVES AND VESSELS OF INTEREST
Atrioventricular Valves
Doppler Technique
Obtain an apical or a basal four-chamber view. Make sure that your angle of insonation is less than 20 degrees from the direction of blood flow across the atrioventricular valves. Use color Doppler in order to identify blood flow across the atrioventricular valves. Place the Doppler sample volume within the ventricles and on the apical side of the mitral or tricuspid valves, at the brightest colors of the blood flow segment.
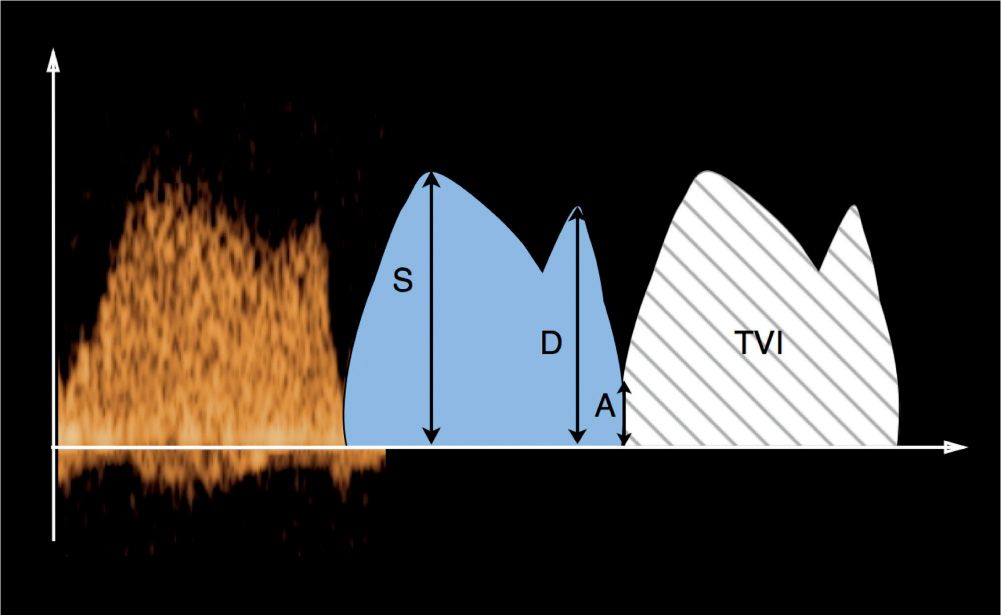
Figure 13.6: Doppler waveform quantification across the ductus venosus (DV). S represents maximum systolic velocity, D represents maximum diastolic velocity, and A represents the nadir velocity during the atrial contraction. TVI represents the time–velocity integral (area under the curve). See text for details and Figures 13.13 and 13.14. Doppler waveforms across the pulmonary veins have shapes similar to the DV waveforms and use similar quantification indices.
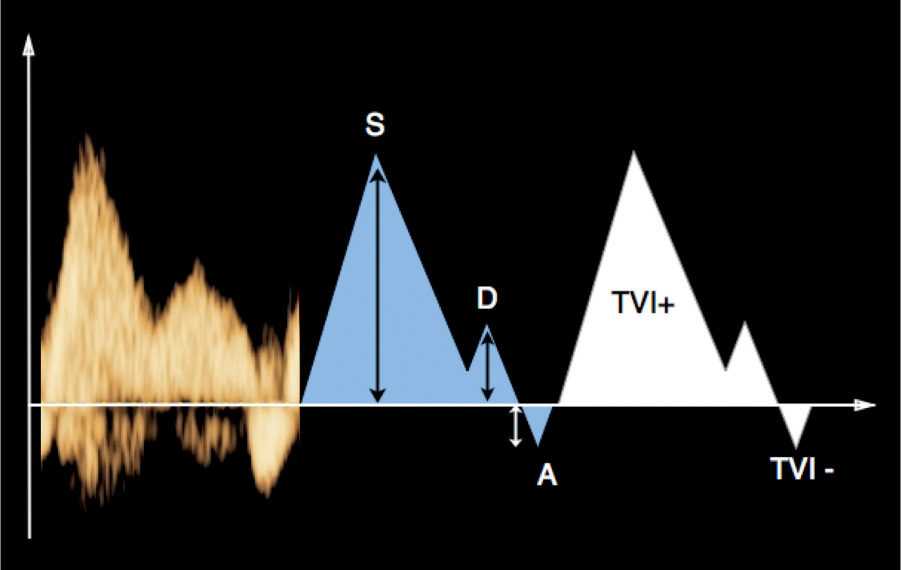
Figure 13.7: Doppler waveform quantification across the inferior vena cava, superior vena cava, or hepatic veins (Doppler waveforms across all three veins have similar shapes and characteristics). S represents maximum systolic velocity, D represents maximum diastolic velocity, and A represents the atrial reversal flow during atrial contraction. TVI represents the time–velocity integral (area under the curve), TVI1 for the forward flow and TVI2 for the reversed flow portion of the waveform. See text for details.
Value | Definition |
Systolic velocity (S) (cm/s) | Peak velocity during ventricular systole |
Diastolic velocity (D) (cm/s) | Peak diastolic velocity during early diastole |
Atrial velocity (A) (cm/s) | Peak diastolic velocity during atrial contraction (can be a negative value) |
Time–velocity integral (TVI) (cm) | Area under the Doppler waveform over one cardiac cycle |
Mean velocity (Vm) (cm/s) | Time Velocity Integral Duration of Cardiac Cycle |
Pulsatility index of veins (PIV) | Systolic Velocity – Diastolic Velocity Main Velocity |
Peak velocity index for veins (PVIV) | Systolic Velocity – Atrial Diastolic Velocity Diastolic Velocity |
Preload index for inferior vena cava | Atrial Diastolic Velocity Systolic Velocity |
Percent reverse flow | TVI of the Reverse Flow Segment × 100 TVI of the Total Forward Flow Segment |
Doppler Waveforms
Figure 13.8 shows typical Doppler waveforms obtained across the atrioventricular valves. These Doppler waveforms, which correspond to ventricular filling during diastole, are biphasic. The first phase of the waveform is known as the E wave: it corresponds to early ventricular filling of diastole. The second phase of the waveform is known as the A wave: it corresponds to active ventricular filling of diastole (atrial contraction or atrial kick). Because of leaflet continuity between the mitral and aortic valve annuli, the Doppler waveform across the mitral valve shows aortic flow during the systolic component (see Fig. 13.8B). Pulmonic flow, on the other hand, is not evident across the tricuspid valve (see Fig. 13.8A) because of the presence of a subpulmonic conus separating the tricuspid valve annulus from the pulmonary valve annulus. The E/A ratio is used for Doppler waveform quantification across the atrioventricular valves (Fig. 13.3).
Doppler waveforms across the atrioventricular valves are dependent on the compliance of the ventricular muscle, preload, and afterload (10, 11). The E/A ratio is an index of ventricular diastolic function. Unlike in postnatal life, in the fetus the velocity of the A wave is higher than that of the E wave. This observation, which is thought to be secondary to an increased cardiac muscle stiffness during fetal life (12), highlights the importance of the role that atrial systole plays in cardiac filling in the fetus. As ventricular stiffness decreases with advancing gestation, E/A ratio increases from 0.53 ± 0.05 in the first trimester to about 0.70 ± 0.02 in the second half of pregnancy (13, 14). Indeed E/A ratios around 0.82 ± 0.04 are noted at term (15). The rise in E/A ratio with advancing gestation suggests a shift of blood flow from late to early diastole. This shift of blood flow may be secondary to an increase in ventricular compliance, a rise in ventricular relaxation rate, or a reduction in afterload with decreased placental resistance, all of which occur with advancing gestation (16). When the mitral and tricuspid Doppler waveforms are compared, peak flow velocities in both early and late diastole are higher across the tricuspid valve (14–16). This finding is in keeping with previous studies suggesting greater blood flow across the tricuspid valve than the mitral valve in the fetus (17–19), and thus supporting the concept of right heart dominance in the fetus. Shifting to left ventricular dominance starts in utero toward the end of gestation (20). The E/A ratio is an index of ventricular preload and compliance.
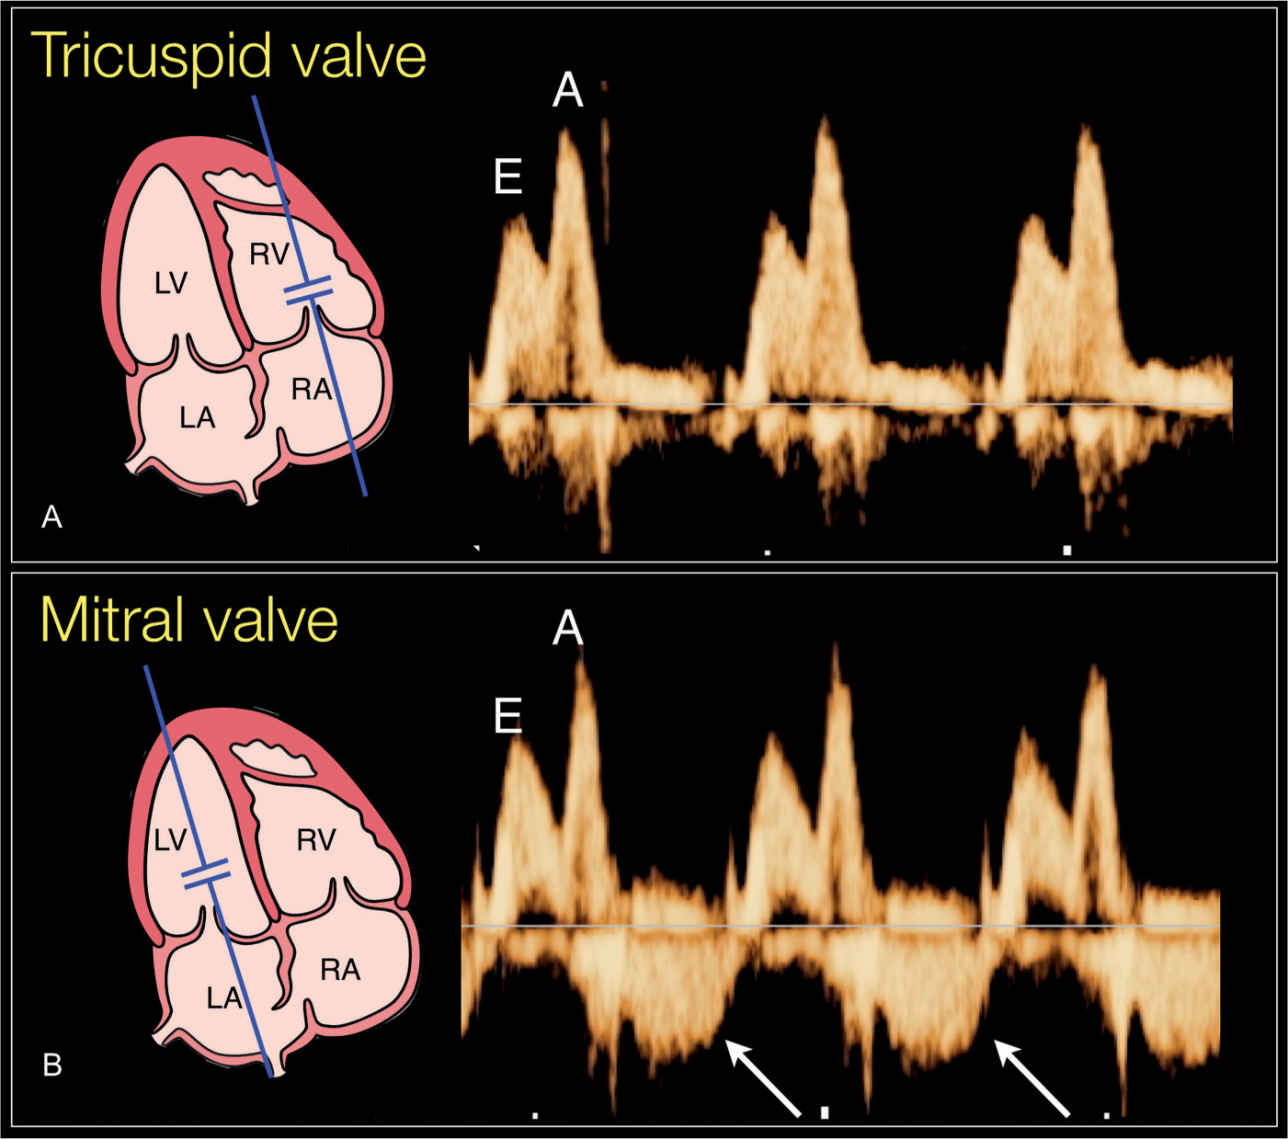
Figure 13.8: Doppler waveforms across the tricuspid (A) and mitral (B) valves. A small sample gate is chosen and placed slightly distal to the valve with an insonation angle of less than 20 degrees. The Doppler waveforms are biphasic, as shown in Figure 13.3. Doppler waveforms across the mitral valve (B) show aortic flow during the systolic component (arrows in B) because of fibrous continuity between the mitral and aortic valves. Pulmonic flow is not evident across the tricuspid valve (A). E corresponds to early diastolic peak velocity and A corresponds to atrial contraction peak velocity. RV, right ventricle; LV, left ventricle; RA, right atrium; LA, left atrium. See text and Table 13.3 for details.
Stay updated, free articles. Join our Telegram channel

Full access? Get Clinical Tree


