● INTRODUCTION
Since the early days of fetal echocardiography, various biometric cardiac dimensions have been measured and reference ranges reported. Original cardiac measurements were performed using M-mode, with the M-mode line in perpendicular orientation to the myocardial wall, ventricles, atria, or valves (1, 2). The advent of high-resolution grayscale imaging, combined with zoom and cine-loop techniques, allowed for clear visualization of various cardiac structures during systole and diastole and the ability to perform cardiac measurements directly on the two-dimensional (2D) image (3–8). Recently, the use of spatiotemporal image correlation (STIC) (see Chapter 15) as a three-dimensional (3D) tool was used to generate 2D and 3D cardiac measurements as well (9–11). With the limitations of ultrasound equipment in the early days of fetal echocardiography, the fetal heart was primarily imaged in the second half of pregnancy and reference ranges focused on this time interval in gestation (2–4, 6, 7). With the improvement in technology, cardiac biometric measurements were obtained at various gestations including 18 weeks (8), 14 weeks (5), and from 11 weeks onward (12, 13). In this chapter, we present relevant points related to cardiac biometric measurements during fetal echocardiography. The readers are referred to Appendix A in this book, which contains detailed description of reference ranges of various cardiac dimensions.
● WHY SHOULD WE PERFORM CARDIAC MEASUREMENTS?
The use of cardiac measurements in fetal echocardiography has several potential advantages in clinical practice:
1. Measurements are performed to assess size or growth of a structure in relation to gestational age (head circumference, heart width, etc.).
2. Measurements are performed in order to reduce subjectivity and replace it by an objective observation. Follow-up examinations and measurements are more accurate in such cases (cardiothoracic ratio, ventricular and aortic diameter, etc.).
3. Measurements are occasionally recommended in order to properly visualize the structure of interest.
4. Reference ranges are often used to report deviations from normal values, once abnormal findings are suspected (left ventricular diameter, aortic isthmus diameter, etc.).
5. Measurements can also be required as part of a cardiac formula or score (shortening fraction, cardiothoracic ratio, etc.).
● WHEN SHOULD CARDIAC MEASUREMENTS BE PERFORMED?
Guidelines on fetal cardiac screening and fetal echocardiography were presented in Chapter 2. In general, 2D measurements of cardiac chambers or great vessels are not recommended in routine cardiac screening, but are considered optional and helpful in fetal echocardiography (14–16). It is generally agreed that cardiac measurements are not routinely required in fetal echocardiography; however, cardiac measurements may occasionally help to interpret findings when compared against expected values (16). The quantitative assessment of a cardiac structure enables the objective interpretation of the severity of some cardiac lesions and can be used as a basis for comparison during the course of gestation (16). When there is a suspicion of an abnormal cardiac structure, measurements should be obtained in fetal echocardiography for comparison with normal ranges (17). The interpretation of results is improved by using reference graphs or by calculating z-scores (8, 12, 18–21) (see section on z-score in this chapter). Table 17.1 summarizes the recommendations of the American Institute of Ultrasound in Medicine (AIUM) with regards to cardiac biometry in fetal echocardiography (14).
Normal ranges for fetal cardiac measurements have been published as percentiles and z-scores that are based on gestational age or fetal biometry. Individual measurements can be determined from 2D images or M-mode images in some situations and may include the following parameters: • Aortic and pulmonary valve annulus in systole • Tricuspid and mitral valve annulus in diastole • Right and left ventricular length • Aortic arch and isthmus diameter measurements • Main pulmonary artery and ductus arteriosus measurements • End-diastolic ventricular diameter just inferior to the atrioventricular valve leaflets • Thickness of the ventricular free walls and interventricular septum just inferior to the atrioventricular valves • Cardiothoracic ratio • Additional measurements if warranted, including: • Systolic dimensions of the ventricles • Transverse dimensions of the atria • Diameters of branch pulmonary arteries |
Modified from American Institute of Ultrasound in Medicine. AIUM practice guideline for the performance of fetal echocardiography. J Ultrasound Med. 2013;32:1067–1082, with permission.
● REFERENCE RANGES OF TWO-DIMENSIONAL CARDIAC MEASUREMENTS
Reference ranges of 2D cardiac measurements are correlated with fetal biometric measurements when gestational age is not known or with gestational age when the exact age of the fetus is known. When fetal biometric measurements are used to correlate cardiac measurements, femur lengths or biparietal diameters are often used (12, 18–20). Many authors, however, correlate cardiac measurements with both gestational age and fetal size. It is the authors’ experience and preference to use a gestational age correlation when feasible. Cardiac biometric measurements in the literature differ with regards to correlation parameters and reference ranges. Some authors report on a formula in a table, whereas others offer a graph with standard deviations (SDs), with percentiles or with confidence intervals. Often the reader has to refer to different papers to get the measurements of interest. In Appendix A of this book, we put together a list of the most common measured parameters in fetal echocardiography from various papers in the literature. For most of the provided curves, we recalculated the ranges from the provided formulas, and presented each in a uniform graph display, correlated with gestational age with the 2.5th, 50th, and 97.5th percentiles, corresponding to the mean ±1.96 SD.
● WHAT ARE Z-SCORES AND WHAT ARE THEY USED FOR?
Fetal cardiac biometric measurements are performed during fetal echocardiography in order to document deviations from normal values. Abnormal measurements are often reported as being either lower than the 5th percentile or greater than the 95th percentile. However, a more precise description of cardiac biometry for comparative purposes is desirous, especially when follow-up examinations are performed (14, 16). This is critical especially when the absolute values of cardiac measurements are dependent on another variable, such as gestational age in a growing fetus. For this purpose, z-scores were introduced in fetal medicine to eliminate the impact of gestational age. Simply put, a z-score is the grade of deviation of the measured value from the expected mean value for gestational age. The z-score is calculated as the difference between the measured value and the expected mean value for gestational age, and the result is then divided by the SD. The z-score is thus expressed as a multiple of the SD from the mean value for gestational age. A minus z-score implies smaller measurement than the mean and a plus z-score implies a larger measurement than the mean. A z-score of 0 is the mean value, and z-scores of +1 or +2 correspond to the first and second SDs, respectively. Table 17.2 provides a summary of commonly used values.
Relationship of Some Percentile Values with the Corresponding Z-Score |
Percentile | Z-Score | Calculation |
1st | −2.33 | Mean − 2.33 × SD |
2.5th | −1.96 | Mean − 1.96 × SD |
5th | −1.65 | Mean − 1.65 × SD |
10th | −1.28 | Mean − 1.28 × SD |
20th | −0.84 | Mean − 0.84 × SD |
25th | −0.65 | Mean − 0.65 × SD |
50th | 0 | Mean value |
75th | 0.65 | Mean + 0.65 × SD |
80th | 0.84 | Mean + 0.84 × SD |
90th | 1.28 | Mean + 1.28 × SD |
95th | 1.65 | Mean + 1.65 × SD |
97.5th | 1.96 | Mean + 1.96 × SD |
99th | 2.33 | Mean + 2.33 × SD |
SD, standard deviation.
A clinical example: A fetus at 22 weeks’ gestation is found to have signs of developing aortic coarctation with a ventricular septal defect and a narrow aortic root. Prognosis is dependent on the growth of the aortic valve during gestation. The aortic root diameter at 22 weeks is measured at 2 mm and at a follow-up measurement at 34 weeks showed an aortic root at 3.8 mm (Fig. 17.1). The z-score at 22 weeks is calculated using the reference range of Shapiro et al. (5). The difference at 22 weeks between the expected aortic root measurement (3.8 mm) and the observed measurement (2 mm) is −1.8 mm. Dividing the difference of −1.8 mm by the SD of 0.46 mm at 22 weeks gives a z-score of −3.91, implying that the measured value of 2 mm is below the mean value by 3.9 times the SD. At 34 weeks, the aortic root measured 3.8 mm instead of an expected measurement of 6.8 mm. The difference of −3.0 mm divided by a SD of 0.66 mm at 34 weeks results in a z-score of −4.5.
Interpretation of results: Looking at the absolute values of the aortic root measurements between 22 and 34 weeks’ gestation, one can deduce that the aortic valve grew from 2 to 3.8 mm, thus almost doubling in size. When using the percentile curves, both values are below the 1st percentile (which is −2.33 SD) (see Table 17.2) information, which does not allow for more differentiation. Plotting the values on a graph provides an impression of a continuous growth of the aortic valve. Only when the z-scores are calculated, −3.9 to −4.6, slight regression in the aortic valve diameter is noted between 22 and 34 weeks’ gestation, important clinical information for patient counseling.
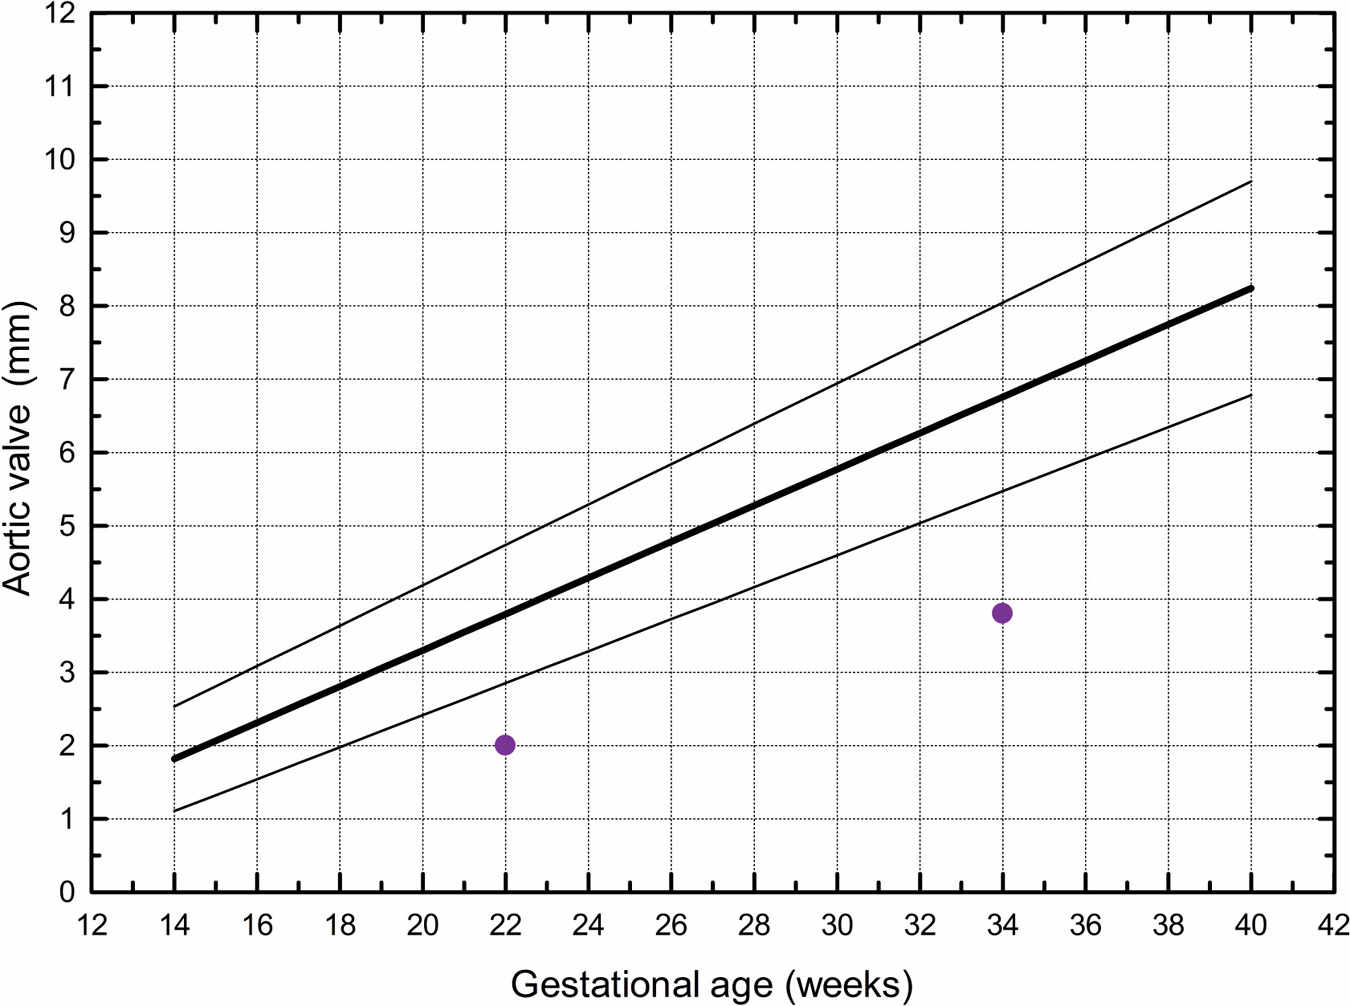
Figure 17.1: Aortic valve measurements at 22 and 34 weeks in a fetus with a small aortic root. The three lines of the graph represent the reference ranges of the 2.5th, 50th, and 97.5th percentiles. The plotted values represent one way of displaying cardiac biometric measurements (see text for explanation and more details). (The graph adapted from Shapiro I, Degani S, Leibovitz Z, et al. Fetal cardiac measurements derived by transvaginal and transabdominal cross-sectional echocardiography from 14 weeks of gestation to term. Ultrasound Obstet Gynecol. 1998;12:404–418, with permission.)
Stay updated, free articles. Join our Telegram channel

Full access? Get Clinical Tree


