● INTRODUCTION
The prenatal diagnosis of cardiac rhythm abnormalities has been made possible with advancements in ultrasound imaging. M-mode ultrasound, in addition to color and pulsed Doppler echocardiography, plays a significant role in our ability to diagnose complex arrhythmias in the fetus and in monitoring the success of prenatal treatment intervention. The recent addition of tissue Doppler and magnetocardiography to conventional ultrasound will undoubtedly enhance the ability to understand the pathophysiology of fetal rhythm disturbances and to target specific treatment of these conditions.
Fetal cardiac rhythm abnormalities are common and are encountered in about 1% to 2% of pregnancies (1). Irregular fetal cardiac rhythm is the leading cause for referrals to fetal echocardiography centers for rhythm disturbances, and the vast majority of those are benign atrial ectopic beats. Sustained fetal bradyarrhythmias or tachyarrhythmias, which are associated with an increase in neonatal morbidity and mortality, account for less than 10% of referrals (2). This chapter will review the diagnostic modalities currently available for the assessment of fetal rhythm abnormalities and the various types of fetal arrhythmias, as well as their impact on fetal and neonatal outcome and their management.
● FETAL RHYTHM ASSESSMENT
M-mode Echocardiography
M-mode (motion-mode) echocardiography is obtained by recording ultrasound beam reflections in relation to depth from the transducer and time. The M-mode display is therefore a linear representation of adjacent cardiac structures as a function of time. In clinical practice, a two-dimensional (2D) image of the fetal heart is first obtained, and the M-mode cursor is placed at the desired location within the heart. The linear display of M-mode echocardiography allows for more accurate and reproducible measurements of various cardiac chambers and great vessel diameters. Furthermore, as it detects motion of structures through time, M-mode echocardiography is commonly used in the evaluation of fetal arrhythmias and excursions of various cardiac valves. The M-mode cursor is often placed to intersect an atrium and a ventricle so that the relationship of atrial-to-ventricular contractions is recorded (Fig. 33.1). The onset and peak of atrial and ventricular contractions are not clearly defined on M-mode, which limits its ability to measure atrioventricular (AV) time intervals, a major limitation of M-mode evaluation of fetal rhythm abnormalities. Furthermore, poor signal quality and suboptimal fetal position are often encountered, which limits the application of M-mode. Incorporating color Doppler into M-mode (Fig. 33.2) and steering of the M-mode beam, which is available in newer ultrasound equipment, allow for enhanced performance.
Pulsed Doppler Echocardiography
Pulsed Doppler echocardiography can provide critical information in the assessment of fetal rhythm abnormalities and is the current preferred method in addition to M-mode echocardiography. Pulsed Doppler allows for the ability to acquire simultaneous signals from atrial and ventricular contractions, which results in the identification of temporal cardiac events and measurement of various time intervals, a required parameter for the classification of various arrhythmias. Information can be provided when the pulsed Doppler gate is placed across the mitral and aortic valves (Fig. 33.3), pulmonary artery and vein (Fig. 33.4), renal artery and vein (Fig. 33.5), or superior vena cava and aorta (Fig. 33.6) (3–5). When the superior vena cava and the aorta are simultaneously interrogated by Doppler, retrograde flow in the superior vena cava marks the beginning of atrial systole, and the onset of aortic forward flow marks the beginning of ventricular systole (Fig. 33.6). The mechanical PR interval can also be evaluated by pulsed Doppler (see later in this chapter) (6).
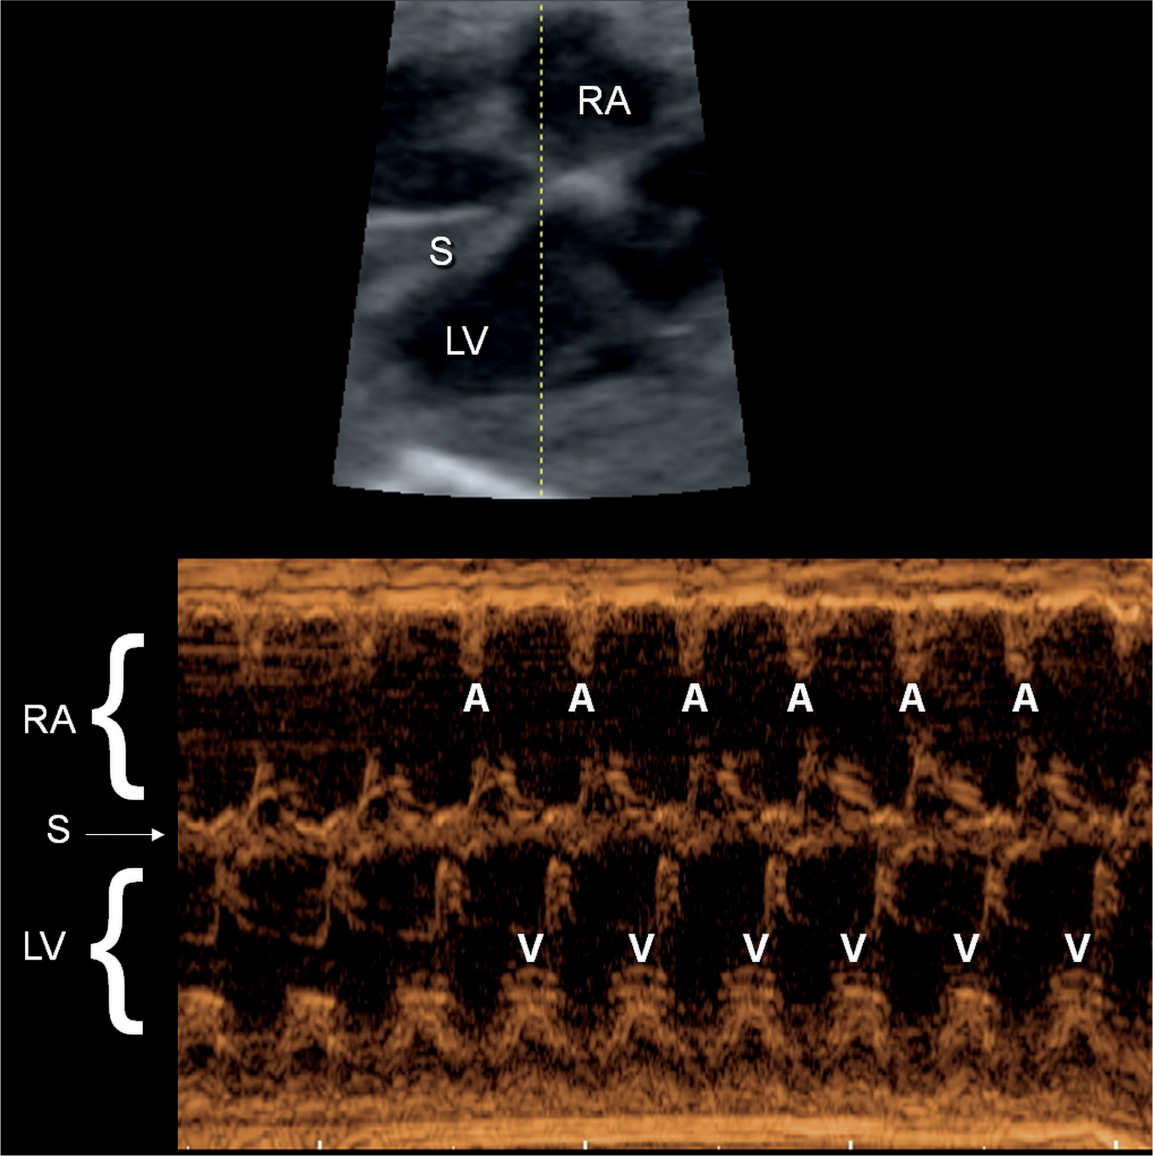
Figure 33.1: M-mode recording of normal sinus rhythm in a fetus. The M-mode cursor line intersects the right atrium (RA), the interventricular septum (S), and the left ventricle (LV). The M-mode recording shows the atrial contractions (A) and the corresponding ventricular contractions (V).
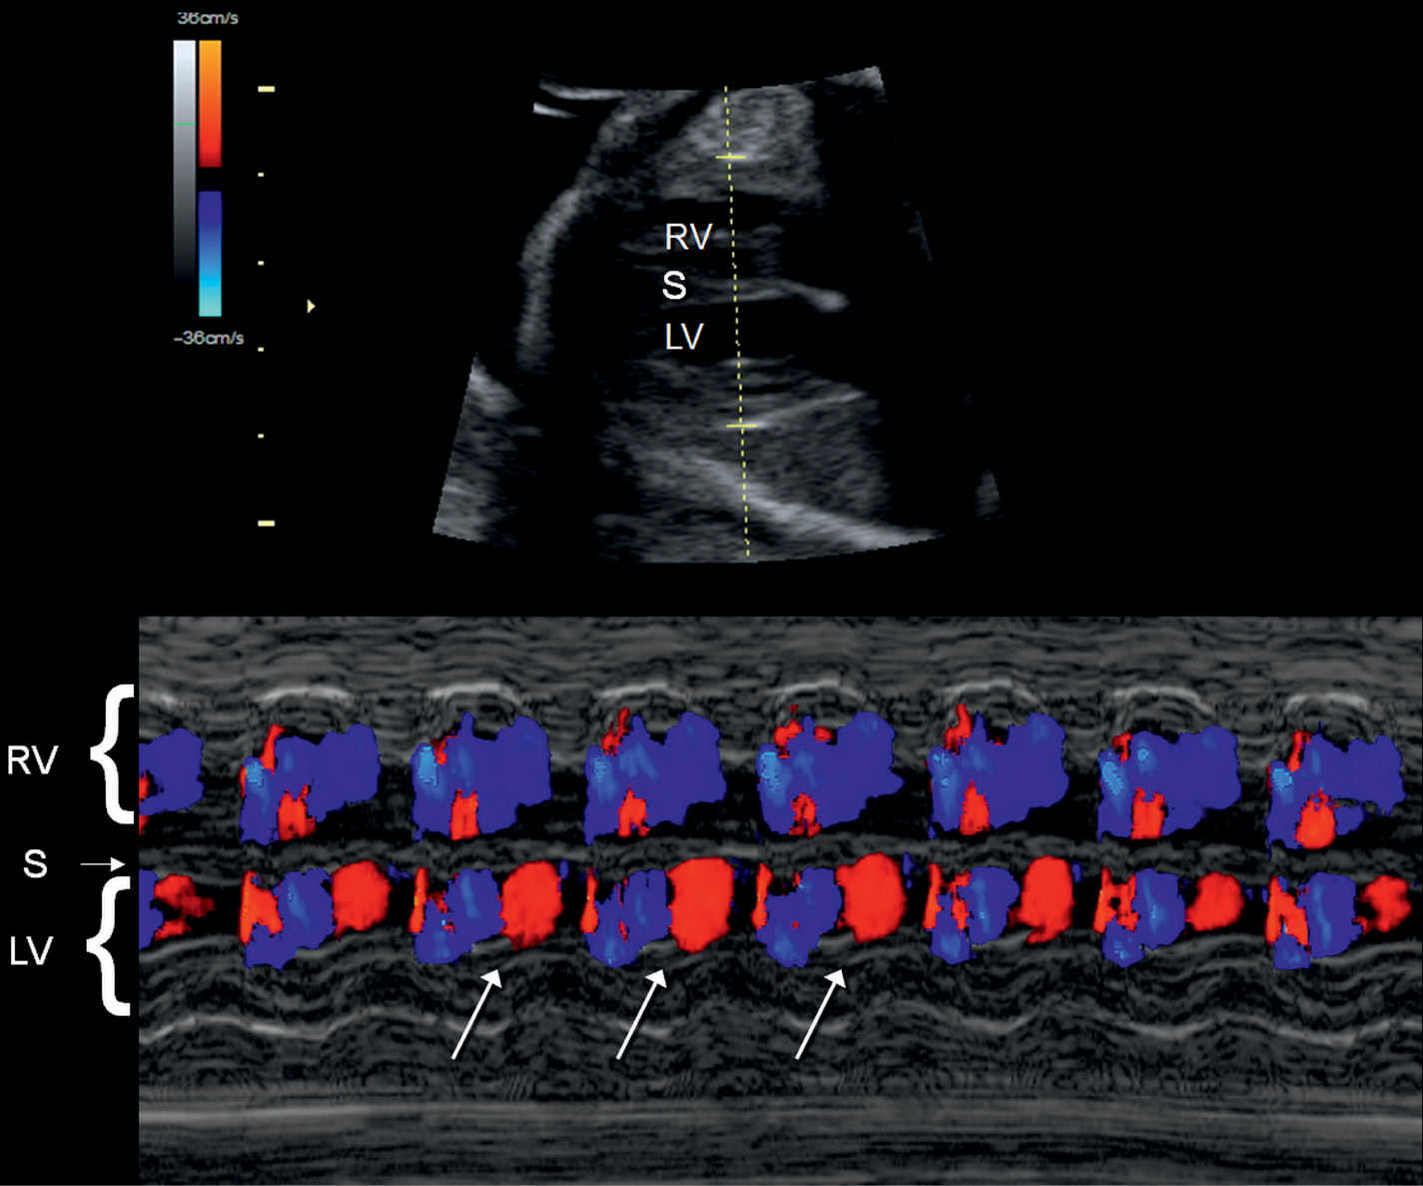
Figure 33.2: Color Doppler M-mode recording of normal sinus rhythm in a fetus. The M-mode cursor line intersects the right ventricle (RV), the interventricular septum (S), and the left ventricle (LV). Given the proximity of LV inflow and outflow, red and blue coloration is noted within the LV (oblique arrows).
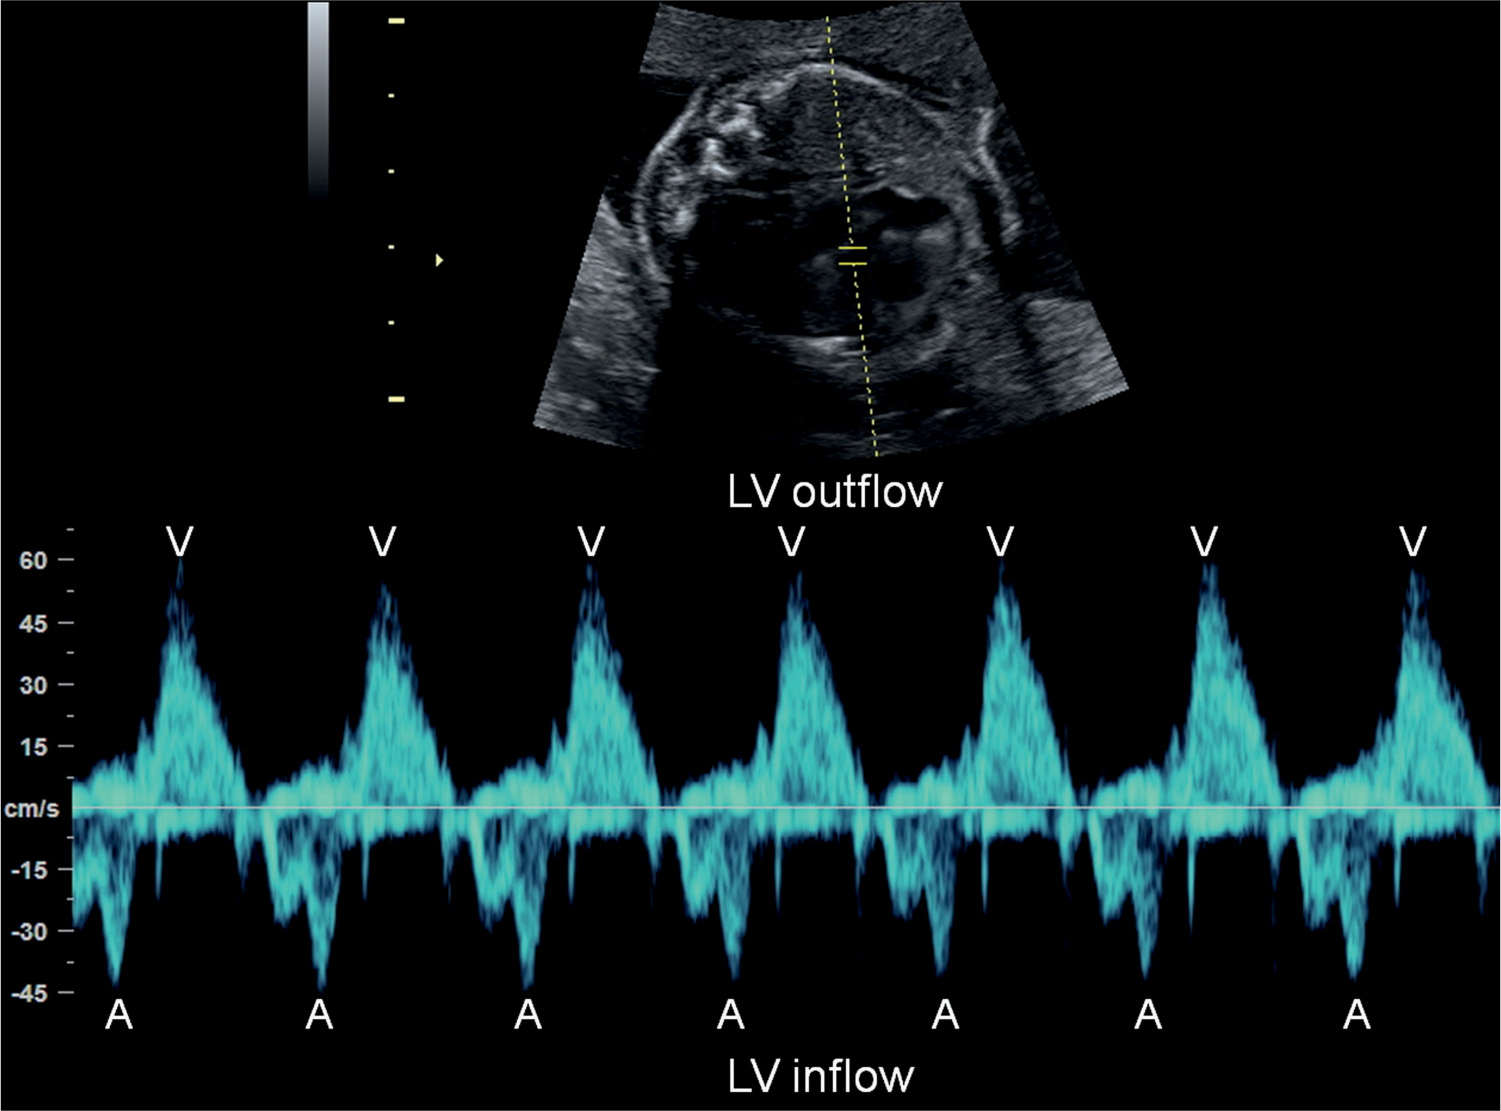
Figure 33.3: Pulsed Doppler of left ventricular (LV) inflow (mitral valve) and outflow (aortic valve) in a fetus with normal sinus rhythm. Atrial contractions (A) are identified by the start of the A-wave in the mitral valve and ventricular contractions (V) by the aortic outflow.
Fetal Electrocardiography
Fetal electrocardiography (ECG), derived by abdominal recording of fetal electrical cardiac signals, was reported and introduced about a decade ago. The difficulty of this technique involves the ability to isolate the fetal signals from the overlapping maternal ECG signals. Significant progress is under way, and future technologic improvements in this field will undoubtedly facilitate the use of fetal ECG in the classification of arrhythmias.
Tissue Doppler Imaging
Tissue Doppler imaging is a relatively new technique that allows direct analysis of segmental wall motion (myocardial velocities) in any area of the fetal heart during the same cardiac cycle (7). This technique, which gives a color-coded map of cardiac structures and their movements (Fig. 33.7), has advantages over pulsed Doppler echocardiography in assessing the chronology of atrial and ventricular systolic events. Pulsed Doppler echocardiographic assessment of the AV time interval is indirectly derived from flow measurements, which are influenced by loading condition, intrinsic myocardial properties, heart rate, and propagation speed (8). By sampling atrial and ventricular wall motion, however, tissue Doppler can provide accurate measurements of cardiac intervals and cardiac wall velocities (Fig. 33.8A,B) (8). The narrow availability of tissue Doppler equipment limits the clinical applicability of this technique. By adjusting gain and velocity of color and pulsed Doppler ultrasound, cardiac tissue Doppler imaging can be obtained with standard ultrasound equipment (9). More information on optimizing tissue Doppler display is presented in Chapter 14.
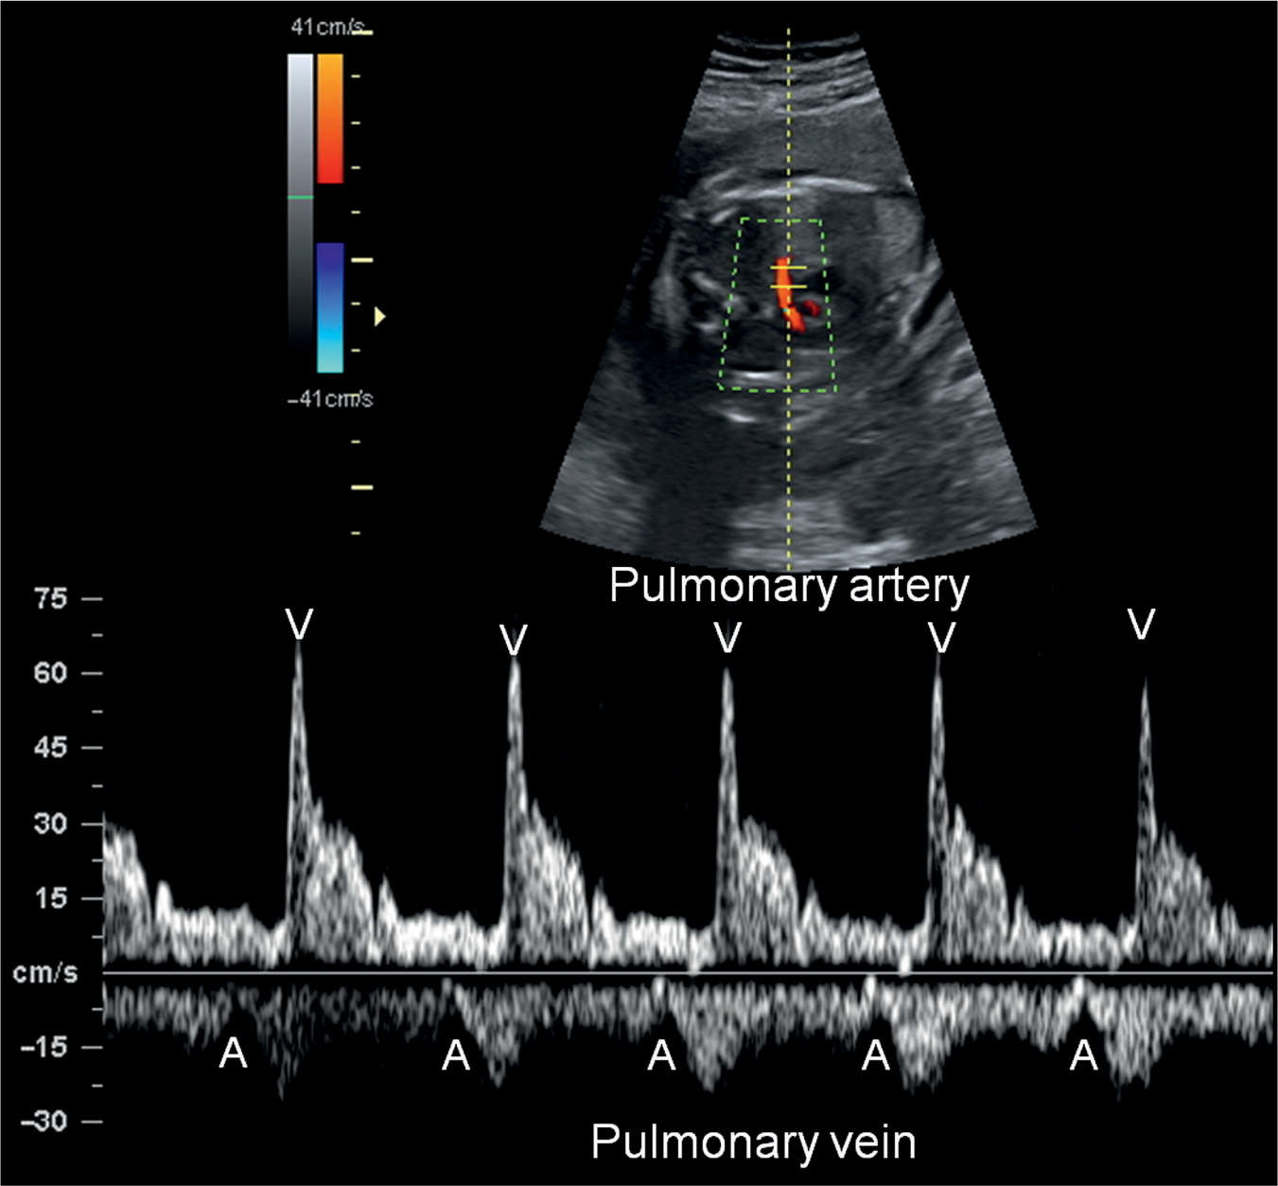
Figure 33.4: Pulsed Doppler of pulmonary artery and vein in a fetus with normal sinus rhythm. Atrial contractions (A) are identified by the start of the A-wave in the pulmonary vein Doppler waveform and ventricular contractions (V) by the pulmonary artery flow.
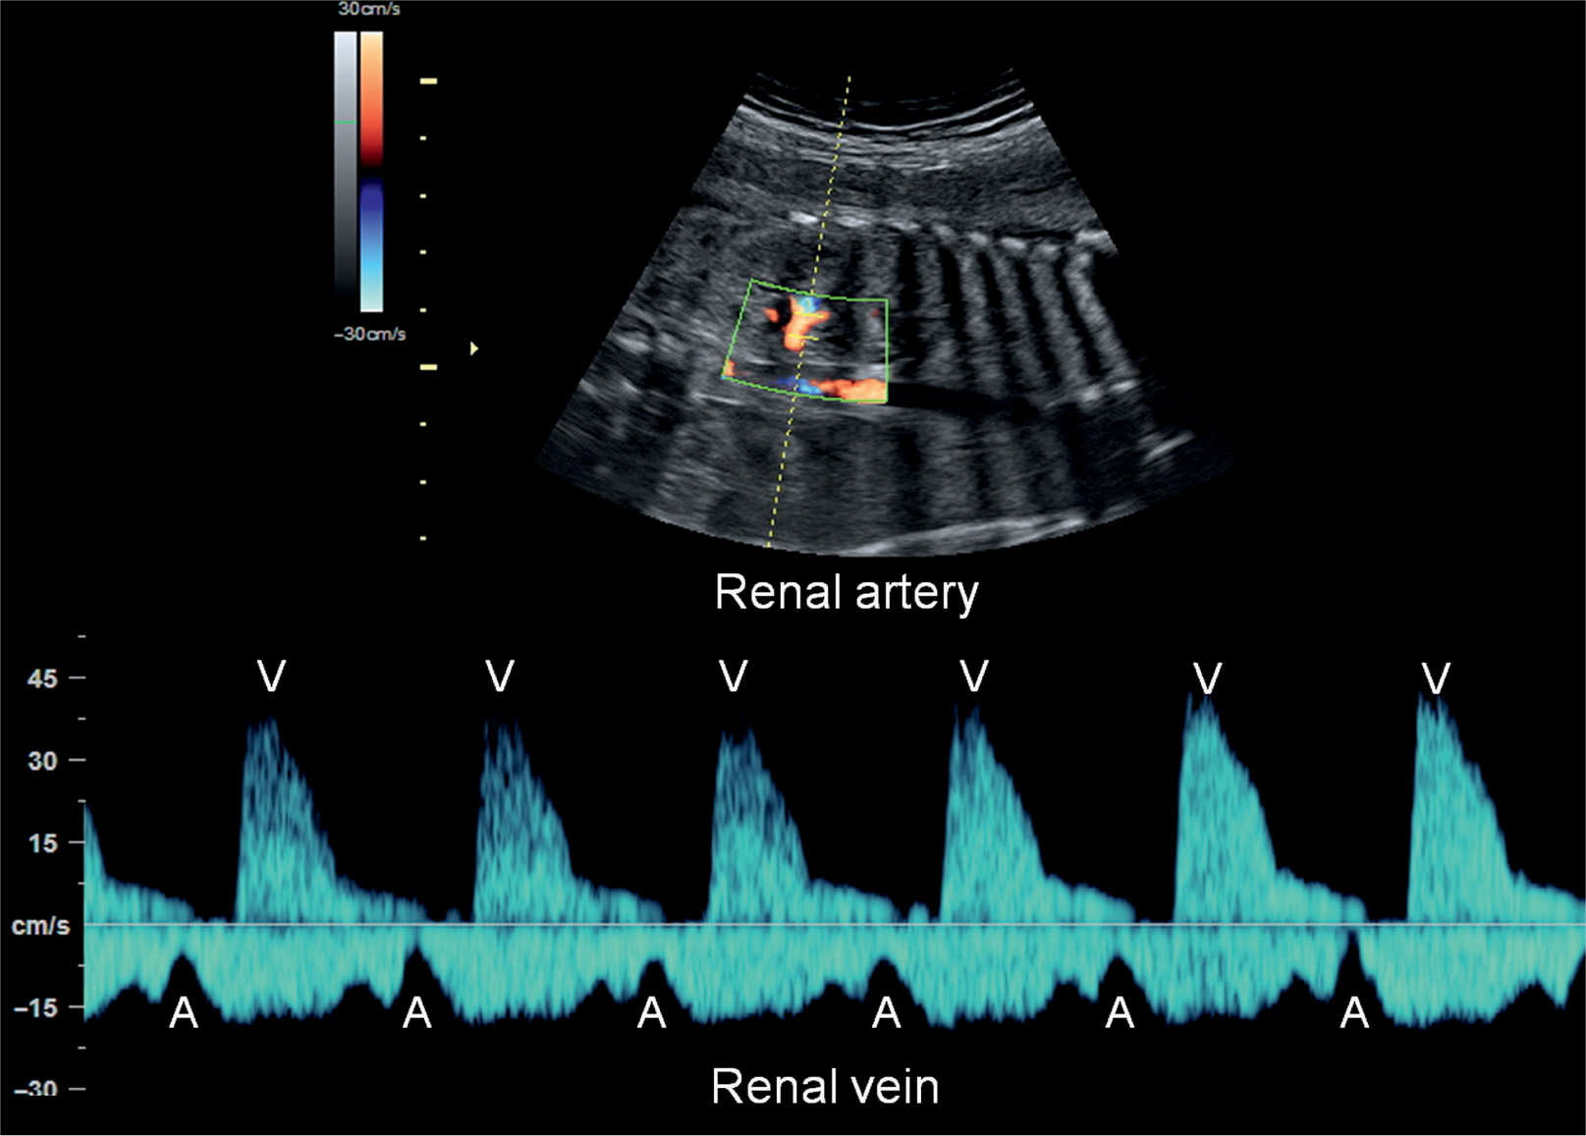
Figure 33.5: Pulsed Doppler of renal artery and vein in a fetus with normal sinus rhythm. Atrial contractions (A) are identified by the start of the A-wave in the renal vein Doppler waveform and ventricular contractions (V) by the renal artery flow.
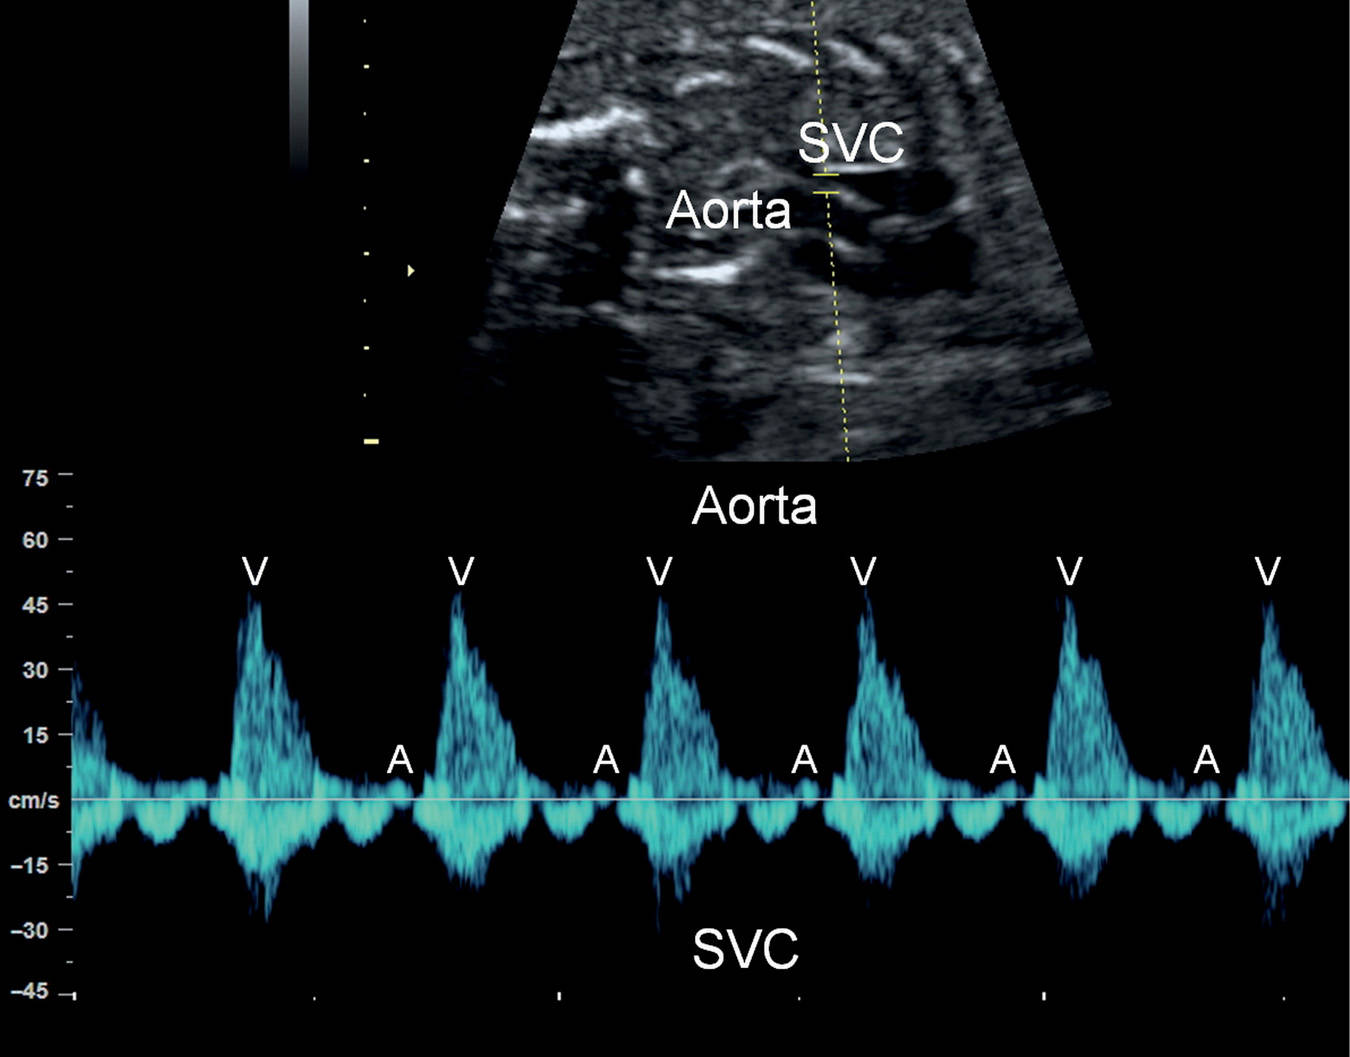
Figure 33.6: Pulsed Doppler of the aorta and superior vena cava (SVC) in a fetus with normal sinus rhythm. Atrial contractions (A) are identified by the retrograde A-wave in the SVC and ventricular contractions (V) by the aortic flow.
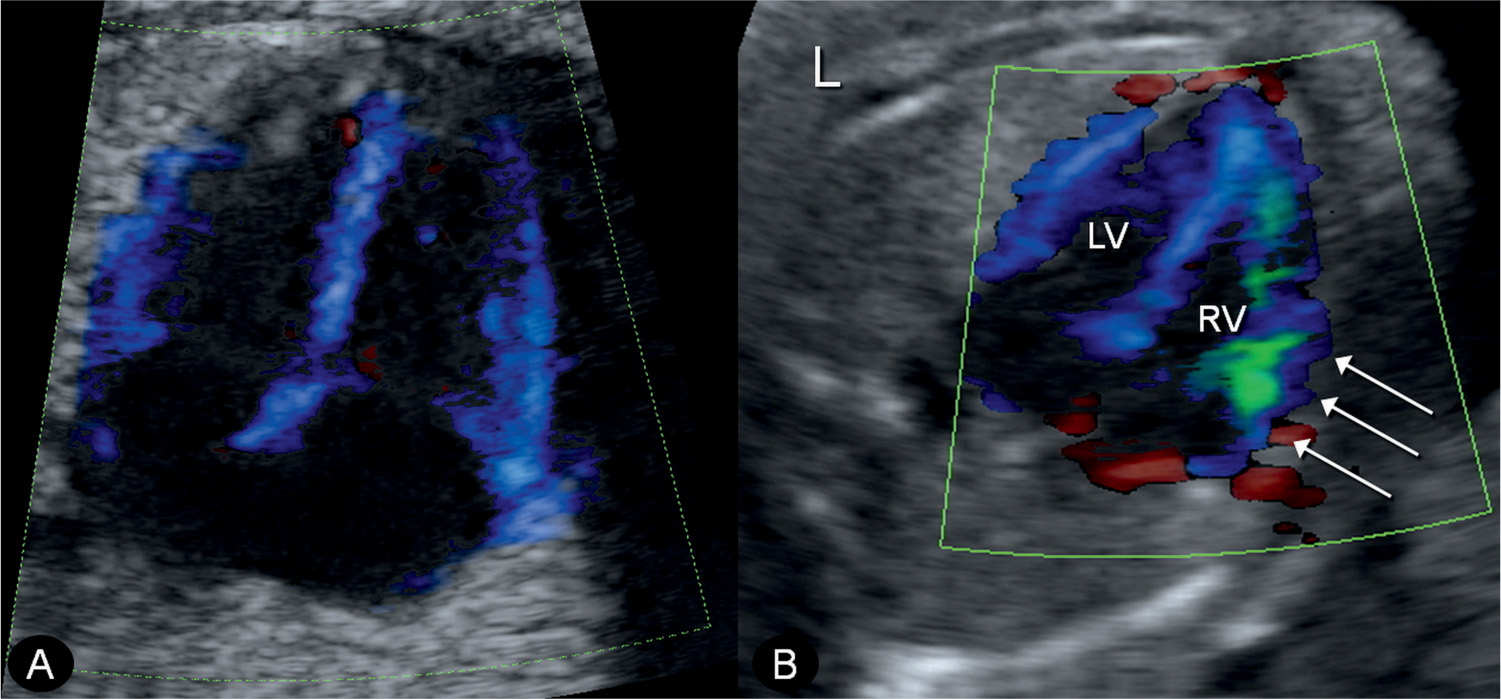
Figure 33.7: Tissue Doppler imaging at the level of the four-chamber view in a normal fetus (A) and in a fetus with anemia (B). Note the green coloration of the right ventricle (RV) in fetus B (arrows), indicating right ventricular dysfunction. L, left; LV, left ventricle.
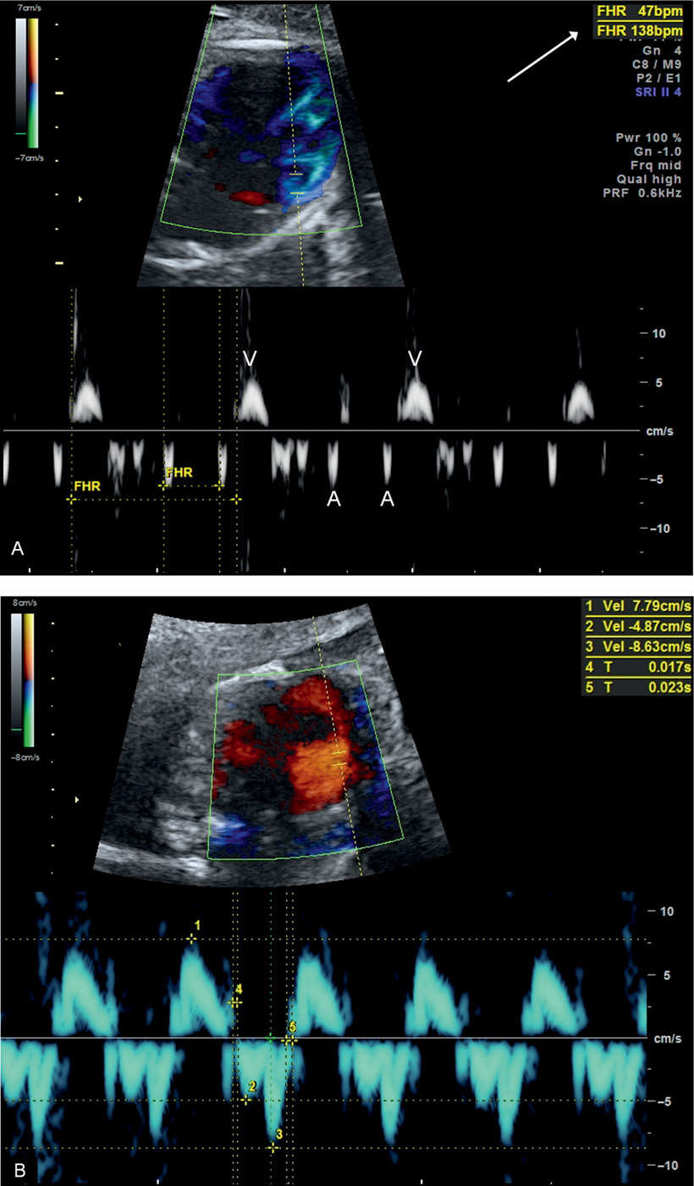
Figure 33.8: A: Tissue Doppler measurement of atrial (A) and ventricular (V) heart rate in a fetus with complete heart block. Note a normal atrial rate of 138 beats/min and a ventricular rate of 47 beats/min (arrow). B: Tissue Doppler measurement of longitudinal annular movement velocities in a normal fetus at 20 weeks’ gestation. FHR, fetal heart rate.
Magnetocardiography
Magnetocardiography records the magnetic field produced by the electrical activity of the fetal heart and uses signal averaging to generate waveforms that are very similar to those obtained by ECG. Limitations of this technology include its lack of availability in many centers and the need for a magnetically shielded room (10, 11). Successful use of this technology in an unshielded environment has been reported (12), and with improvement in magnetocardiography technology, its wide application will allow for more accurate diagnosis of fetal rhythm abnormalities.
● CLASSIFICATION OF ARRHYTHMIAS AND MANAGEMENT OPTIONS
Classification of cardiac arrhythmias in the neonate, child, and adult is aided by established criteria primarily by ECG findings. Since such technology is not technically feasible in the fetus, a more practical approach to the classification of fetal arrhythmias is used, which relies on ultrasound-derived technologies, such as M-mode, pulsed Doppler, and tissue Doppler. Fetal arrhythmias are classified into three main groups: irregular cardiac rhythm, fetal bradyarrhythmias (below 100 beats/min), and fetal tachyarrhythmias (above 180 beats/min).
Irregular Cardiac Rhythm
Irregular cardiac rhythms are the most common cause of referral for fetal arrhythmia and can be classified into premature atrial and ventricular contractions.
Premature Atrial Contractions
The majority of fetuses with irregular cardiac rhythms are found to have premature atrial contractions (PACs) (Fig. 33.9). PACs are due to atrial ectopic beats (atrial ectopy), which occur most commonly in the late second trimester of pregnancy through term and are usually benign. PACs can be either conducted or blocked, resulting in an irregular rhythm or a short pause, respectively. PACs are associated with congenital heart disease in up to 1% to 2% of cases (13) and can progress to sustained tachycardia in utero or in the first 3 to 4 weeks of life in up to 2% to 3% of cases (14, 15). Risk factors for progression of PACs to tachycardia include low ventricular rate due to multiple blocked atrial ectopic beats and complex ectopy, including bigeminy (Fig. 33.10) or trigeminy (Fig. 33.11) (13, 16). The presence of PACs in fetuses with evidence of cardiac dysfunction should alert for the possibility of supraventricular tachycardia (SVT). Weekly or biweekly assessment of cardiac rhythm by ultrasound or a handheld Doppler device is warranted until PACs resolve or delivery occurs.
Premature Ventricular Contractions
On very rare occasions, premature beats originate from the ventricle rather than the atrium and are thus termed premature ventricular contractions (PVCs). PVCs are also benign in the majority of cases. Fetal cardiac assessment, however, is warranted when PVCs are encountered. Differentiating PACs from PVCs can be difficult in the fetus. The demonstration of tricuspid regurgitation on color Doppler or a smaller A-wave in the inferior vena cava on pulsed Doppler concurrent with an ectopic beat may suggest a ventricular origin (13).
Management Options for Irregular Cardiac Rhythm
No therapy is necessary in the majority of cases with irregular cardiac rhythm when the cause is atrial or with ventricular ectopic beats as most resolve spontaneously. The authors recommend for the mother to stop known or suspected inciting factors, such as smoking, excessive caffeine ingestion, and cardiac active drugs (b-mimetics for premature contractions), when possible. Follow-up is suggested on a weekly or biweekly schedule to monitor fetal cardiac rate and rhythm in order to detect progression to fetal tachycardia, which may necessitate fetal therapy. When the fetal irregular beats are sustained until delivery, the authors recommend the performance of an ECG in the neonatal period.
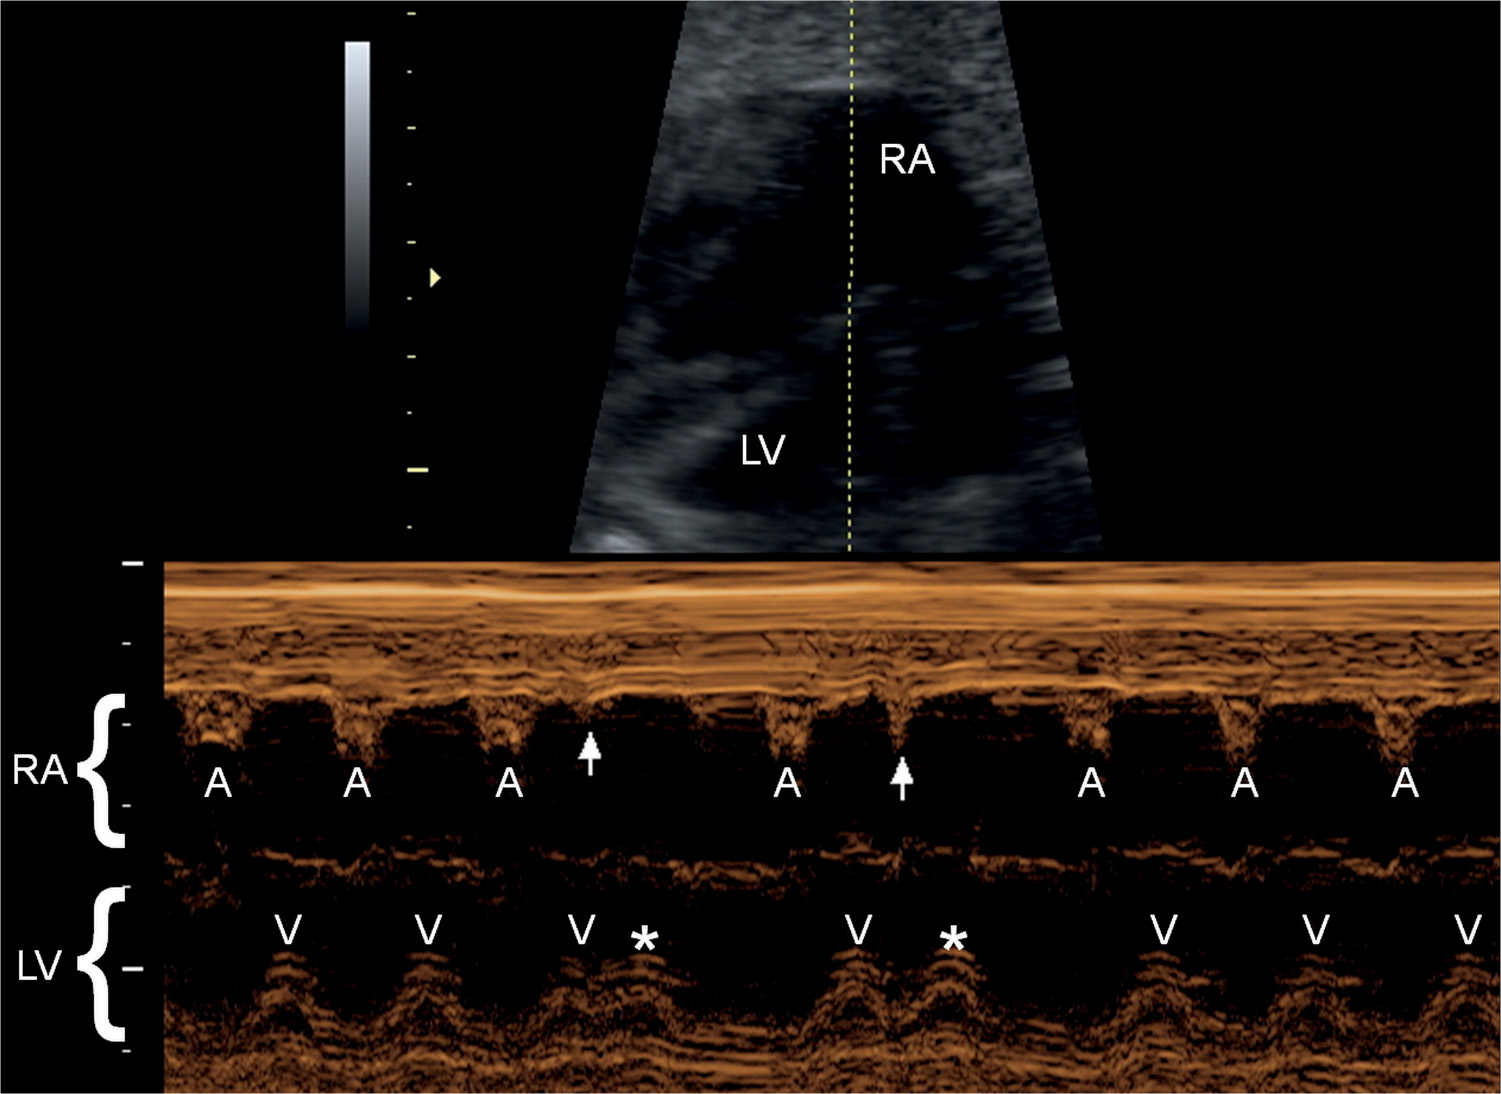
Figure 33.9: M-mode recording of a fetus with conducted premature atrial contractions. The M-mode cursor line intersects the right atrium (RA) and left ventricle (LV). Normal atrial contractions (A) are seen followed by normal ventricular contractions (V). Two premature atrial contractions are shown (arrows) followed by two premature ventricular contractions (asterisks).
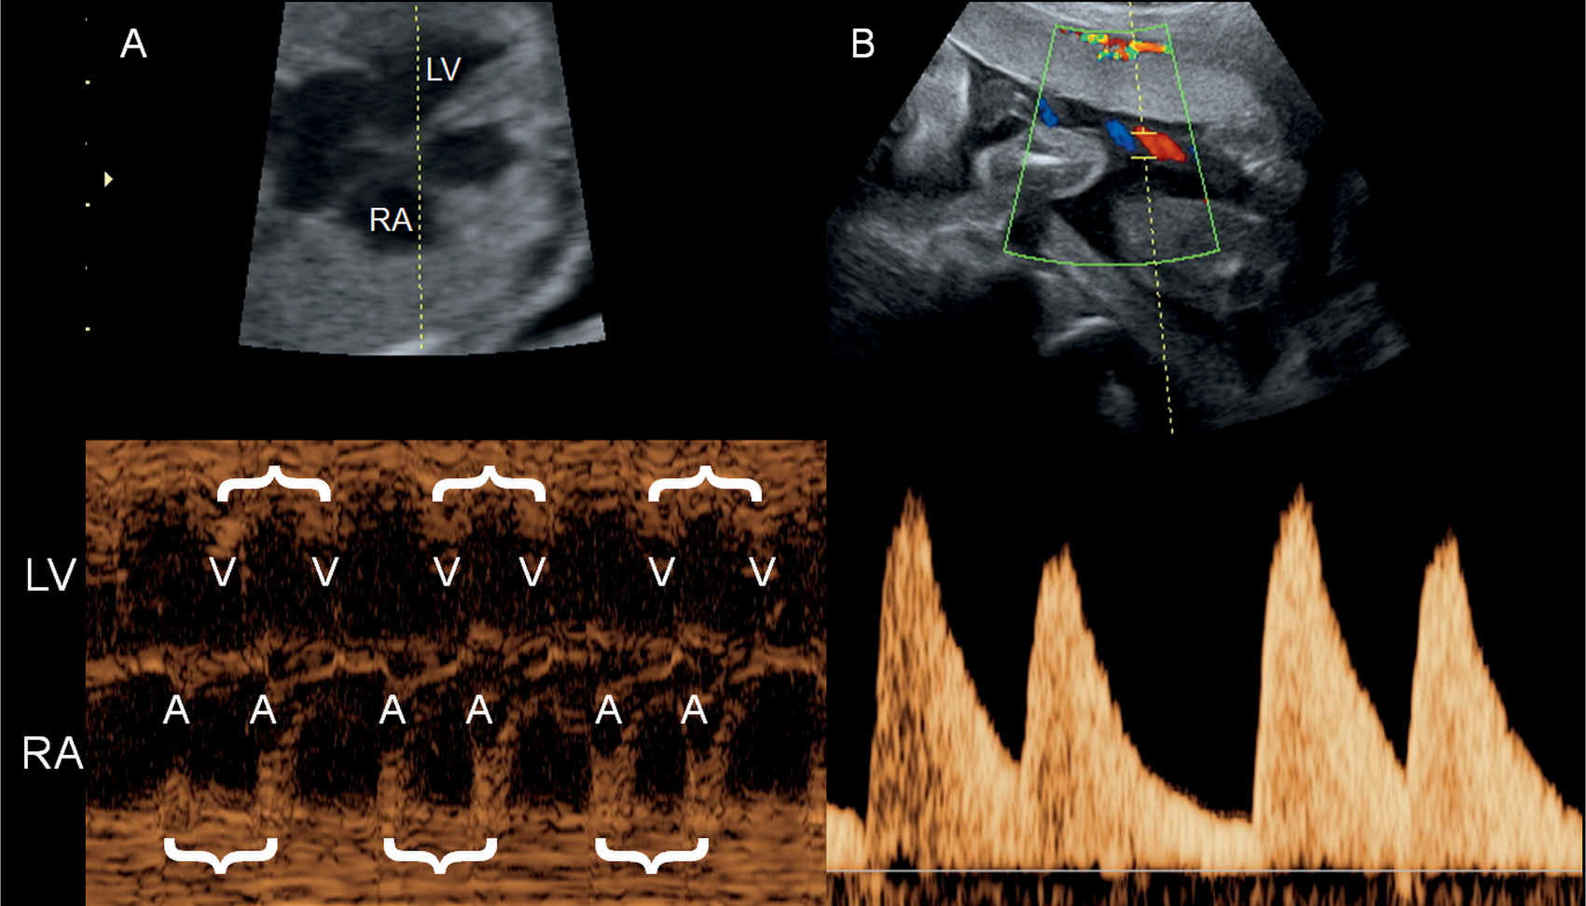
Figure 33.10: M-mode recording (A) and pulsed Doppler of the umbilical artery (B) in a fetus with bigeminy. The M-mode cursor line intersects the right atrium (RA) and left ventricle (LV). Atrial (A) and ventricular (V) contractions are in doubles (brackets) with a longer pause between the double sequence. The bigeminy is also clearly seen in the umbilical artery pulsed Doppler spectrum (B).
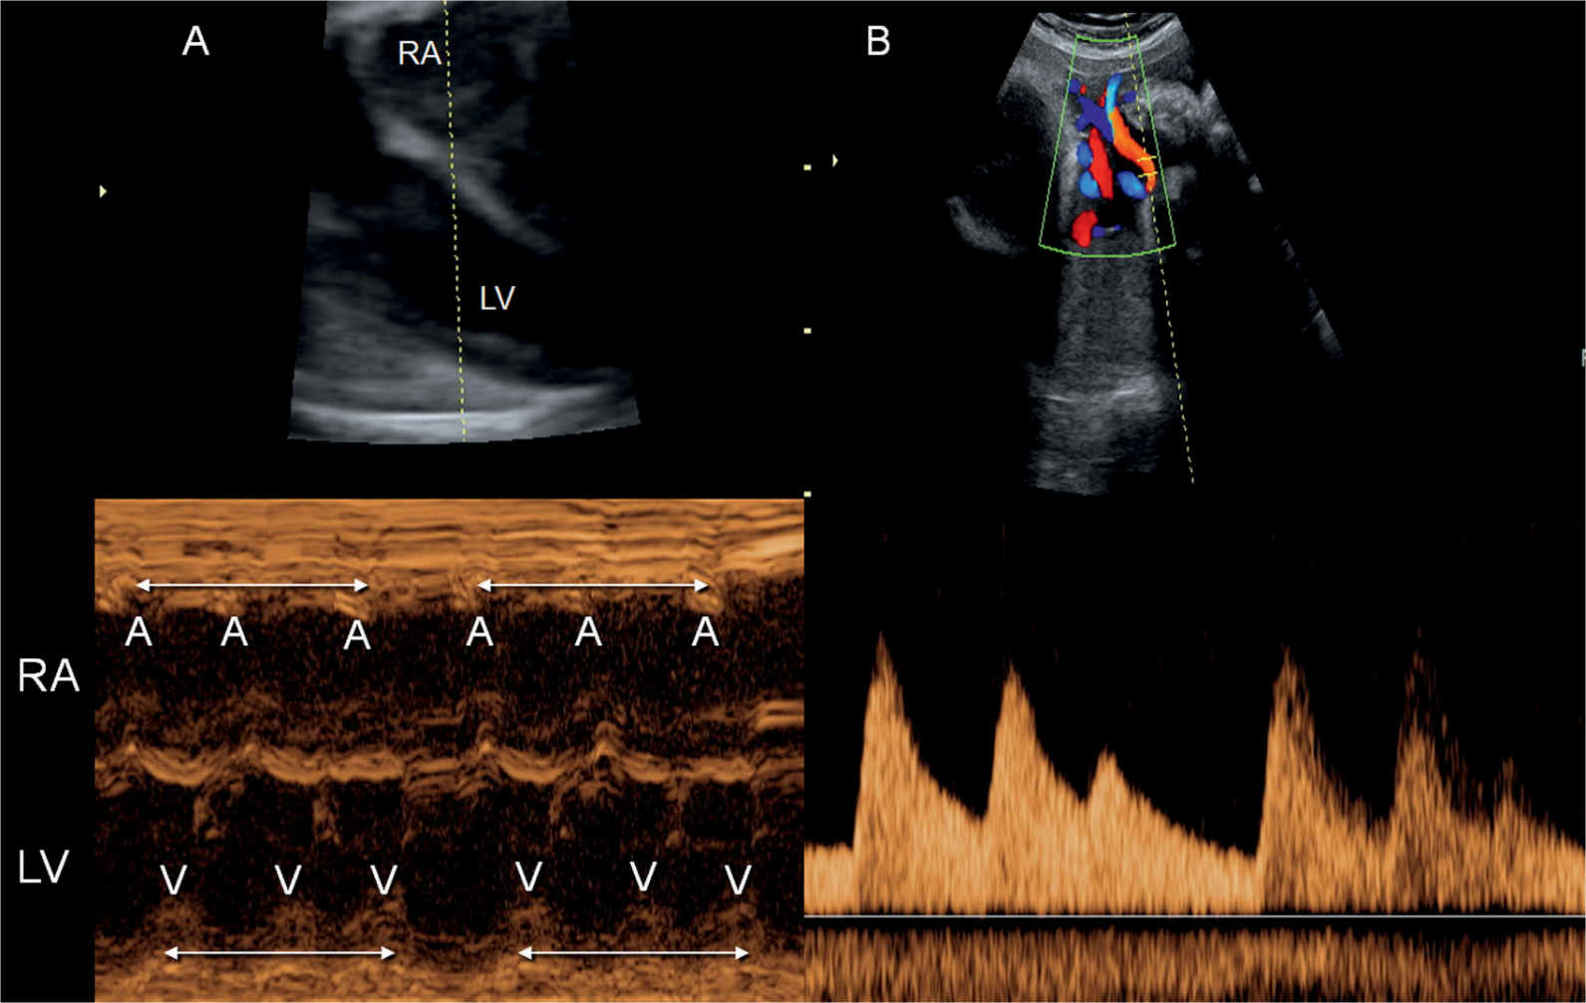
Figure 33.11: M-mode recording (A) and pulsed Doppler of the umbilical artery (B) in a fetus with trigeminy. The M-mode cursor line intersects the right atrium (RA) and left ventricle (LV). Atrial (A) and ventricular (V) contractions are in triplets (double-sided arrows) with a longer pause between the triplet sequence. The trigeminy is also clearly seen in the umbilical artery pulsed Doppler spectrum (B).
Fetal Bradyarrhythmias
Fetal bradycardia is defined by a sustained fetal heart rate of less than 100 beats/min. Transient episodes of fetal heart rate of less than 100 beats/min are usually benign and typically result from increased vagal stimulation in the fetus commonly associated with abdominal pressure by the ultrasound probe. Causes of fetal bradycardia include sinus bradycardia, blocked atrial bigeminy/trigeminy, and high-degree AV block (17).
Sinus Bradycardia
Sinus bradycardia is rare and may occur in association with sinus node dysfunction, fetal acidemia, congenital long QT syndrome, or congenital abnormalities, such as heterotaxy syndromes (18). Sinus node dysfunction can result from genetic abnormalities or from damage to a normal sinus node from infections or antibodies. Long QT syndrome is a genetic abnormality of the sodium and potassium channels regulating cardiac repolarization. Long QT syndrome is suggested in the presence of family history or when intermittent runs of ventricular tachycardia with 2:1 AV block are noted in this setting (18, 19). Characteristics of sinus bradycardia include a one-to-one AV conduction on echocardiography with a slow atrial rate.
Persistent Atrial Bigeminy or Trigeminy
Persistent atrial bigeminy or trigeminy with blocked premature beats is another cause of fetal bradycardia. Differentiating this type of bradycardia from AV heart block is critical given a divergent prognosis. In both blocked premature beats and AV heart block, the atrial rate is higher than the ventricular rate. The time interval between consecutive atrial impulses is relatively constant in AV block as opposed to a shortened atrial impulse interval on every second or third beat in bigeminy or trigeminy, respectively. Blocked premature beats are typically benign and tend to resolve with increased fetal activity.
Congenital Atrioventricular Heart Block
Up to 40% of congenital AV heart block (CAVB) cases (Fig. 33.12) occur in fetuses with congenital cardiac malformations, especially left atrial isomerism (heterotaxy) (see Chapter 30) or congenitally corrected transposition of the great arteries (see Chapter 28). In the remaining 60%, no structural fetal anomaly is found and heart block is almost always caused by a connective tissue disease (immune mediated) of the mother. In most cases, this maternal disease is not known at fetal diagnosis and should be sought. CAVB occurs in about 1 in 11,000 to 1 in 22,000 live births in the general population and in 1% to 2% of live births in pregnancies with anti-SSA/Ro antibodies, with a recurrence risk of 14% to 17% in these pregnancies (20–23). The characteristics of first-, second-, or third-degree (complete) heart block are presented in Table 33.1.
Pathogenesis of immune-mediated CAVB is thought to result from an inflammatory response and injury to the myocardium and cardiac conduction system in susceptible fetuses, initiated by the circulating maternal antibodies. Cardiac injury in immune-mediated CAVB includes myocardial dysfunction, cardiomyopathy, endocardial fibroelastosis, and conduction abnormalities (24, 25). Delayed dilated cardiomyopathy despite successful pacing is seen in up to 11% of children with immune-mediated CAVB (24). CAVB has a high mortality rate, exceeding 70%, when associated with cardiac malformations, whereas a mortality rate of 19% is reported in immune-mediated cases (26).
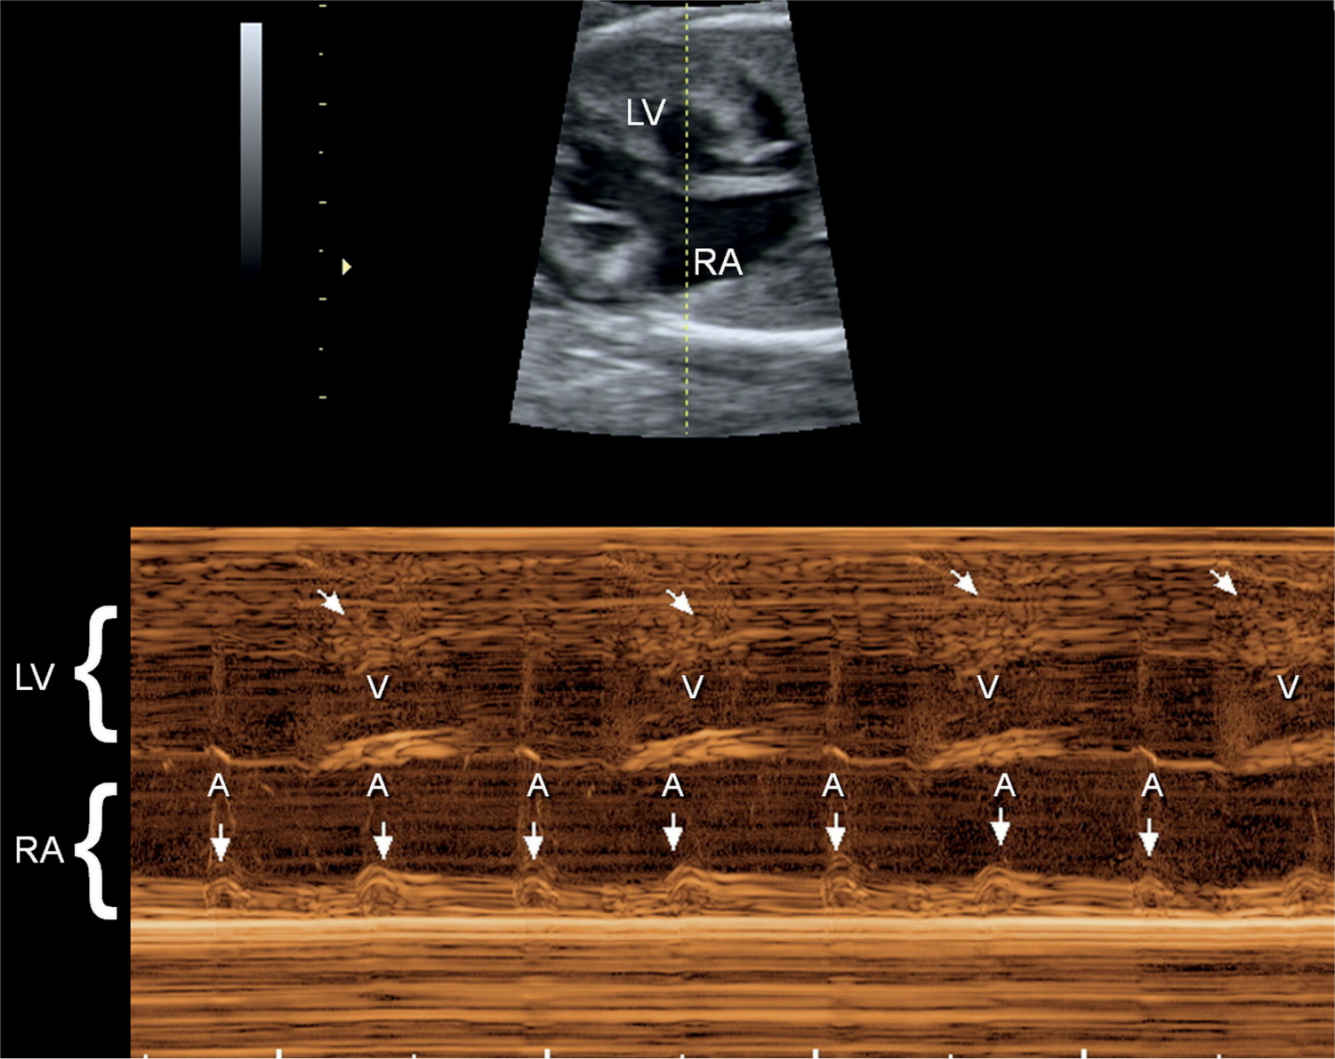
Figure 33.12: M-mode recording of a fetus with complete heart block. The M-mode cursor line intersects the left ventricle (LV) and right atrium (RA). The atrial contractions are shown by straight arrows and occur at a regular and normal rate. The ventricular contractions (V) are shown by oblique arrows and occur at a slower rate, dissociated from the atrial contractions.
Stay updated, free articles. Join our Telegram channel

Full access? Get Clinical Tree


