The Scope and Organization of Neonatology: North American and Global Comparisons


The Scope and Organization of Neonatology: North American and Global Comparisons


Judy L. Aschner

Stephen W. Patrick

Ann R. Stark

Shoo K. Lee


▪ INTRODUCTION

In the past 50 years, we have witnessed extraordinary advances in perinatal medicine accompanied by dramatic improvements in birth outcomes. The obstetrical subspecialty of maternal-fetal medicine has improved both maternal and neonatal outcomes for women with high-risk pregnancies due to fetal disorders, maternal chronic diseases, or pregnancy-associated conditions, such as toxemia and gestational diabetes. The emergence of the subspecialty of neonatology and the availability of dedicated neonatal intensive care units with advanced technology designed for the newborn have improved the survival and outcomes of infants born prematurely or with serious medical or surgical problems. In high-income, high-resource countries, an entire workforce has evolved with expertise in the unique developmental physiology and congenital and acquired diseases of the newborn. This convergence of expertise and resources describes most modern-day neonatal intensive care units in the United States (US), Canada, and high-income countries in Europe and across the globe. Multidisciplinary care has become the norm, and families are increasingly being integrated into the health care team.

The infrastructure, resources, and workforce realities are quite different in developing countries, particularly in Africa and Southeast Asia but also in developing nations of North and South America. The disparities in maternal and neonatal mortality remain striking despite recent investments and early signs of improvements in select regions. This chapter will explore the scope and organization of perinatal and neonatal health care with a focus on (1) disparities that persist in many high-resource nations based on race, ethnicity, income, and access to care and (2) the sobering perinatal outcomes statistics in low-resource, developing nations that remain our collective challenge and are directly or indirectly the result of inequalities in resource allocation, infrastructure, health literacy, and access.


▪ INFANT, NEONATAL, AND PERINATAL MORTALITY

Valid comparisons of infant mortality over time or between different countries or geographic regions require acceptance and application of standard definitions, complete and reliable data collection, and confidence in both the numerator and denominator. The latter two represent challenges when attempting to compare outcomes in countries with vastly different resources, infrastructure for data collection, and cultural expectations and values.


Infant Mortality in the United States and Other High-Resource Countries

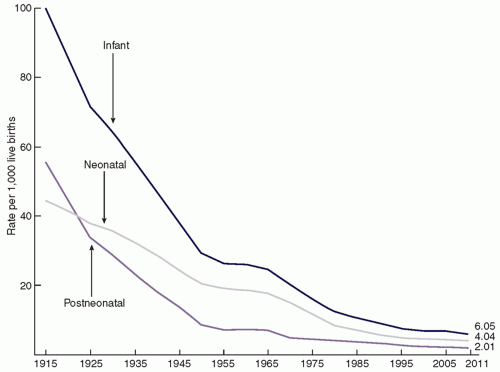
The United States first began to measure and record the IMR in 1915. As shown in Figure 1.1, during the past 100 years, the US IMR has fallen dramatically from about 100 deaths per 1,000 live births in 1915 to approximately 6 deaths per 1,000 live births in 2011 (2). Steady improvement in infant survival was interrupted by a plateau in 1955-1959 and again in 2000-2005 when the IMR appeared stalled at approximately 6.9. However, by 2011, the IMR had dropped to 6.05, a 12% decrease from 2005 through 2011 (2). The progress observed over the past century has been attributed to improved nutrition and sanitation, economic growth, advances in medical care and improved access to care (3,4).

Despite these encouraging statistics, 24,000 US infants died before their first birthday in 2011 (
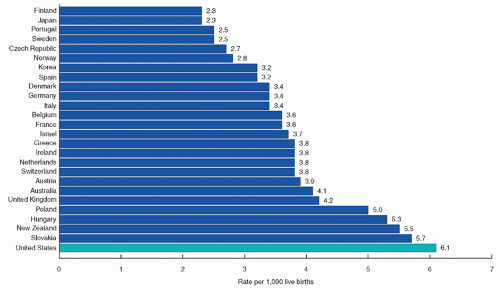
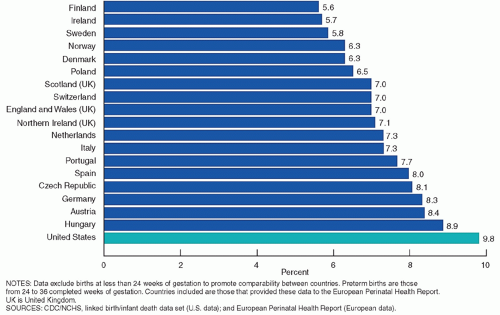
5). Moreover, the IMR in the United States is higher than in many other developed countries. In 2010, the United States ranked 26th among the 29 countries in the Organization for Economic Cooperation and Development
(OECD) (Fig. 1.2), with an IMR of 6.1 (6). When births at gestational ages under 24 weeks were excluded to better ensure international comparability, the IMR in the United States was 4.2 infant deaths per 1,000 live births, still about twice the IMR for Finland, Sweden, and Denmark, the three countries with the lowest rates after excluding deaths under 24 weeks of gestation. For infants born at 24 to 31 weeks of gestation, the IMR in the United States is comparable to the rates in most European nations; however, the United States had among the highest IMR for preterm infants born between 32 and 36 weeks of gestation and the highest rate of infant death at 37 weeks and above (2.2 per 1,000 live births in 2010) among the OECD countries (6).


TABLE 1.1 Standard Definitions of Key Perinatal Outcomes


Perinatal Outcome


Definition


Infant mortality rate


Number of deaths occurring within the first year of life per 1,000 live births


Neonatal mortality rate


Number of deaths before 29 d of age per 1,000 live births


Postneonatal mortality rate


Number of deaths between 29 d and 1 y of age per 1,000 live births


Perinatal mortality rate


Number of fetal or infant deaths from 20 weeks of gestation (or 28 wk for international comparisons) to 7 d after birth per 1,000 live births


Preterm birth


A live birth before 37 completed weeks of pregnancy


Extremely preterm


Birth before 28 weeks of gestation


Very preterm


Birth between 28 and 31 completed weeks of gestation


Moderate-to-late preterm


Birth between 32 and 36 completed weeks of gestation


Low birth weight


Birth weight <2,500 g


Very low birth weight


Birth weight <1,500 g


Extremely low birth weight


Birth weight <1,000 g


FIGURE 1.1 Infant, neonatal, and postneonatal mortality rates in the United States: 1915-2011. U.S. Department of Health and Human Services, Health Resources and Services Administration, Maternal and Child Health Bureau. Child health USA 2013. Rockville, Maryland: U.S. Department of Health and Human Services, 2013.

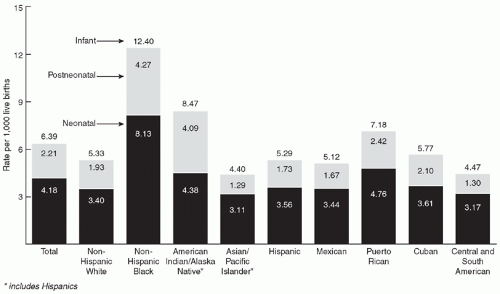
Between 2005 and 2011, the decline in IMR was 16% among black mothers, a larger drop than that observed for other racial or ethnic groups. Nonetheless, large disparities by race and ethnicity persist. The IMR for non-Hispanic black infants (12.40) is more than twice that of non-Hispanic white infants (5.33), based on 2009 data (Fig. 1.3). Infants born to American Indian/Alaska Native and Puerto Rican mothers also have higher rates of infant mortality (8.47 and 7.18, respectively) than do non-Hispanic white infants (Fig. 1.3) (2).

Congenital malformations were the leading cause of infant mortality in the United States in 2011, followed by prematurity, LBW, and sudden infant death syndrome (SIDS) (7). While birth defects have been identified as the leading cause of infant death for more than two decades, prematurity/LBW is the leading cause of infant mortality among black infants (8). Prematurity is associated with multiple causes of death, and when these are grouped together, preterm birth overtakes birth defects as the leading cause of infant death in the United States, accounting for over a third of all infant deaths (2,9).

Between 2005 and 2011, there was a drop in mortality associated with congenital malformations, prematurity/LBW, SIDS, and maternal complications, while the mortality from unintentional injuries rose slightly (6). A 20% decline in deaths attributed to SIDS is worth noting given the education campaign to place infants on their backs to sleep and other recommendations related to the sleep environment. However, some of this remarkable achievement could be related to changes in the way SIDS is diagnosed and reported.

In 2011, neonatal mortality (death in the first 28 days) was 4.04 per 1,000 live births and accounted for about two-thirds of infant deaths in the United States (2). Neonatal mortality is most often associated with congenital malformations, infection, perinatal asphyxia, preterm birth, LBW, and other perinatal conditions related to prematurity. Similar to overall infant mortality, infants born to non-Hispanic black mothers, followed by those born to Puerto Rican and American Indian/Alaska Native mothers, had the highest rates of neonatal mortality (8.13, 4.76, and 4.38, respectively) (2).


FIGURE 1.2 Infant mortality rate ranking in 2010 of the United States and other countries in the Organization for Economic Cooperation and Development. MacDorman MF, Mathews TJ, Mohangoo AD, et al. International comparisons of infant mortality and related factors: United States and Europe, 2010; National vital statistics reports vol. 63, no. 5. Hyattsville, MD: National Center for Health Statistics, 2014.


FIGURE 1.3 Infant, neonatal, and postneonatal mortality rates by race and ethnicity in the United States, 2009. U.S. Department of Health and Human Services, Health Resources and Services Administration, Maternal and Child Health Bureau. Child health USA 2013. Rockville, MD: U.S. Department of Health and Human Services, 2013.


Postneonatal mortality is most often attributed to SIDS, other sleep-related deaths, congenital malformations, and unintentional injuries. Once again, there are notable racial and ethnic disparities. Postneonatal mortality was more than twice as high for infants of both non-Hispanic black and American Indian/Alaska Native mothers (4.27 and 4.09, respectively) than for non-Hispanic whites (1.93) (2).

Perinatal mortality is another important measure of pregnancy health and takes into account fetal deaths as well as early (first week of life) neonatal deaths. There are an estimated 1 million fetal deaths reported annually in the United States (8). Most fetal deaths are caused by chronic asphyxia, congenital malformations, and pregnancy complications, such as placental abruption, diabetes mellitus, and intrauterine infections (10). Although fetal deaths, including late fetal deaths at or beyond 28 weeks of gestation, did not change significantly between 2006 and 2012, the perinatal mortality rate (fetal or infant deaths at 28 weeks of gestation until 7 days after birth per 1,000 live births) declined 4% from 6.51 per 1,000 in 2006 to 6.26 in 2011 (11). There was an 8% decline in perinatal mortality for non-Hispanic black women to 10.8 in 2011, with no significant change for non-Hispanic white and Hispanic women (11). The improvement in perinatal mortality was driven by an 8% drop in early neonatal deaths (deaths under 7 days per 1,000 live births) from 3.55 in 2006 to 3.28 in 2011, seen primarily among non-Hispanic black infants in the United States (11). Improved and more consistent reporting of fetal deaths is needed to better understand the risks factors associated with perinatal death and develop strategies for prevention.


▪ THE GLOBAL PERSPECTIVE ON INFANT MORTALITY

The dramatic decline in infant mortality during the past century was seen not only in developed countries but also in developing countries and reflects improvements in socioeconomic, sanitation, and educational conditions and in population health, most notably a reduction in malnutrition and infectious diseases. Indeed, the global IMR has declined from 152/1,000 live births in 1950 to 43/1,000 live births in 2010 (Fig. 1.4) (12). Although the disparity between developed and developing countries has narrowed, the gap remains wide, with the IMR ranging from 5/1,000 live births in developed countries to 78/1,000 live births in Africa in 2010 (13).


FIGURE 1.4 Trends for global infant mortality rate by region, 1950-2050. United Nations World Population Prospects. The 2012 revision—United Nations development. Retrieved on December 26, 2014 from http://esa.un.org/unpd/wpp/index.htm

The causes of infant mortality vary by region (Fig. 1.5), but major causes include preterm birth (35%), neonatal infections (28%), birth complications (23%), congenital anomalies (9%), and others (6%) (14). Preterm birth is the leading cause of infant deaths worldwide, accounting for almost 1 million deaths in 2013. The rate of preterm births ranges from 5% to 18%, with the highest incidence occurring in developing countries, but the incidence is increasing in almost all countries.


▪ THE BURDEN OF PRETERM BIRTH: US AND GLOBAL PERSPECTIVES

The preterm birth rate is an important driver of a nation’s IMR and a leading cause of childhood disabilities. In 2012, the March of Dimes, the Partnership for Maternal, Newborn and Child Health, Save the Children, and the WHO published “Born Too Soon: The Global Action Report on Preterm Birth” (15). This report provided estimates of preterm birth by country. Approximately 15 million babies, or about 1 in 10 infants, are born preterm annually. Over 1 million of these infants died in 2013, making preterm birth complications the leading cause of death among children under 5 years of age. Across 184 countries, the rate of preterm birth ranged from 5% to 18% of all live births (16).

Resource-poor regions of the world have excessive burdens of preterm birth, LBW, small size for gestational age, stillbirth, infant mortality, and maternal mortality. More than 60% of preterm births occur in Africa and Southeast Asia (16). The countries with the highest number and the highest rates of preterm birth are shown in Table 1.2.

After excluding infants born before 24 weeks of gestation, the United States had the highest preterm birth rate among the 19 countries shown in Figure 1.6 (6). The percent of preterm births in the United States was about 40% higher than in countries in the United Kingdom and nearly 75% higher than in some Scandinavian countries (6). Recent US data indicate some progress, with the rate of preterm birth falling annually from a peak of 12.8 in 2006 to 11.39 in 2013. Declines in preterm rates since 2006 were reported in 49 states and the District of Columbia (17). The reduction in the percent of US babies born prematurely is a likely contributor to the improving infant mortality statistics because about two-thirds of all infant deaths occur among those born preterm.


FIGURE 1.5 Estimated distribution of causes for 4 million neonatal deaths for the six WHO regions in 2000. Lawn JE, Wilczynska-Ketende K, Cousens SN. Estimating the causes of 4 million neonatal deaths in the year 2000. Intern J Epidemiol 2006;35:706, by permission of the International Epidemiological Association. doi: 10.1093/ije/dyl043.

There are striking global inequalities in survival rates for infants born preterm. In low-income settings, mortality for infants born at 32 weeks is about 50%; almost all of these babies survive in high-income countries. These stark disparities are due to a lack of basic and essential care, such as warmth, breastfeeding support, antibiotics, and supplemental oxygen. In low-income countries, more than 90% of extremely preterm babies (<28 weeks) die in the first few days of life; less than 10% of these babies die in high-income countries (15).

Most preterm births happen spontaneously, but in high-income countries, some preterm births are due to early induction of labor or caesarean birth, for medical and nonmedical reasons. Late preterm births comprise the vast majority of all preterm births. Compared to term infants, these infants have a higher incidence of morbidity, including respiratory distress syndrome, temperature instability, and jaundice and have three times the IMR (1,18,19). Late preterm infants experience longer hospital stays and are more likely to incur higher hospital costs associated with NICU admissions than do term infants (20). Even infants born at 37 and 38 weeks of gestation have worse outcomes compared to infants born at 39 and 40 weeks of gestation. Despite a low absolute risk of infant death, singleton infants born at 37 weeks had increased neonatal mortality rates, compared to infants born at 40 weeks (0.66 and 0.34 per 1,000 live births, respectively) (21). Those born electively at 37 and 38 weeks had increased rates of respiratory problems and were more likely to be admitted to a NICU, compared to those born at 39 weeks (22,23).


TABLE 1.2 Countries with the Greatest Number and Highest Rate of Preterm Births


Countries with the Greatest Number of Preterm Birth


Countries with the Highest Rate of Preterm Birth Per 100 Live Births


India


3,519,100


Malawi


18.1


China


1,172,300


Comoros


16.7


Nigeria


773,600


Congo


16.7


Pakistan


748,100


Zimbabwe


16.6


Indonesia


675,700


Equatorial Guinea


16.5


United States


517,400


Mozambique


16.4


Bangladesh


424,100


Gabon


16.3


Philippines


348,900


Pakistan


15.8


Congo


341,400


Indonesia


15.5


Brazil


279,300


Mauritania


15.4


Blencowe H, Lee ACC, Cousens S, et al. Preterm birth-associated neurodevelopmental impairment estimates at regional and global levels for 2010. Pediatr Res 2013;74:17.


A public education campaign launched by the March of Dimes, called “Healthy Babies are Worth the Wait,” and a similar campaign called “Healthy Start” sponsored by the Department of Health and Human Services discourage scheduled deliveries before 39 weeks. These measures aimed at the public have been accompanied by strong statements by professional organizations including the American College of Gynecologists and the American Academy of Pediatrics to avoid nonmedically indicated deliveries before 39 weeks. These recommendations have been reinforced by regional and statewide perinatal quality collaboratives (PQCs) and initiatives championed by individual hospitals and hospital systems.


▪ MAJOR NEONATAL MORBIDITIES

Preterm birth is associated with both short-term (infection, necrotizing enterocolitis, bronchopulmonary dysplasia, intraventricular hemorrhage, and retinopathy of prematurity) and long-term complications. Infants born very preterm (<32 weeks of completed gestation) are at greatest risk of death and long-term disability. Many preterm babies face a lifetime of disability, developmental delay, learning disabilities, and neurosensory deficits, with the largest impact occurring in developing countries. Worldwide, it is estimated that over 911,000 preterm survivors (7%) each year suffer
long-term neurodevelopmental disabilities, including 345,000 who are moderately or severely affected. For infants born under 28 weeks of gestation, 52% suffer some degree of neurodevelopmental impairment, compared to 24% for infants born at 28 to 31 weeks of gestation and 5% for infants born at 32 to 36 weeks of gestation. Table 1.3 (15) lists some of the major long-term adverse outcomes suffered by preterm infants. Figure 1.7 shows the distribution of worldwide deaths and disabilities from preterm births (16).


FIGURE 1.6 Percentage of preterm births: comparison of the United States with selected European countries, 2010. MacDorman MF, Mathews TJ, Mohangoo AD, et al. International comparisons of infant mortality and related factors: United States and Europe, 2010; National vital statistics reports vol. 63, no. 5. Hyattsville, MD: National Center for Health Statistics, 2014.


TABLE 1.3 Long-term Impact of Preterm Birth


Long-term Outcomes


Examples


Frequency in Survivors


Specific physical effects


Visual impairment


  • Blindness or high myopia after retinopathy of prematurity


  • Increased hypermetropia and myopia


Around 25% of all extremely preterm affected


Also risk in moderately preterm babies especially if poorly monitored oxygen therapy


Hearing impairment


Up to 5%-10% of extremely preterm


Chronic lung disease of prematurity


  • From reduced exercise tolerance to requirement for home oxygen


  • Increased hospital admissions in childhood for LRTI


Up to 40% of extremely preterm


Long-term cardiovascular ill-health and noncommunicable disease


  • Increased blood pressure


  • Reduced lung function


  • Increased rates of asthma


  • Growth failure in infancy, accelerated weight gain in adolescence


Full extent of burden still to be quantified


Neurodevelopmental/behavioral effects (83)


Mild


Disorders of executive functioning


  • Specific learning impairments, dyslexia, reduced academic achievement


Moderate to severe


Global developmental delay


  • Moderate/severe cognitive impairment


  • Motor impairment


  • Cerebral palsy


Affected by gestational age and quality of care dependent


Psychiatric/behavioral sequelae


  • Attention deficit hyperactivity disorder


  • Increased anxiety and depression


Family, economic, and societal effects


Impact on family


Impact on health service


Intergenerational


  • Psychosocial, emotional, and economic


  • Cost of care (7)—acute and ongoing


  • Risk of preterm birth in offspring


Common varying with medical risk factors, disability, socioeconomic status


March of Dimes, PMNCH, Save the Children, WHO. Born too soon: the global action report on preterm birth. In: Howson CP, Kinney MV, Lawn JE, eds. Geneva, Switzerland: World Health Organization, 2012.


FIGURE 1.7 Worldwide deaths and disabilities for babies born preterm in 2010. Blencowe H, Lee ACC, Cousens S, et al. Preterm birth-associated neurodevelopmental impairment estimates at regional and global levels for 2010. Pediatr Res 2013;74:17.


▪ MATERNAL RISK FACTORS FOR POOR PREGNANCY OUTCOMES

Common causes of preterm birth include multiple pregnancies, infections, and chronic conditions, such as diabetes and high blood pressure. There is also a genetic influence. However, often no cause is identified. The best predictors of having a preterm birth are multifetal pregnancy or history of previous preterm labor/delivery. The major risk factors for poor pregnancy outcomes in high-income countries are shown in Table 1.4.

In developing countries, maternal risk factors for poor pregnancy outcomes are often different from those in developed countries. Teenage pregnancy, poverty, and access to health care are among the most important determinants of poor pregnancy outcomes (24). In many countries, poverty is associated with poor nutrition, unhealthy lifestyles, obesity, and poor oral health, all of which are associated with poor pregnancy outcomes (25). WHO estimates that 22% of the world population in 2008 live in absolute poverty, with the highest rates occurring in South Asia (36%) and sub-Saharan Africa (47%) (26). Absolute poverty is defined as a condition characterized by severe deprivation of basic human needs, including food, safe drinking water, sanitation facilities, health, shelter, education, and information. It depends not only on income but also on access to services (27). Maternal underweight (odds ratio 1.32) and overweight (odds ratio 1.07) are both risk factors for preterm birth and pregnancy complications including hypertension, gestational diabetes, postpartum hemorrhage, stillbirth, and congenital anomalies (28). In rapidly developing economies like the BRICS (Brazil, Russia, India, China, South Africa) countries, maternal obesity and diabetes are emerging as significant health problems (29). Maternal diabetes before pregnancy increases the risk for pregnancy loss, stillbirth, preterm labor, congenital anomalies, hypertension, and delivery by caesarean section (30). Folic acid deficiency is linked to neural tube defects in newborn infants, and anemia increases the risk for maternal mortality, LBW, preterm birth, and child mortality (31). Maternal depression also increases the risk for preterm birth, stillbirth, and peripartum and postpartum depression (32). Use of addictive substances is another important risk. Tobacco smoking increases the risk for preterm birth, LBW, respiratory problems, and risk for cognitive impairment, while alcohol use can cause fetal alcohol syndrome and intellectual impairment (33,34). In some countries such as those in sub-Saharan Africa, infections such as malaria pose additional risks (35).


TABLE 1.4 Risk Factors for Preterm Birth and Poor Pregnancy Outcomes


Multifetal pregnancy


Low prepregnant weight


History of prior preterm delivery


Folic acid deficiency


Maternal age <17 or >35 y


Obesity


Black race


Infection


Low socioeconomic status


Bleeding


Unmarried


Anemia


Previous fetal or neonatal death


Toxic stress


Three or more spontaneous fetal losses


Lack of social supports


Uterine abnormalities


Tobacco use


Incompetent cervix


Illicit drug use


Genetic predisposition


Alcohol abuse

Only gold members can continue reading. Log In or Register to continue

Stay updated, free articles. Join our Telegram channel

May 30, 2016 | Posted by in PEDIATRICS | Comments Off on The Scope and Organization of Neonatology: North American and Global Comparisons

Full access? Get Clinical Tree

Get Clinical Tree app for offline access