● INTRODUCTION
The application of fetal echocardiography in clinical practice is primarily used to identify fetuses with structural heart abnormalities. For this purpose, extensive expertise has amassed over the past 30 years and the ability of current ultrasound technology to identify major and minor cardiac malformations is well established. Accumulating literature suggests that with recent advancement in ultrasound, the evaluation of fetal cardiac function is now possible. Assessment of fetal cardiac function has been shown to be of clinical value in several high-risk pregnancy conditions, such as intrauterine growth restriction (IUGR), twin–twin transfusion syndrome (TTTS), maternal diabetes in pregnancy, and fetal hydrops. With recent evidence suggesting that fetal adaptation to adverse pregnancy outcome plays a central role in the long-term effect of adult health (1), the field of fetal functional echocardiography will expand substantially. In this chapter, we present an overview of the fetal cardiac circulation and review current techniques used to assess fetal cardiac function in various clinical conditions.
● FETAL CARDIAC CIRCULATION
The fetal circulation is different from the adult circulation in many respects. The fetal circulation is in parallel rather than in series and the right ventricular cardiac output is greater than the left ventricular cardiac output (2, 3). The patency of the foramen ovale and the ductus arteriosus in the fetus allows blood to flow from the right to the left circulation, bypassing the lung. The majority of blood that is ejected from the right ventricle is directed through the ductus arteriosus into the thoracic aorta with a small portion of cardiac output entering the lungs through the right and left pulmonary arteries (3). About 50% of the blood flowing through the thoracic aorta returns to the placenta via the umbilical arteries (4). Oxygenation occurs in the placenta and the highly oxygenated blood returns to the fetus through the umbilical vein. About half of the blood in the umbilical vein enters the ductus venosus, the remainder entering the portal system and hepatic veins (4). Blood from the ductus venosus and left hepatic veins enters the heart at the subdiaphragmatic vestibulum and is then preferentially streamed into the left atrium through the foramen ovale (5, 6). From the left atrium, blood enters the left ventricle and is then ejected into the aorta during systole. The presence of right to left shunts at the level of the foramen ovale and ductus arteriosus has a significant impact on cardiac flow patterns and affects the distribution of blood and oxygen to various organs. This shunting mechanism ensures the delivery of blood with high oxygen content to the coronary and cerebral circulations.
Right ventricular volume flow exceeds left ventricular volume flow in the fetus by a ratio of 1.3:1 (3, 7). The combined ventricular output of the fetus at term is approximately 1,735 mL/min, whereas flow indicated for estimated fetal weight is constant at a mean value of 553±153 mL/min/kg (8). Stroke volume increases exponentially with advancing gestation (9). It increases from 0.7 mL at 20 weeks to 7.6 mL at term for the right ventricle and 0.7 mL at 20 weeks to 5.2 mL at term for the left ventricle (9). Doppler studies in humans confirm that the Frank–Starling mechanism is operational in the fetal heart, where an increase in preload results in an increase in ventricular stroke volume (10).
The progressive development of organs during gestation influences blood distribution and vascular impedance (2). With advancing gestation, ventricular compliance is increased, total peripheral resistance is decreased, preload is increased, and combined cardiac output is increased (2). Compliance of the fetal left heart increases more rapidly than compliance of the fetal right heart with advancing gestation (2). The pulmonary vascular resistance is high in the fetus and the pulmonary arterial pressure is almost systemic (11). Flow to the pulmonary vascular bed is maintained at a low rate with a noted increase toward the end of gestation (3, 11). Cardiac output in the fetus is mainly affected by preload and ventricular compliance (2).
In postnatal life, through vasoactive and passive processes, which involve obliteration of the umbilical–placental circulation, changes in pulmonary vascular resistance and left–right pressure gradients, the three circulatory shunts close, thus converting the fetal circulation to the adult circulation with the entirety of left ventricular output delivered to the systemic circulation and the entirety of right ventricular output delivered to the pulmonary circulation.
● THE CARDIAC CYCLE
In normal conditions, the cardiac cycle involves five distinct phases:
1. Early Diastole: Early diastole starts with ventricular filling with the opening of the atrioventricular valves. Ventricular pressure stays constant during early diastole due to progressive ventricular relaxation. Blood fills the ventricles in this phase in a passive manner (Fig. 14.1).
2. Atrial Contraction: The atrial contraction occurs in late diastole and results in complete filling of the ventricles. In the atrial contraction phase, a slight increase in ventricular pressure is noted (Fig. 14.2).
3. Isovolumetric Contraction: This phase begins with myocardial contractility and is thus the beginning of systole. During the isovolumetric contraction phase of the cardiac cycle, ventricular pressure rises steeply with no change in ventricular volume as both the atrioventricular and semilunar valves are closed (Fig. 14.3). The mean duration of the isovolumetric contraction time (IVCT) is 28 ms with a range of 22 to 33 ms (12, 13).
4. Ejection Phase: As the ventricular pressure continues to rise, it exceeds pressure within the great arteries and the semilunar valves open resulting in rapid ejection of blood. With ventricular ejection, myocardial deformation ensues and this phase is associated with a drop in ventricular volume and pressure (Fig. 14.4). The mean duration of the ejection phase, termed ejection time (ET), is 175 ms with a range of 159 to 195 ms (12, 13).
5. Isovolumetric Relaxation: As the ventricular pressure drops below the pressure within the great arteries, the semilunar valves close. A period of isovolumetric relaxation ensues, which is associated with decreased ventricular pressure with no change in ventricular volume as the atrioventricular valves are closed (Fig. 14.5). The mean duration of the isovolumetric relaxation time (IVRT) is 34 ms with a range of 26 to 41 ms (12, 13). As the ventricular pressure decreases below that of the atria, the atrioventricular valves open and the cycle repeats itself.
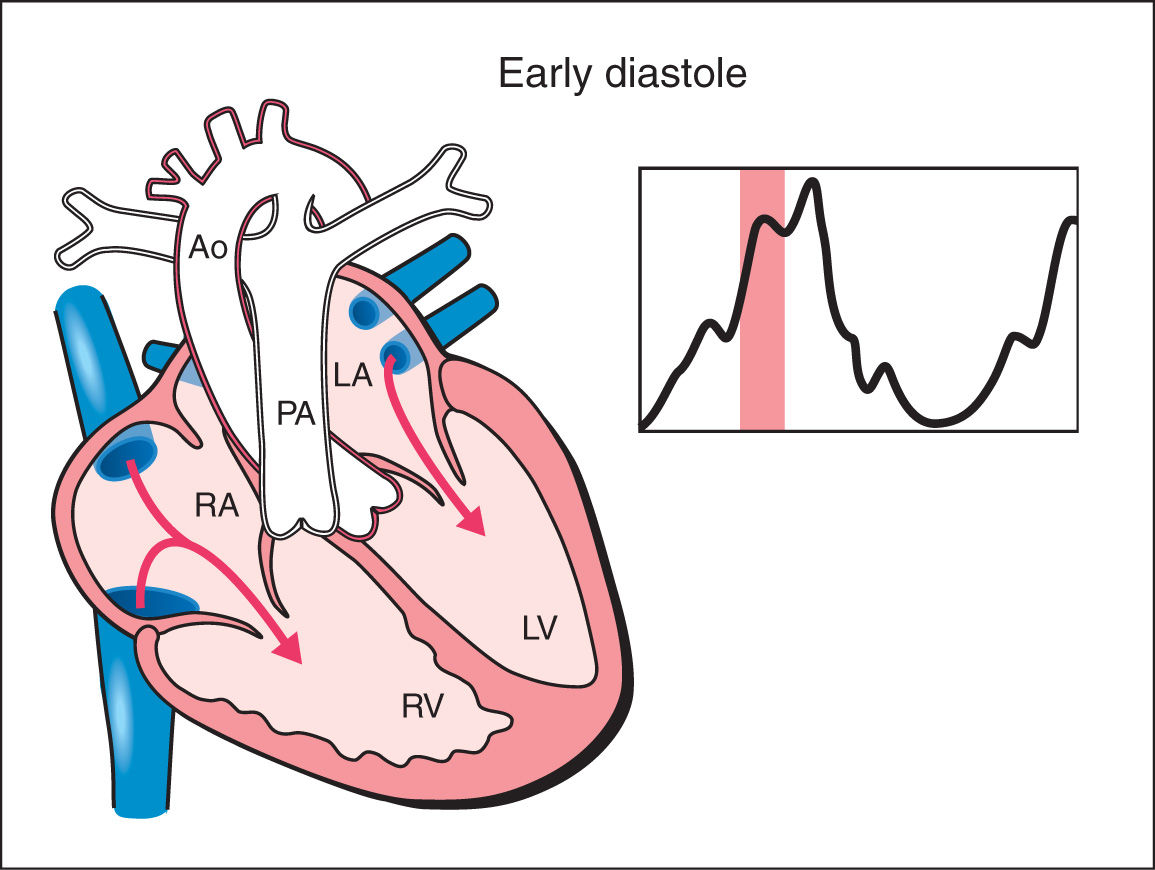
Figure 14.1: Schematic drawing of a fetal heart and corresponding Doppler velocimetric waveform of early diastole phase of the cardiac cycle. Note that the atrioventricular valves are open and the semilunar valves are closed. Ventricular pressure stays constant during early diastole due to progressive ventricular relaxation. Blood fills the ventricles in this phase in a passive manner. RA, right atrium; RV, right ventricle; LA, left atrium; LV, left ventricle; PA, pulmonary artery; Ao, aorta.
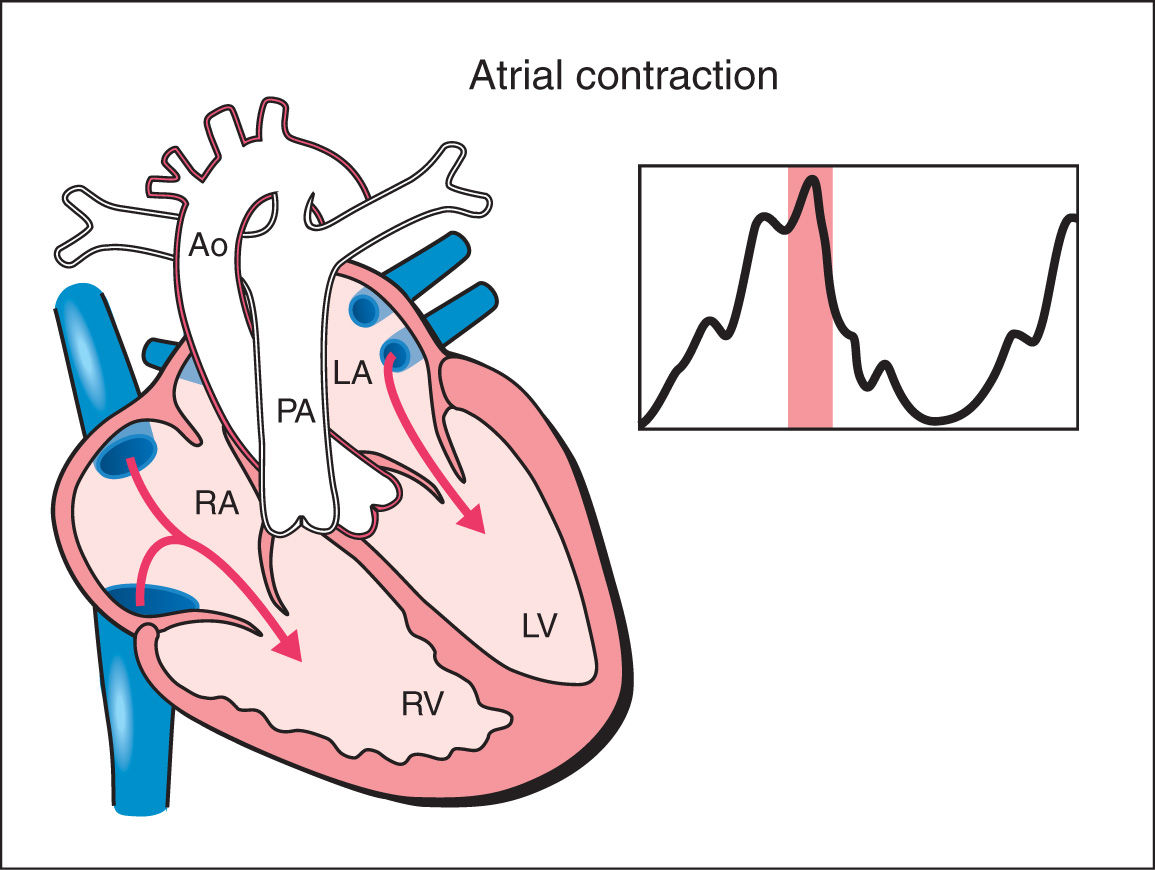
Figure 14.2: Schematic drawing of a fetal heart and corresponding Doppler velocimetric waveform of the atrial contraction phase of the cardiac cycle. In the atrial contraction phase, complete filling of the ventricles occur. Note that the atrioventricular valves are open and the semilunar valves are closed. In this phase, slight increase in ventricular pressure is noted. RA, right atrium; RV, right ventricle; LA, left atrium; LV, left ventricle; PA, pulmonary artery; Ao, aorta.
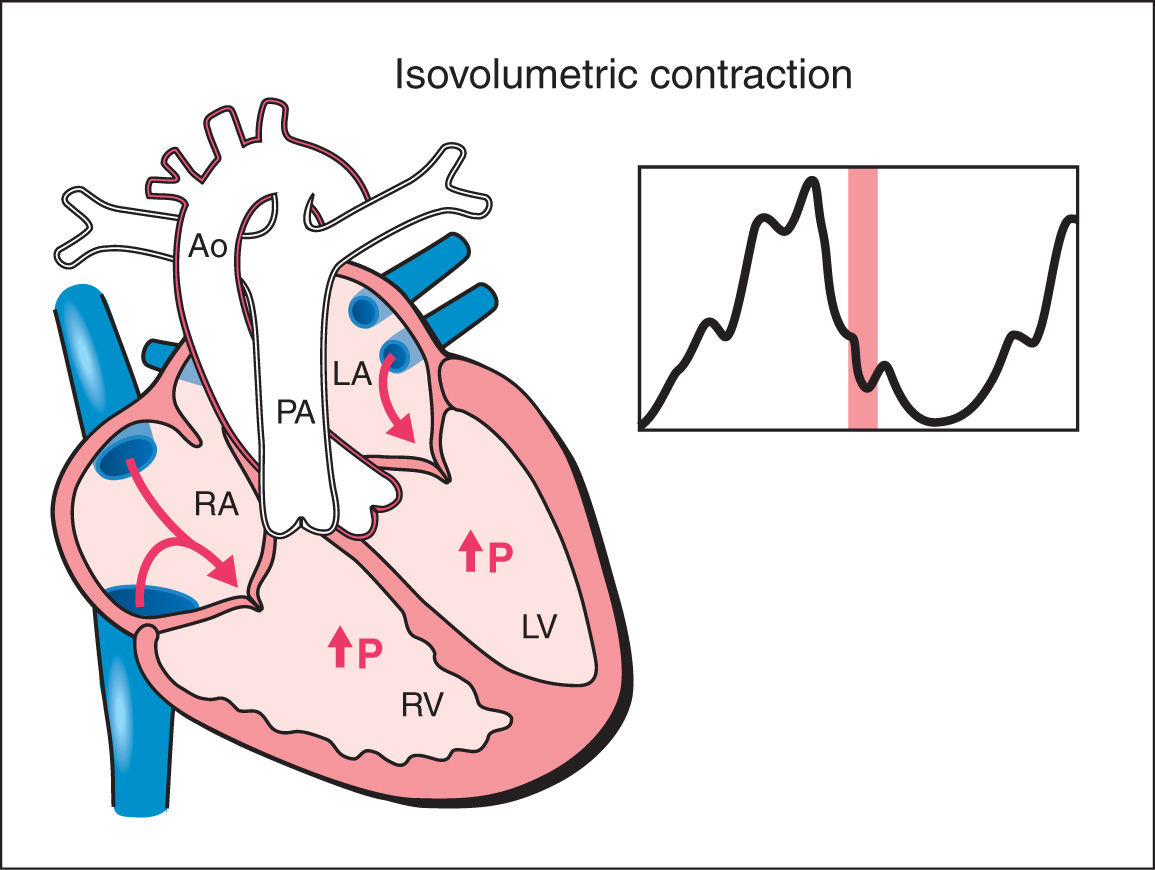
Figure 14.3: Schematic drawing of a fetal heart and corresponding Doppler velocimetric waveform of the isovolumetric contraction phase of the cardiac cycle. This phase represents the beginning of systole. Note that both the atrioventricular and semilunar valves are closed. During this phase, ventricular pressure rises steeply with no change in ventricular volume. RA, right atrium; RV, right ventricle; LA, left atrium; LV, left ventricle; PA, pulmonary artery; Ao, aorta; P, pressure.
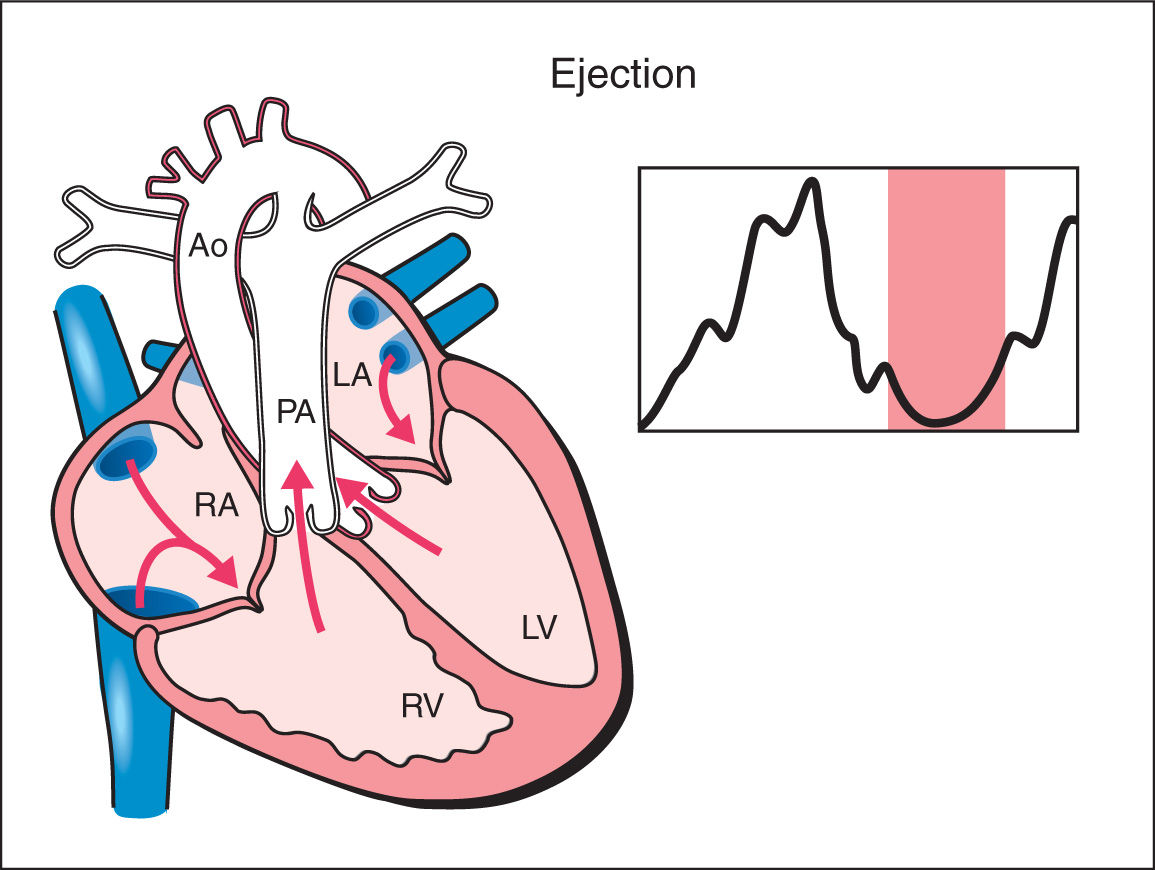
Figure 14.4: Schematic drawing of a fetal heart and corresponding Doppler velocimetric waveform of the ejection phase of the cardiac cycle. Note that the atrioventricular valves are closed and the semilunar valves are open. In this phase, myocardial deformation ensues and a drop in ventricular volume and pressure occurs. RA, right atrium; RV, right ventricle; LA, left atrium; LV, left ventricle; PA, pulmonary artery; Ao, aorta.
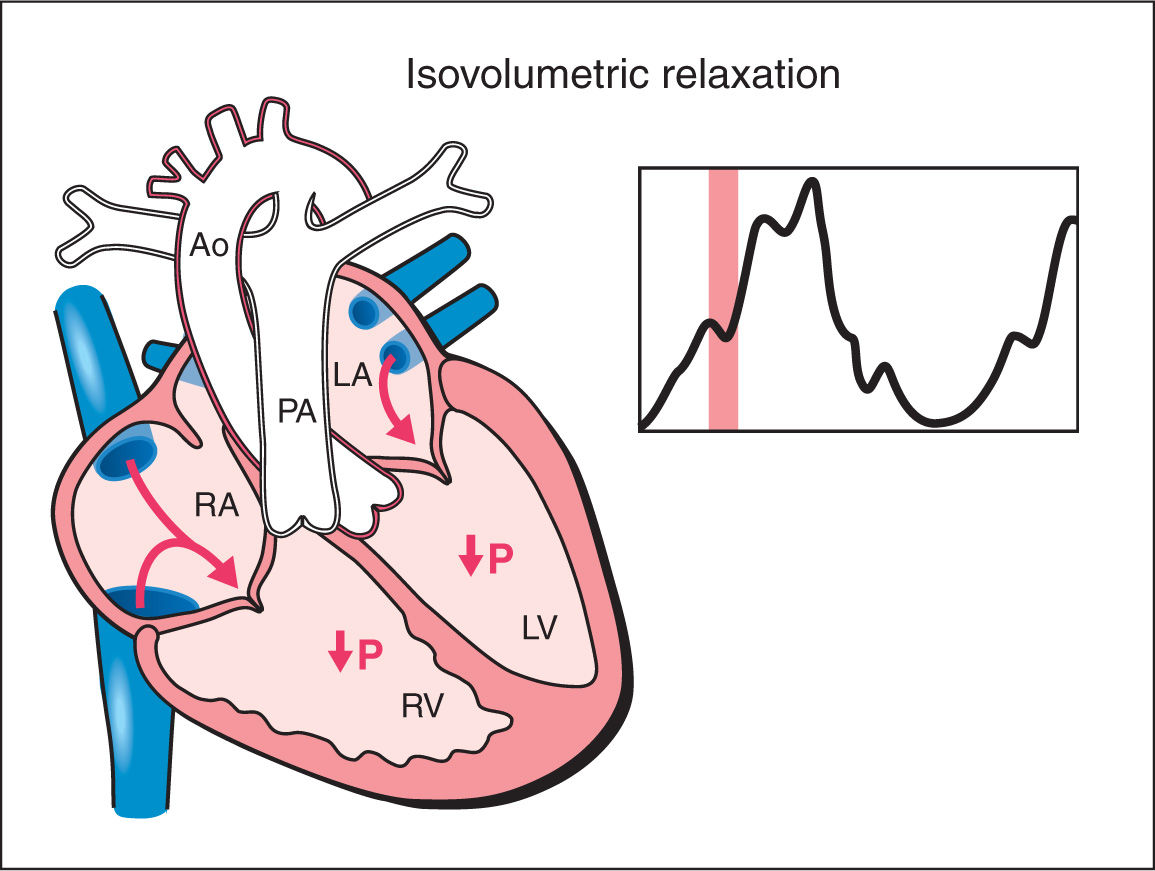
Figure 14.5: Schematic drawing of a fetal heart and corresponding Doppler velocimetric waveform of the isovolumetric relaxation phase of the cardiac cycle. Note that both the atrioventricular and semilunar valves are closed. During this phase, ventricular pressure drops with no change in ventricular volume. RA, right atrium; RV, right ventricle; LA, left atrium; LV, left ventricle; PA, pulmonary artery; Ao, aorta; P, pressure.
● PARAMETERS OF CARDIAC FUNCTION ASSESSMENT
Parameters of cardiac function assessment in the fetus have been largely adapted from pediatric and adult fetal echocardiography. These parameters include quantification of Doppler waveforms across cardiac valves, blood volume estimation, myocardial wall motion and velocity, myocardial wall deformation, and quantification of ventricular volume. Some of these parameters are best suited for the evaluation of systolic cardiac function while others assess diastolic or global cardiac function. Table 14.1 lists the parameters used for systolic, diastolic, and global cardiac function along with their corresponding echocardiographic techniques. It is important to know that some parameters of cardiac function are better adapted for fetal cardiac assessment. This is related to limitations that restrict the widespread applicability of some of these techniques for fetal cardiac assessment. These limitations include the angle of insonation to the fetal heart, the fast cardiac rate, the lack of electrocardiogram (ECG) gating, relatively low frame rates, and decreased resolution in later gestations. Limitations of various techniques are presented in their corresponding sections.
Parameters and Echocardiographic Techniques for Fetal Cardiac Function |
Cardiac function | Parameters of cardiac function | Echocardiographic techniques |
Systolic function | Blood flow estimation: ejection fraction Blood flow estimation: cardiac output Myocardial motion: annular displacement Myocardial motion: annular peak velocity Myocardial deformation: strain Myocardial deformation: strain rate | M-mode, speckle tracking Conventional Doppler, STIC M-mode, speckle tracking Spectral TDI, color TDI Color TDI, speckle tracking Color TDI, speckle tracking |
Diastolic function | Quantification of Doppler: E/A ratio Quantification of Doppler: E/E’ ratio Quantification of Doppler: IRT Myocardial motion: annular peak velocity | Conventional Doppler, spectral TDI Conventional Doppler, spectral TDI Conventional Doppler, spectral TDI Spectral TDI, color TDI |
Global cardiac function | Quantification of Doppler: MPI | Conventional Doppler, spectral TDI |
STIC, spatiotemporal image correlation; TDI, tissue Doppler imaging; IRT, isovolumetric relaxation time; MPI, Myocardial Performance Index.
Adapted from Crispi F, Gratacos E. Fetal cardiac function: technical considerations and potential research and clinical applications. Fetal Diagn Ther. 2012;32:47, with permission.
● TECHNIQUES USED TO ASSESS CARDIAC FUNCTION
Several ultrasound techniques have been applied in the evaluation of fetal cardiac function, including gray scale and color Doppler assessment, conventional spectral Doppler, M-mode, tissue Doppler imaging (TDI), speckle tracking, and four-dimensional (4D) spatiotemporal image correlation (STIC). In this chapter, we present a brief description of these techniques, the technical aspect of image acquisition, and display along with benefits and limitations of each modality of fetal cardiac function. This chapter is not intended to be a comprehensive review on this subject, but rather a redacted presentation of these various techniques. The readers are referred to the cited literature for a more detailed analysis of each modality.
Conventional Spectral Doppler
Parameters of conventional spectral Doppler are frequently obtained in fetal echocardiography and are commonly used in fetal cardiac function assessment. Conventional spectral Doppler primarily includes quantifications of waveforms obtained at the atrioventricular and semilunar valves. Chapter 13 provides a detailed review of the acquisition, display, and quantification of cardiac spectral Doppler. In this section, we focus on the application of conventional spectral Doppler in fetal cardiac function.
Estimation of fetal cardiac function on conventional spectral Doppler primarily relies on three Doppler parameters: the atrioventricular Doppler waveforms, the semilunar Doppler waveforms, and the Myocardial Performance Index (MPI), a derived index that reflects global cardiac function.
Fetal Atrioventricular Valves
The atrioventricular valves Doppler waveforms are quantified by the E/A ratio (Fig. 14.6). The E/A ratio represents fetal diastolic function. The E wave component of the spectral Doppler represents passive ventricular filling in the process of myocardial relaxation (Fig. 14.1). The A wave component of the spectral Doppler represents active ventricular filling associated with the atrial contraction (Fig. 14.2). The E/A ratio is below 1 in the fetus, suggesting that the atrial contraction component of the cardiac cycle contributes the majority of blood in diastole. This is related to a reduced ventricular compliance in the fetus. With advancing gestation, ventricular compliance decreases and the relative contribution of passive filling to diastole increases, which is reflected with increased E velocity and an increased E/A ratio (Fig. 14.7). The right ventricular E/A waveforms in the fetus have higher velocities and the ratio is slightly lower than those on the left (14). Postnatally, the E/A ratio becomes greater than 1. Placement of the sample gate deep within the ventricle will result in loss of the biphasic display of the Doppler waveform. A wide sample gate will also introduce artifacts from the outflow tracts and wall motion. Techniques used for obtaining E/A ratios in the fetus are described in Chapter 13.
The E/A waveforms change in various abnormal fetal conditions. The presence of fetal tachycardia results in fusion of the E and A waveforms (15) (Fig. 14.8). In the presence of fetal growth restriction, there is a reduction in both the E and A components of the waveform with early manifestation noted in the right ventricle (Fig. 14.9) (16). This pattern has been also reported in uncontrolled diabetic pregnancies (17). When the growth restriction is severe, the E/A ratios show a monophasic pattern.
Fetal Semilunar Valves
Flow velocities in the aortic and pulmonary outflow tracts reflect the status of the peripheral vascular resistance in the perfused vascular bed. Conventional spectral Doppler across the aortic valve reflects on the vascular resistance in the upper fetal body, including the brain, and spectral Doppler across the pulmonary valve reflects on the vascular resistance in the lower fetal body and placenta. Flow velocity waveforms of the aortic and pulmonary arteries are monophasic in shape (Fig. 14.10). Several parameters of semilunar valves waveforms can be measured, including peak systolic velocity, acceleration time, velocity–time integral, ET, and pulsatility indices (Fig. 14.10). By combining velocity measurements with outflow tract vessel areas, cardiac output measurements can be obtained of the right ventricle (Fig. 14.11), the left ventricle, and combined. Techniques used for obtaining spectral Doppler waveforms of the aortic and pulmonary valves, respectively, are described in Chapter 13.
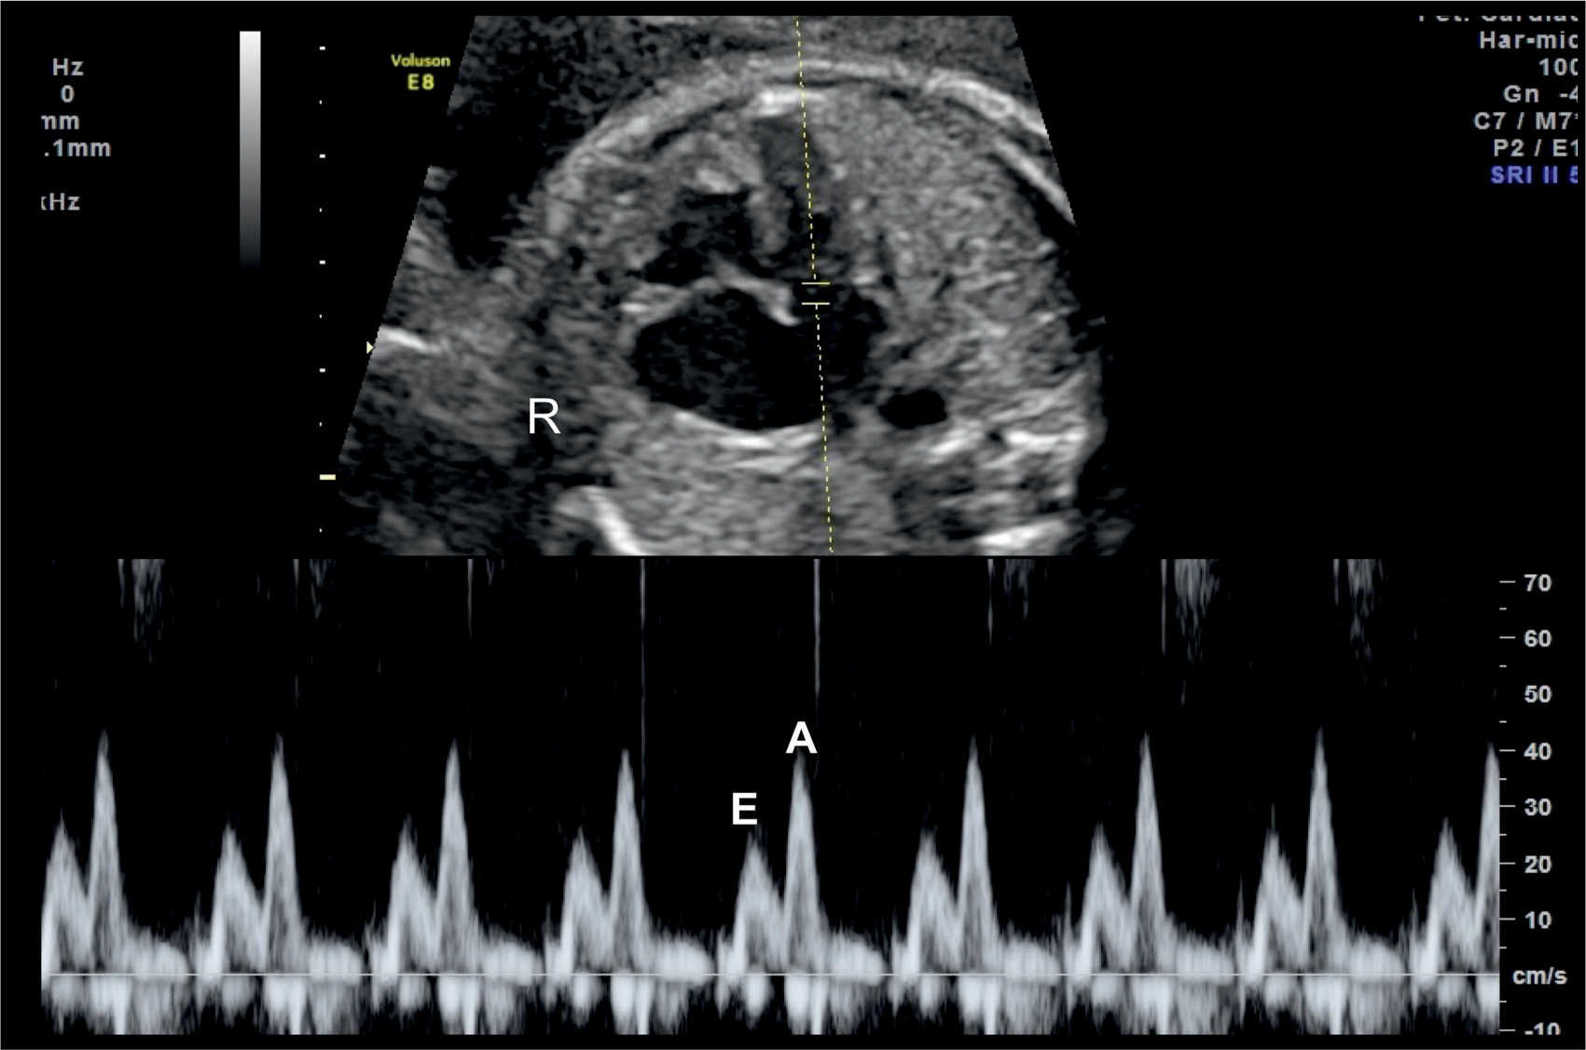
Figure 14.6: Spectral Doppler waveforms across the atrioventricular valves (mitral valve in this figure). Note that the Doppler waveforms are quantified by the E/A ratio, representing fetal diastolic function. The E wave represents passive ventricular filling and the A wave represents active ventricular filling associated with the atrial contraction. R, right.
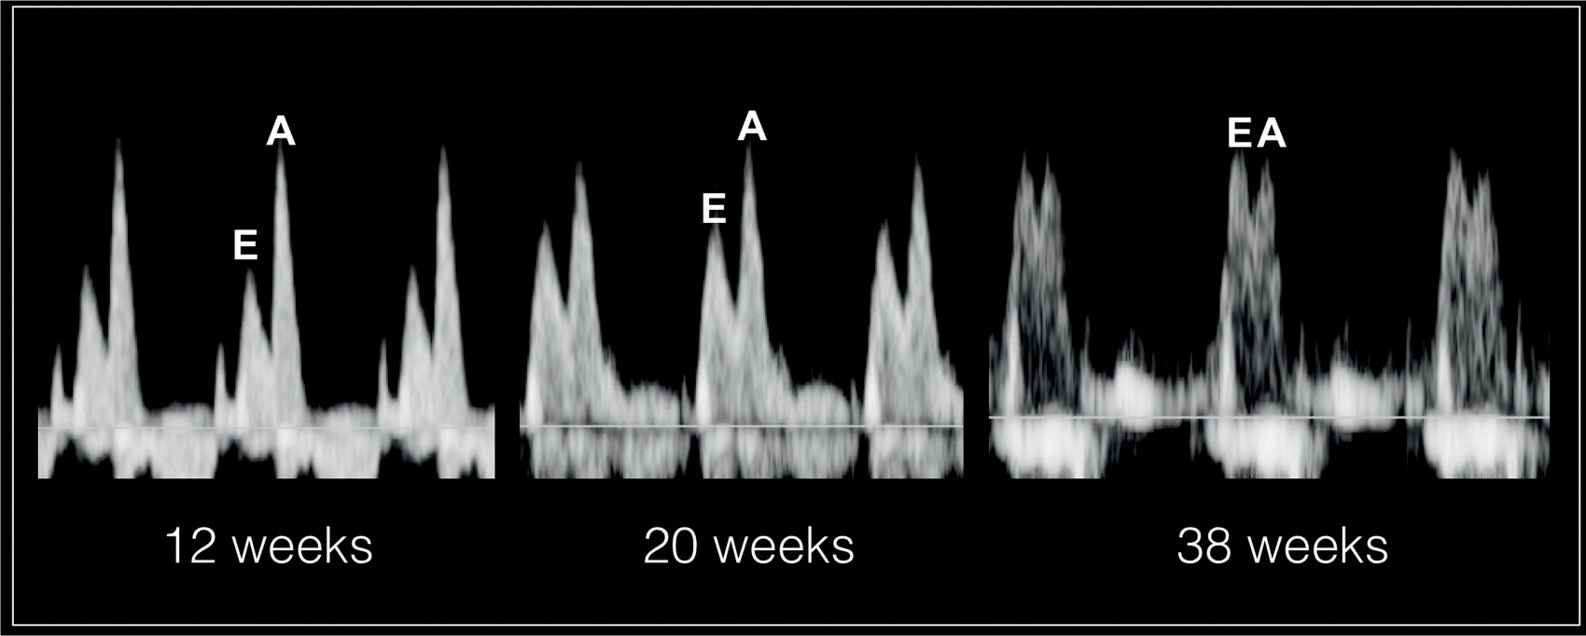
Figure 14.7: Spectral Doppler waveforms across the atrioventricular valves at 12 weeks’, 20 weeks’, and 38 weeks’ gestation. Note that the atrial contraction component of the cardiac cycle contributes to the majority of blood in diastole as reflected by a high A velocity. With advancing gestation, ventricular compliance decreases and the relative contribution of passive filling to diastole increases, which is reflected with increased E velocity and an increased E/A ratio. The E/A ratio approaches 1 at term as shown at 38 weeks.
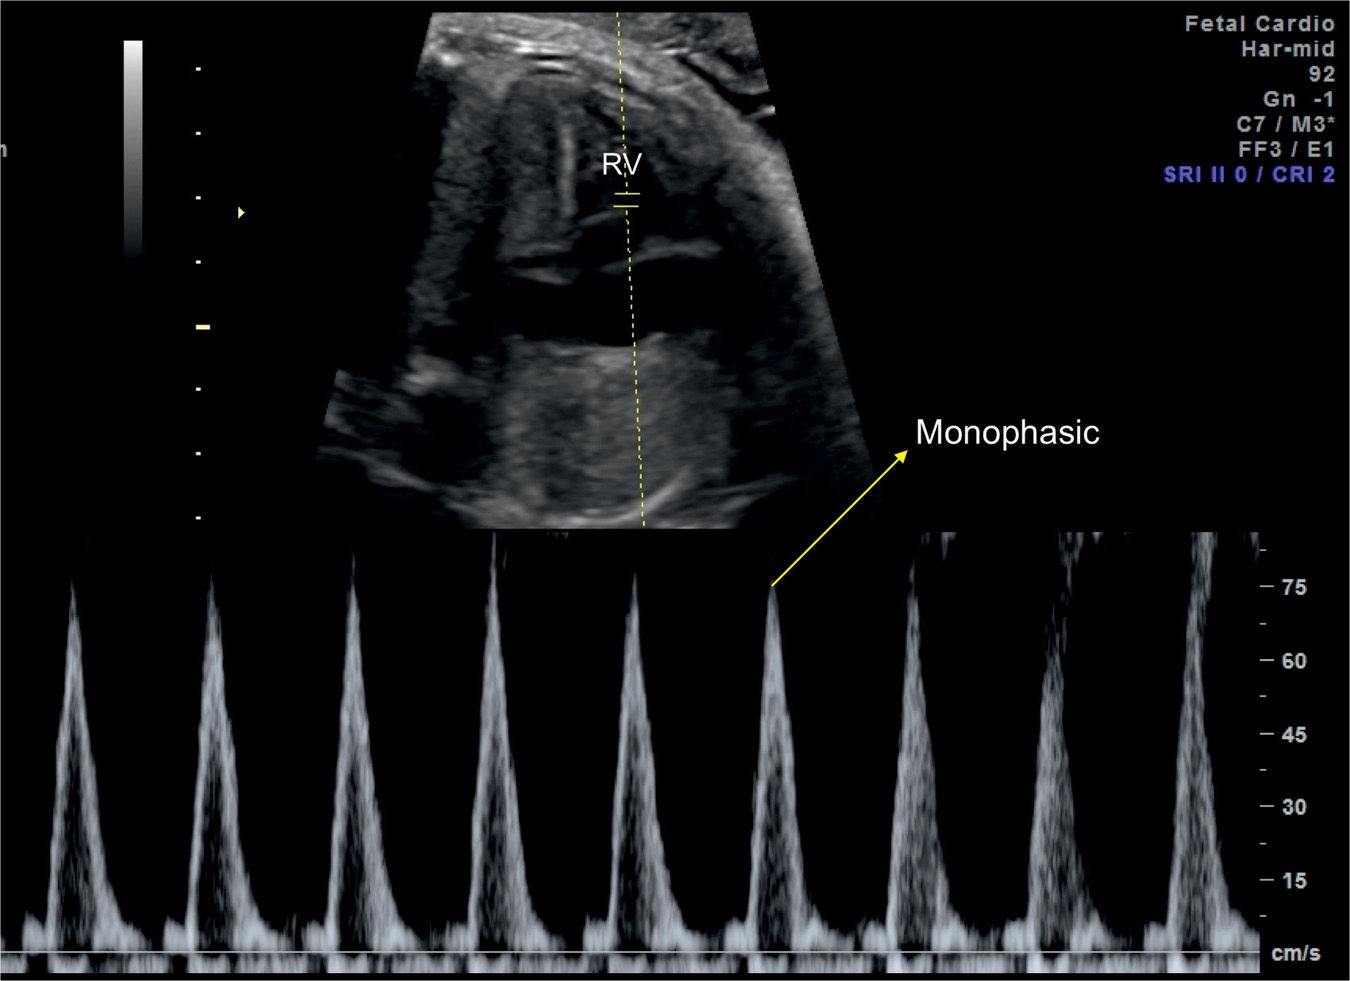
Figure 14.8: Spectral Doppler waveforms across the tricuspid valve in a fetus at 32 weeks’ gestation with a rapid heart rate. Note that the E and A velocities are fused resulting in a monophasic waveform. RV, right ventricle.
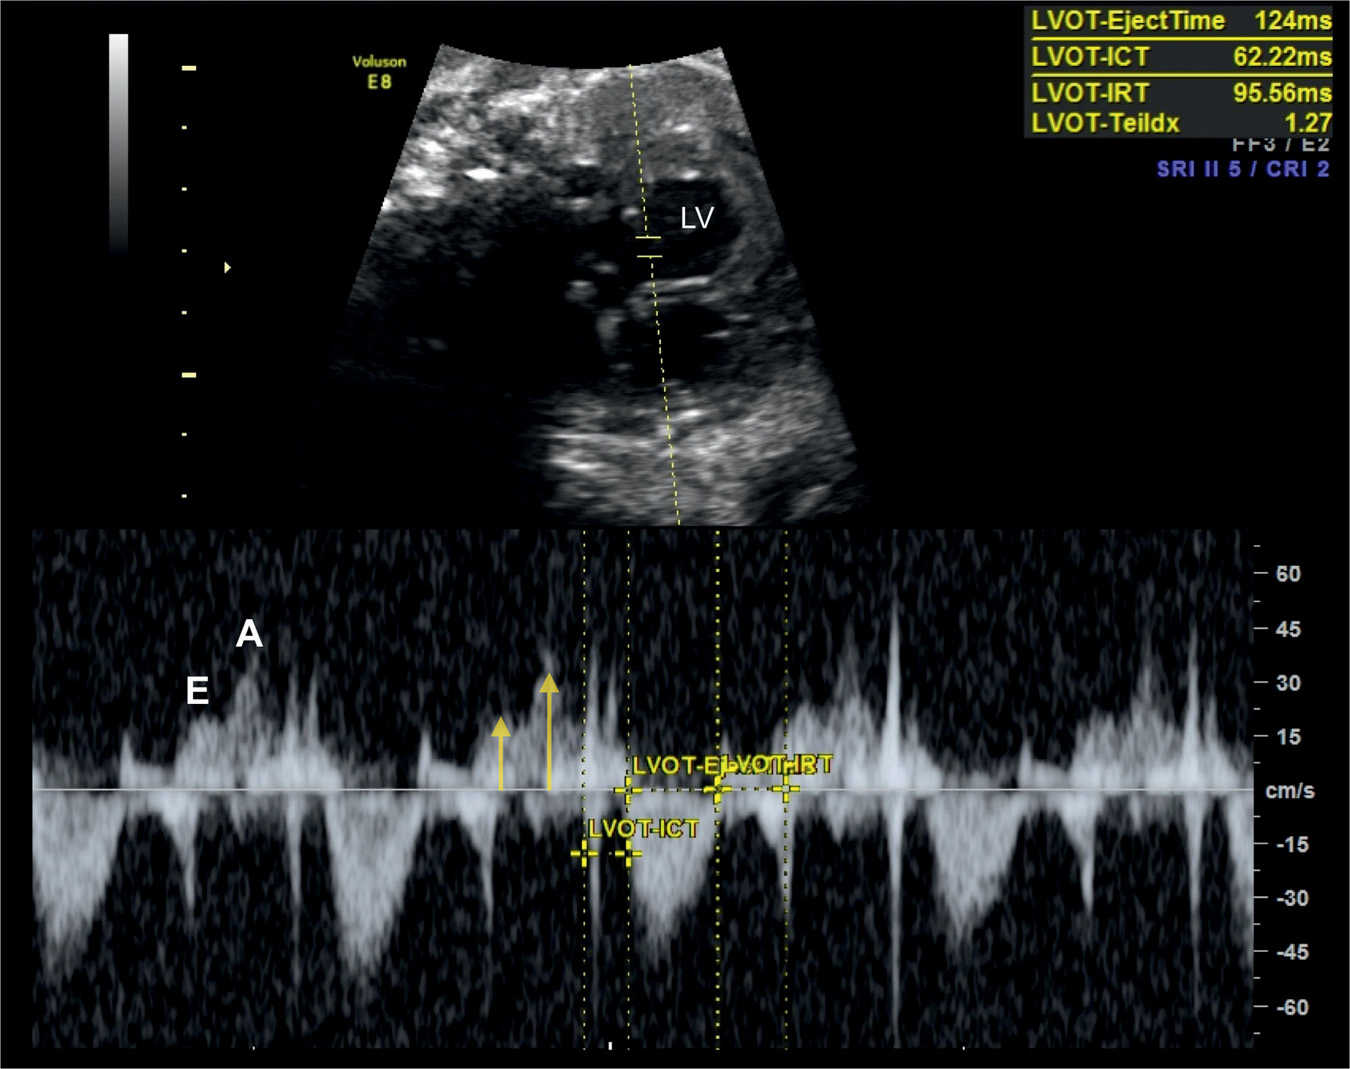
Figure 14.9: Spectral Doppler waveforms across the mitral valve in a fetus at 36 weeks’ gestation with severe growth restriction. Note that the E and A velocities are reduced (labeled and yellow arrows) reflecting decreased cardiac preload. In this fetus, the Tei index (Myocardial Performance Index) is prolonged (1.27), suggesting decreased global cardiac function. LV, left ventricle. ICT, isovolumetric contraction time; IRT, isovolumetric relaxation time.
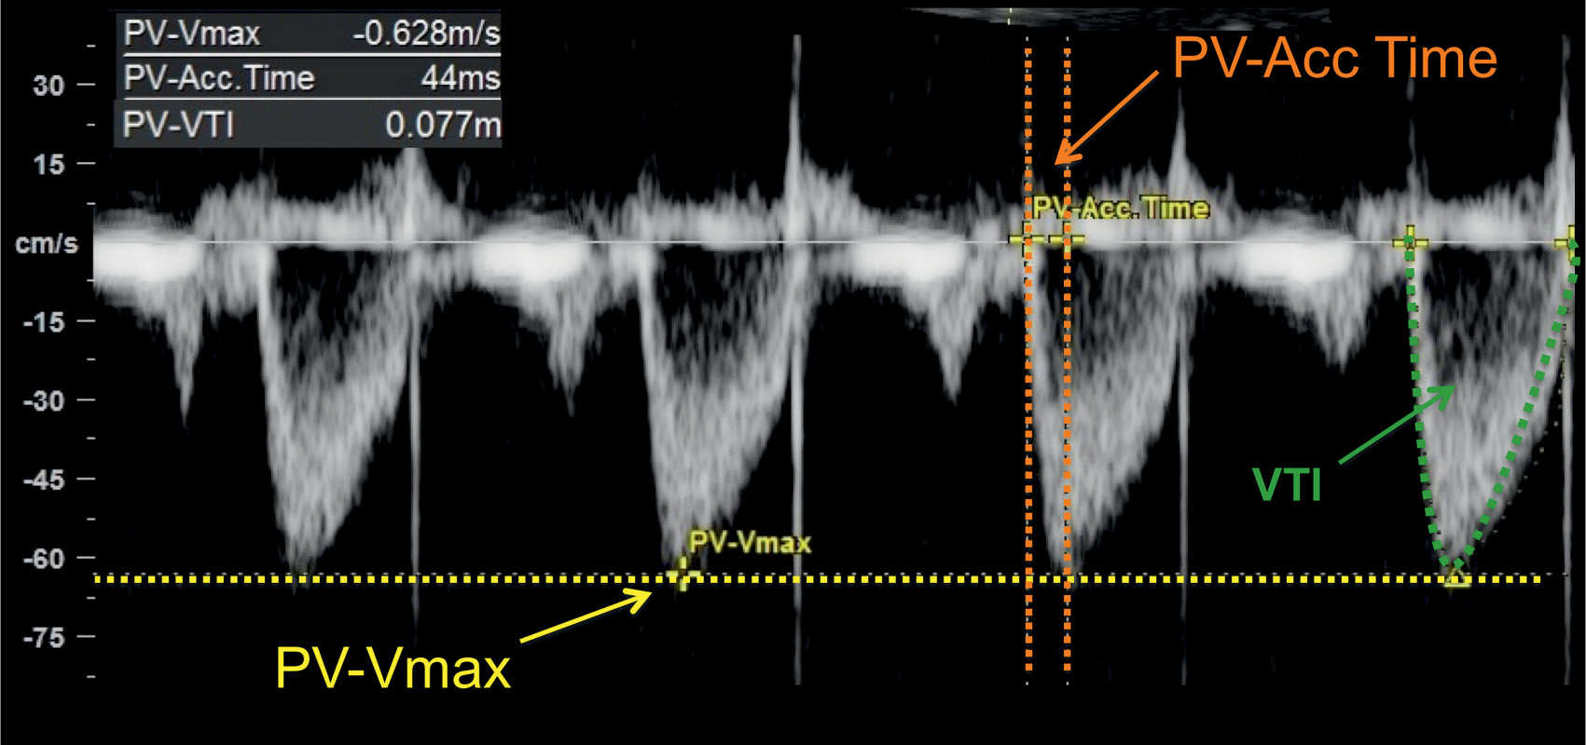
Figure 14.10: Spectral Doppler waveforms across the pulmonary valve in a fetus at 24 weeks’ gestation. Note the monophasic shape of the Doppler waveforms. Measurements of peak systolic velocity (PV-Vmax), acceleration time (PV-Acc Time), and velocity–time integral (VTI) are shown on the Doppler spectrum. PV, pulmonary valve.
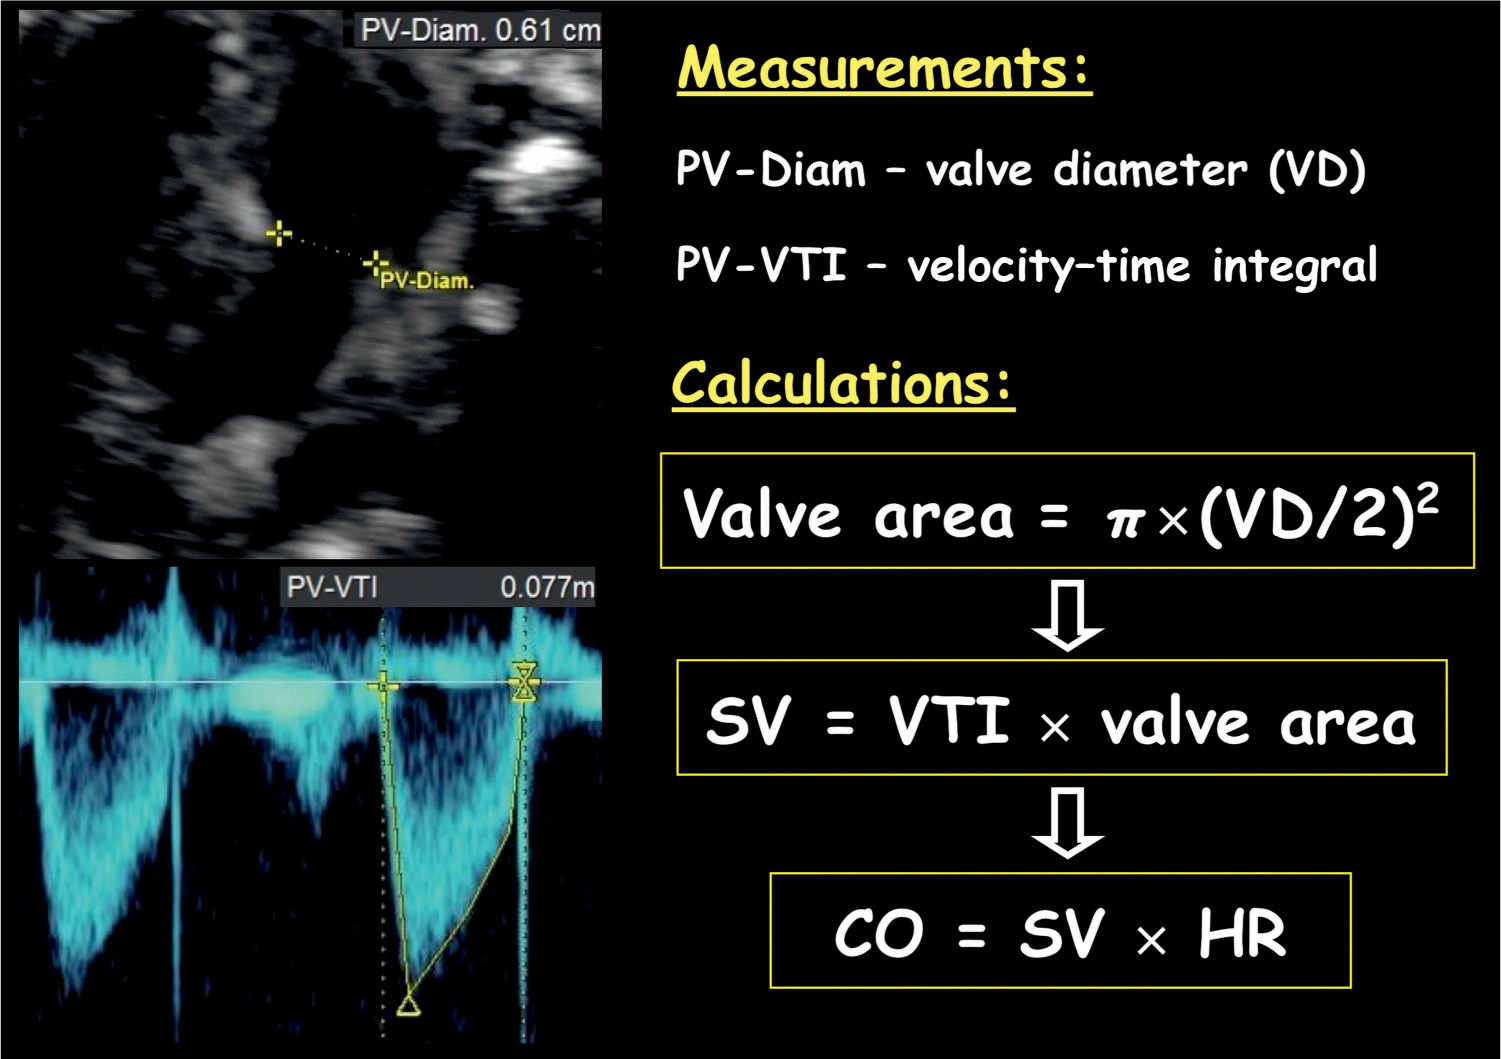
Figure 14.11: Cardiac output measurement of the right ventricle. Note the measurement of the pulmonary valve (PV) diameter (Diam.). Valve area is calculated by the diameter using the equation: π × (PV-Diam/2)2. Stroke volume (SV) is calculated by velocity–time integral (PV-VTI) × valve area, and cardiac output is calculated by SV × heart rate (HR).
Stroke volume of the left or right ventricle is calculated by multiplying the velocity–time integral of the aorta or pulmonary artery by the corresponding vessel area, respectively (Fig. 14.11). The vessel area is calculated as: π × (vessel diameter/2)2. In order to minimize error in measurement, obtain three vessel diameters and use the mean value in vessel area calculation (18). The left cardiac output (LCO) and right cardiac output (RCO) are calculated by the corresponding stroke volume multiplied by the heart rate (Fig. 14.11). The RCO is larger than the LCO and is about 55% to 60% of combined cardiac output (CCO) (19).
There is some controversy on the role of cardiac output estimation in complicated pregnancies (20). In fetal lambs, acute hypoxemia is associated with a reduction in RCO, LCO, and CCO (21). These results have not been duplicated in humans, as studies have shown no change in cardiac output compared to controls (22, 23). Furthermore, abnormalities in cardiac output when present are typically late manifestation of fetal adaptation to hypoxemia.
Myocardial Performance Index
Tei et al. (24) first introduced the Myocardial Performance Index in 1995. MPI is a nongeometrical index of global ventricular function, which incorporates systolic and diastolic time intervals. In the fetal heart, the presence of systolic dysfunction results in prolongation of the IVCT and the presence of diastolic dysfunction results in prolongation of the IVRT. MPI, which is defined as IVCT + IVRT/ET (Fig. 14.12), becomes prolonged in the presence of ventricular dysfunction. MPI cannot differentiate between cardiac systolic or diastolic dysfunction, but this is rarely necessary in the fetus, as the main parameter that is affected in complicated pregnancies is the IVRT (20). Ventricular loading and abnormalities of cardiac contractility and relaxation affect the MPI. The presence of arrhythmias distorts the MPI. MPI values have been shown to vary slightly during gestation with a mean MPI of 0.36 (range 0.28–0.44) (25).
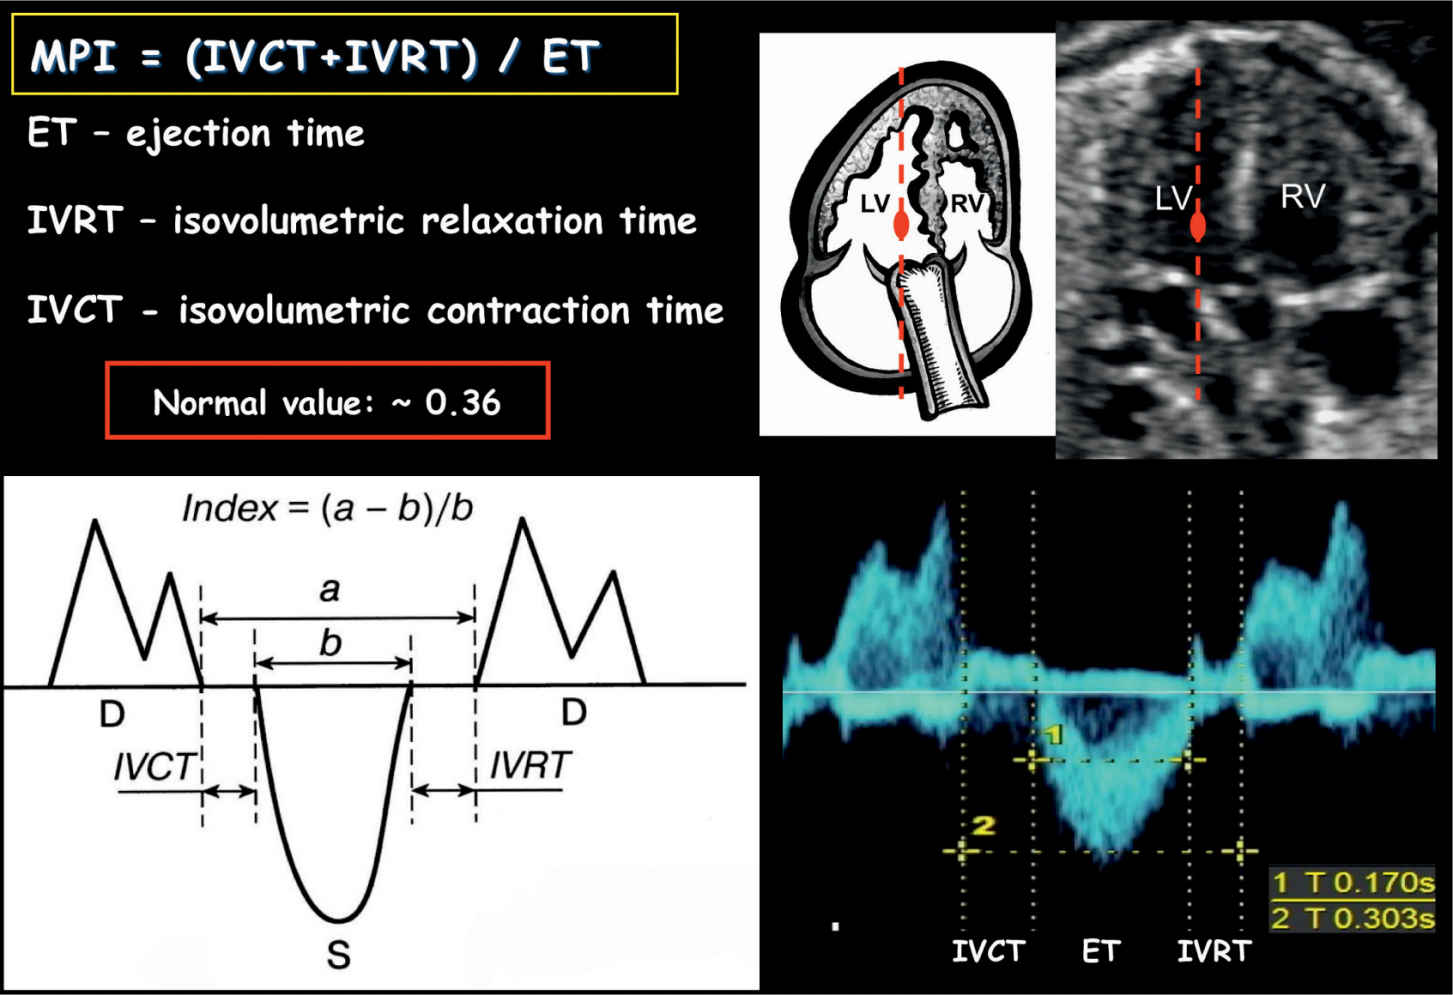
Figure 14.12: Measurement of Myocardial Performance Index (MPI) on spectral Doppler. MPI is defined as isovolumetric contraction time (IVCT) plus isovolumetric relaxation time (IVRT) divided by the ejection time (ET). MPI can also be calculated as shown in the schematic drawing by using (a – b)/b. D, diastole; S, systole; RV, right ventricle; LV, left ventricle.
Stay updated, free articles. Join our Telegram channel

Full access? Get Clinical Tree


