INTRODUCTION
Several technical advances made in recent decades currently allow superb imaging of female pelvic structures. As a result, use of sonography in gynecology now equals that in obstetrics. Enhancements to traditional sonography continue to fill important clinical gaps. For example, three-dimensional (3-D) imaging refinements have expanded the gynecologic indications of sonography to rival those of computed tomography (CT) and magnetic resonance (MR) imaging for many conditions. Similarly, application of MR imaging has been extended by MR-guided high-intensity focused ultrasound therapy, used for uterine leiomyoma treatment.
SONOGRAPHY
In sonography, the picture displayed on a screen is produced by sound waves reflected back from an imaged structure. To begin, alternating current is applied to a transducer containing piezoelectric crystals, which convert electric energy to high-frequency sound waves. A water-soluble gel applied to the skin acts as a coupling agent. Sound waves then pass through tissue layers, encounter an interface between tissues of different densities, and are reflected back to the transducer. Converted back into electric energy, they are displayed on a screen.
Dense material, such as bone, or a synthetic material, such as an intrauterine device (IUD), produces high-velocity reflected waves, also termed echoes, which are displayed on a screen as white. These are described as echogenic. Conversely, fluid is anechoic, generates few reflected waves, and appears black on a screen. Middle-density tissues variably reflect waves to create various shades of gray, and images are described as hypoechoic or hyperechoic relative to tissues immediately adjacent to them. Images are generated so quickly—50 to 100 frames/sec—that the picture on the screen appears to move in real time.
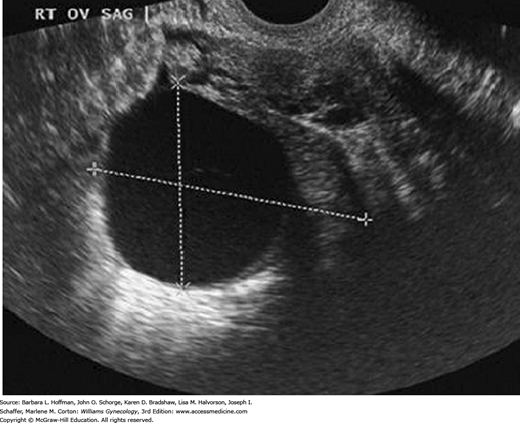
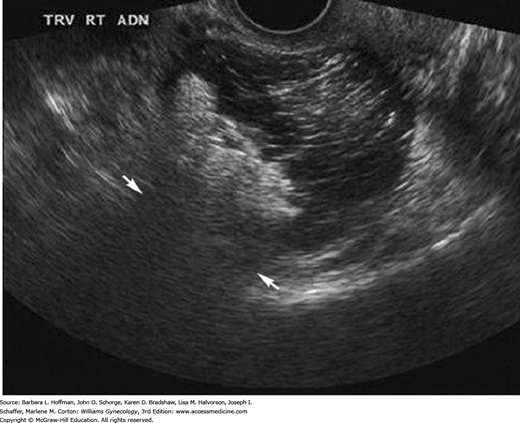
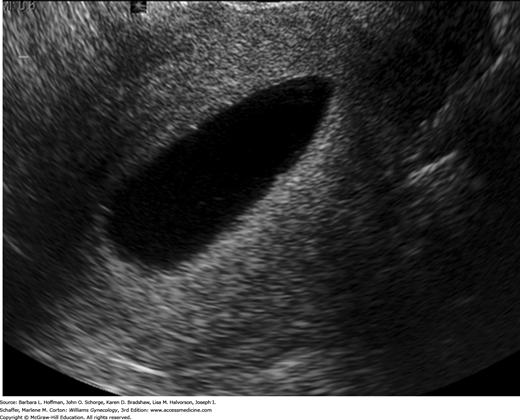
Sound reflection is greatest when the difference between the acoustic impedance of two structures is large. This explains why cysts are so well demonstrated with sonography. Strong echoes are produced from the cyst walls, but no echoes arise from the cyst fluid. As more sound traverses the cyst, more echoes are received from the area behind the cyst, a feature known as through transmission or acoustic enhancement (Fig. 2-1). In contrast, with a dense structure, the sound passing through it is diminished, which creates a band of reduced echoes beyond it, known as acoustic shadowing (Fig. 2-2).
The frequency of emitted ultrasound waves is expressed in megahertz (MHz), which means million vibrations per second. The frequency is inversely related to its wavelength, such that transducers emitting pulses of high frequency generate waves of shorter length, which result in higher spatial resolution or sharpness between interfaces but achieve less penetration. Curved transducers provide a wider field of view but often generate lower frequency waves than linear transducers. Higher frequency probes (10 to 15 MHz) are used to image superficial structures, such as breast masses or lost etonogestrel implants in the upper arm. Lower frequencies are required to image deeper structures. For example, transabdominal transducers are typically in the 3- to 5-MHz range, whereas transvaginal transducers are generally 5 to 10 MHz.
Guidelines for sonographic examination of the female pelvis have been established by The American Institute of Ultrasound in Medicine (2014). These serve as quality assurance standards for patient care and provide assistance to practitioners performing sonography. Guidelines describe equipment and documentation and may be accessed at: http://www.aium.org/resources/guidelines/femalepelvis.pdf.
All probes are cleaned after each examination, and vaginal probes are covered by a protective sheath prior to insertion. A female staff member should always chaperone transvaginal sonography. Guidelines describe the examination steps for each organ and anatomic region in the female pelvis. For instance, for the uterus: uterine size, shape, orientation, and description of the endometrium, myometrium, and cervix are documented. The examination and its interpretation are permanently recorded, appropriately labeled, and placed in the medical record. A copy is also kept by the facility performing the study.
Various examination techniques can be used for sonographic study of the female pelvis. Of these, transabdominal evaluation, using a curved-array 3- to 5-MHz transducer, is the first component of general gynecologic examinations because it provides global identification of all pelvic organs and their spatial relationships (American Institute of Ultrasound in Medicine, 2014). In a nonpregnant patient, a full bladder is preferred for adequate viewing, as it pushes the uterus upward from behind the pubic symphysis and displaces small bowel from the field of view. Moreover, the bladder acts as an acoustic window, to improve ultrasound wave transmission. In patients with large lesions or masses located superior to the bladder dome, transabdominal sonography provides a panoramic view for greater disease evaluation. Still, endometrial cavity assessment is limited with a transabdominal approach and often requires the transvaginal technique.
Transvaginal sonography (TVS) uses higher-frequency (5- to 10-MHz) transducers and is the second component of general gynecologic examinations. Because of its increased sensitivity and spatial image resolution, TVS is ideal for interrogating pelvic anatomy within the confines of the true pelvis. With larger masses, imaging may be incomplete and is complemented by transabdominal sonography.
For TVS, the probe is positioned in the vaginal fornices to place the transducer close to the region of interest and thereby lessen beam attenuation within superficial soft tissues. In contrast to transabdominal imaging, the bladder is emptied prior to a transvaginal study. TVS has few limitations. The only two absolute contraindications are imperforate hymen and patient refusal. A relative contraindication is a patient with a virginal or strictured introitus. These women, however, can usually undergo comfortable examination with proper counseling.
Transrectal and transperineal techniques employ transrectal probes and conventional transducers placed over the perineal region, respectively, for image acquisition. Much less commonly used, they are selected for indications such as pelvic floor imaging.
This recent modification of sonography is designed to improve tissue visualization and quality by using several frequencies at once from the transmitted ultrasound beam instead of just a single frequency. Newer probes and postprocessing features improve image resolution, particularly at surface interfaces. Visual artifacts that arise from superficial structures such as adipose are also reduced. As such, tissue harmonic imaging is routinely used in our ultrasound examinations.
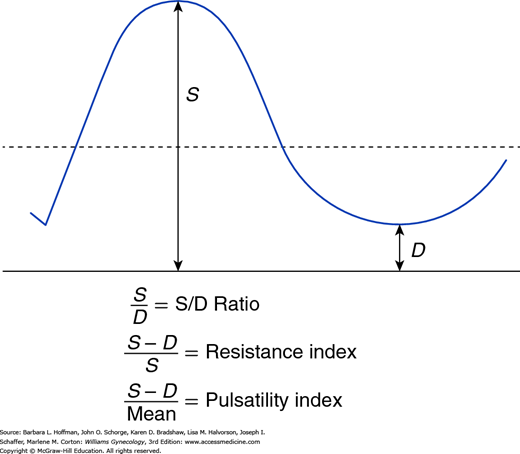
This ultrasound technique can be performed with either transabdominal or transvaginal sonography to determine blood flow through pelvic organs, based on the red blood cell (RBC) velocity within vessels, especially arteries. Color Doppler captures and characterizes the spectral waveform of flow through certain vessels seen during real-time imaging. Ratios are often used to compare these different waveform components. The simplest is the systolic-diastolic ratio (S/D ratio), which compares the maximal (or peak) systolic flow with end-diastolic flow to evaluate downstream impedance to flow (Fig. 2-3). Of arterial Doppler spectral waveform parameters, the resistance index and pulsatility index are also commonly calculated. These quantitative indices estimate the impedance to RBC velocity within the artery by expressing the differences between the peak systolic and end-diastolic velocities.
FIGURE 2-3
Doppler systolic–diastolic waveform indices of blood flow velocity. S represents the peak systolic flow or velocity, and D indicates the end-diastolic flow or velocity. The mean, which is the time-average mean velocity, is calculated from computer-digitized waveforms. (Reproduced with permission from Cunningham FG, Leveno KL, Bloom SL, et al: Williams Obstetrics, 24th ed. New York: McGraw-Hill Education; 2014.)
A second application is color Doppler mapping, in which the color-coded pulsed-Doppler velocity information is superimposed on the real-time gray-scale image. The color is scaled, such that the color brightness is proportional to the flow velocity. Additionally, color Doppler also provides information regarding blood flow direction, and color is assigned to this. Flow approaching the transducer is customarily displayed in red, and flow away from it is shown in blue.
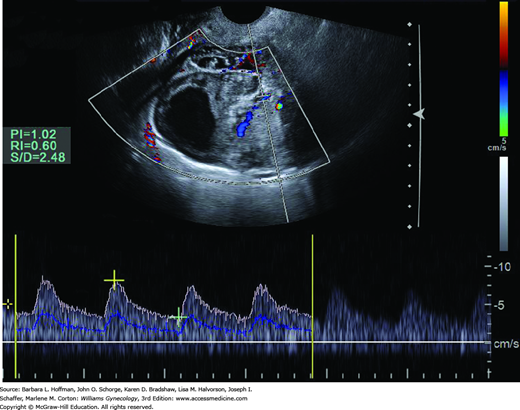
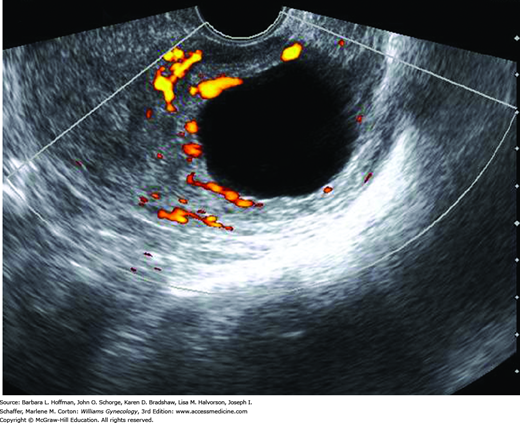
Color Doppler is not applied during every general gynecologic examination. One frequent indication is adnexal mass. Neovascularity within cancer is composed of abnormal vessels that lack smooth muscle and contain multiple arteriovenous shunts. Consequently, lower-impedance flow is expected with such masses as shown in Figure 2-4 (Kurjak, 1992; Weiner, 1992). Other indications include evaluation of ovarian masses for torsion, improved detection of extrauterine vascularity associated with ectopic pregnancy, and assessment of uterine perfusion in patients with leiomyomas and endometrial disorders (Fleischer, 2005). Due to safety concerns regarding the higher intensities generated by color and spectral Doppler, routine use of Doppler imaging in the first trimester is discouraged, unless needed for an important clinical indication.
Power Doppler imaging also maps RBC motion. It detects the energy of Doppler signals generated from moving RBCs using signal-to-noise characteristics of the vessels compared with surrounding tissues. This modality gives no information regarding blood flow direction, and thus data are displayed as a single color, usually yellow or orange. However, power Doppler is more sensitive to low-flow velocities, such as in veins and small arteries. Although employed less often than color Doppler mapping, power Doppler can gather additional information regarding endometrial and ovarian abnormalities (Fig. 2-5).
Also called sonohysterography, saline infusion sonography (SIS) displays detailed endometrial cavity anatomy by distending the cavity with sterile saline. It is commonly selected after an endometrial mass or abnormal endometrial thickness is identified during general TVS. SIS can also assist in some infertility investigations and aid viewing of the endometrial thickness if it is poorly imaged because of uterine position or pathology.
After voiding, a woman first undergoes a comprehensive TVS evaluation. A vaginal speculum is then inserted, the vagina and cervix are swabbed with an antiseptic solution, and a catheter primed with sterile saline is advanced into the cervical canal and just past the internal os. We do not routinely use a tenaculum for this. Contact with the uterine fundus is ideally avoided when advancing the catheter to avert pain or vasovagal response. It can also shear away endometrium, causing false-positive results. The speculum is carefully removed to avoid dislodging the catheter, the transvaginal probe is reinserted, and sterile saline is injected through the catheter at a rate based on the patient’s tolerance. Usually not more than 20 to 40 mL is required to distend the endometrial cavity (Fig. 2-6). During this time, the cavity is observed with TVS. The sonographer scans in the longitudinal plane, imaging from one cornu to the other, and in the transverse plane, from the top of the fundus to the cervix. Endometrial surface irregularities are well delineated by the anechoic contrast of saline. At the procedure’s conclusion, the catheter is withdrawn under sonographic visualization. The uterine isthmus, endocervical canal, and upper vagina and vaginal fornices may also be evaluated, and this technique is referred to as sonovaginography. On average, the entire procedure lasts 5 to 10 minutes.
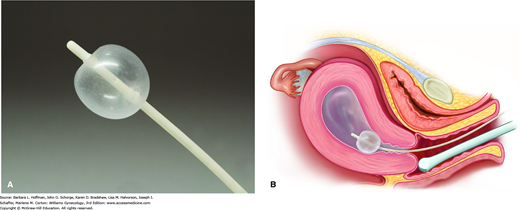
Many different catheter systems are available, including rigid systems and flexible catheters with and without attached balloons. We use a 7F SIS balloon catheter set, which tamponades the internal cervical os. This blockade prevents backflow of the distending medium and provides stable filling and adequate distention. We have found it easy to place and well tolerated (Fig. 2-7). Several distending solutions have been described, including saline, lactated Ringer solution, and 1.5-percent glycine. Sterile saline is inexpensive and provides optimal imaging. Alternatively, gel and foam substances have been developed to avoid backflow problems. However, these alternative products have not been extensively investigated and are not used widely in clinical practice.
In the premenopausal woman, SIS is best performed within the first 10 days of the menstrual cycle, and optimally on cycle days 4, 5, or 6 when the lining is thinnest. This timing is recommended to avoid misinterpreting menstrual blood clots as intrauterine pathology or missing pathology obscured by thick endometrial growth. In addition, such timing usually precludes disturbing a potential pregnancy. For the postmenopausal woman, timing of the procedure is not cycle-dependent.
Complications of SIS are minimal, and the risk of infection is less than 1 percent (Bonnamy, 2002). The American College of Obstetricians and Gynecologists (2014) recommends prophylactic antibiotics for women with prior pelvic inflammatory disease (PID) or identified hydrosalpinges. In these cases, doxycycline 100 mg orally twice daily is prescribed for 5 days. Although not strongly evidence-based, we also routinely give a single dose of doxycycline, 200 mg orally, for infection prophylaxis following SIS to immunocompromised women, such as those with diabetes, cancer, or human immunodeficiency virus infection. Prophylaxis is also given to infertile patients because of the risk for significant tubal damage associated with pelvic infection. Pain is usually minimal. In our experience, women with prior tubal ligation have greater discomfort, likely because fluid is unable to efflux through the fallopian tubes. A nonsteroidal antiinflammatory drug (NSAID) given 30 minutes prior to the procedure will typically minimize discomfort.
Contraindications to SIS include hematometra, pregnancy, active pelvic infection, or obstruction such as with an atrophic or stenotic cervix or vagina. In postmenopausal women with cervical stenosis, we have found the following techniques to be helpful: misoprostol 200 μg tablet orally the evening before and the morning of the procedure; a paracervical block with 1-percent lidocaine without epinephrine; a tenaculum on the cervix for traction; and a sonographically guided sequential cervical dilation with lacrimal duct dilators. Pisal and colleagues (2005) proposed using a 20-gauge spinal needle, inserted into the uterine cavity under sonographic guidance, to overcome severe cervical stenosis.
In the past, a fallopian tube could be detected with sonography only when distended by fluid, such as with obstruction. Injection of echogenic contrast during real-time sonography, called sonosalpingography, sonohysterosalpingography, or hysterosalpingo-contrast sonography (HyCoSy), is now an accurate procedure for the tubal patency assessment (Hamed, 2009).
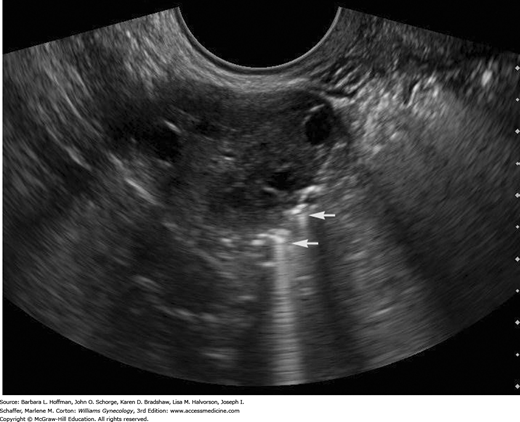
HyCoSy is done in a manner similar to SIS. Fluid egress from the uterine cavity is blocked by a balloon catheter within the cervical canal. Using transvaginal sonography, the fallopian tubes are identified at the point where they join the uterine cornua. A hyperechoic sonographic contrast medium (Echovist, Albunex, or Infoson) is injected through the catheter to fill the cavity and then the fallopian tubes (Fig. 2-8). Alternatively, air coupled with sterile saline solution is another contrast option. With either medium choice, patent tubes appear hyperechoic as they fill with contrast. Color or pulsed Doppler techniques increase the diagnostic accuracy of HyCoSy by showing flow velocity within the tubes (Kupesic, 2007). We use the FemVue Sono Tubal Evaluation System, which simultaneously introduces air and sterile saline in a controlled fashion. The positive pressure flow of the echogenic mixture creates “scintillations” that are visually followed using real-time ultrasound. In patent tubes, flow proceeds from the uterotubal junction, through the length of the tube, and out the fimbriated end. Bubbles then surround the ovary or fill the posterior cul-de-sac. At present no large studies quantitate a risk for post-HyCoSy pelvic infection, and our periprocedural antibiotic prophylaxis mirrors our SIS protocol.
FIGURE 2-8
Transvaginal image of an ovary with echogenic bubbles adjacent to it (arrows) as seen during hysterosalpingo-contrast sonography (HyCoSy). The air in the saline contrast produces the bright echoes and ring-down artifacts. Visualization of these echoes adjacent to the ovary represents contrast exiting the tube, consistent with tubal patency.
HyCoSy performed in conjunction with SIS provides a comprehensive assessment of the uterine cavity and myometrial anatomy, tubal patency, and adnexal architecture. This allows a cost-effective and time-efficient “one-stop” evaluation (Saunders, 2011). However, HyCoSy does have limitations. We have found that the entire fallopian tube often cannot be visualized due to normal tubal tortuosity. To that end, recent studies have evaluated the combination of 3-D sonography with HyCoSy to more easily view the entire tubal length (Exacoustos, 2013; Zhou, 2012). Similar to hysterosalpingography (HSG), discussed on page 38, HyCoSy can demonstrate false occlusion from tubal spasm. In addition, a patent tube does not always correlate with normal tubal function. Last, HSG may still be needed for more accurate delineation of tubal anatomy in selected cases (Mol, 1996).
Although comparable to HSG in detecting tubal pathology, it has only recently become routinely used clinically (Heikinen, 1995; Strandell, 1999). In comparison to HSG, HyCoSy can also be performed in an outpatient setting, has lower cost, is well tolerated, avoids x-ray exposure or iodine-related allergic reaction, and provides information on uterine wall and ovarian morphology (Luciano, 2014; Savelli, 2009). The advantages of HyCoSy compared with HSG are equally valid for patient evaluation following sterilization with hysteroscopic devices. Namely, with Essure microinsert coils, tubal blockage confirmation 3 months after sterilization is mandatory (Luciano, 2011). Still, the Food and Drug Administration (FDA) and manufacturer currently recommend HSG to demonstrate tubal occlusion by Essure.
The ability to obtain certain views of pelvic organs in two dimensions is inherently limited. Transabdominally, the bony pelvis prevents scanning from the pelvic sidewall. Transvaginally, the views obtainable are restricted by the range of vaginal probe mobility. New sonography scanners now allow collection of 3-D data and representation of it on a two-dimensional (2-D) screen. This permits a more detailed assessment of the object studied, without restriction of the number and orientation of the scanning planes. With 3-D imaging, any desired plane through a pelvic organ can be obtained, regardless of the sound beam orientation during acquisition. For example, the “face-on” or coronal plane through the uterus is routinely seen in 3-D imaging but is rarely viewed during 2-D scanning. This view of the uterus is essential for assessing the external contour of the uterine fundus and the shape of the endometrial cavity for congenital uterine anomaly diagnosis.
With 3-D sonography, a volume, rather than a slice, of sonographic data is acquired and stored. The stored data can be reformatted and analyzed in numerous ways, and navigation through the saved volume can show countless planes. At any time, the volume can be retrieved, studied, reconstructed, and reinterpreted as needed. In addition, the level of energy with 3-D sonography is no higher than with 2-D, and manipulations of the obtained volumes are performed “off-line” to avoid additional ultrasound scanning time.
The three main components of 3-D sonography are volume acquisition, processing, and display. First, the preferred method to acquire volumes is automated and uses a dedicated 3-D probe that contains a mechanized drive. When these probes are activated, the transducer elements automatically sweep through the operator-selected region of interest, called a volume box, while the probe is held stationary.
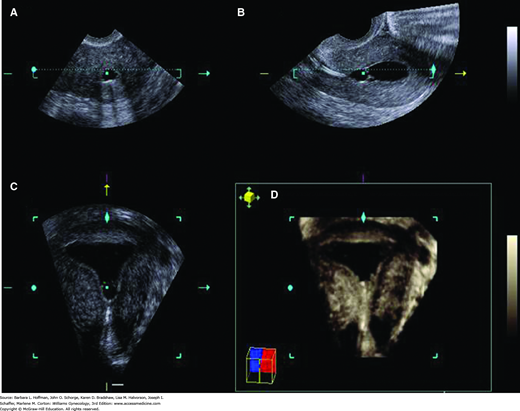
After the appropriate volume is acquired, the user can begin to process the volume using the modes available in the ultrasound machine. The acquired volume can be displayed multiple ways. The most common is multiplanar reconstruction, in which three perpendicular planes, sagittal (the longitudinal plane that divides the body into right and left sections), axial (the transverse plane that divides the body into cephalad and caudal sections), and coronal (the frontal plane that divides the body into ventral and dorsal sections), are displayed simultaneously. Correlation between the three planes in the multiplanar display is accomplished by placing the planar center dot at the point of interest in one plane and observing the location of the corresponding center dots in the other two planes (Fig. 2-9A-C).
FIGURE 2-9
Multiplanar display of a 3-dimensional volume of a uterus and normal endometrial cavity during saline infusion sonography. The views were obtained from a midsagittal reference plane using the Z technique. The planes are as follows: A. transverse, B. sagittal, C. coronal, D. rendered image.
Abuhamad and associates (2006) have described a straightforward postprocessing technique, called the Z technique, that aids in the manipulation of 3-D volumes of the uterus. The anatomic basis of the Z technique is such that, in aligning the midsagittal and midtransverse planes of the uterus parallel to the horizontal axis, the midcoronal plane of the uterus will easily and consistently be displayed. In addition, all or part of the saved volume can be processed into a rendered image that can be shown alone or in correlation with the multiplanar display. A rendered image is a “sum” of all the coronal planar images (Fig. 2-9D). This is the display method that has been publicized in obstetrics, when showing the image of the neonate’s face in utero.
The inverse mode is a rendering technique of the entire volume in which all cystic areas within the volume become digitally opaque and all solid areas become transparent. This technique is useful when trying to see cystic areas that might be hidden in a volume, such as within an ovarian mass. Last, the volume can be displayed in parallel tomographic slices, similar to the displays used by CT and MR imaging.
3-D imaging is not without shortcomings. With 3-D sonography, the same type of acoustic artifacts that occur with 2-D imaging are encountered, such as acoustic shadowing and enhancement, refraction and reverberation, and motion artifacts from bowel peristalsis and vascular pulsation. Another potential pitfall in 3-D imaging of the pelvis involves spatial orientation within the saved volume data. Uterine flexion or version or left versus right may not be readily apparent on review of saved volumes. As such, during the preliminary real-time scanning, the operator must determine the orientation of the area of interest and notate it accordingly.
Another problem commonly encountered in 3-D transvaginal gynecologic imaging is related to the limited size of the volume box. Because of this, the entire uterus is often not acquired in a single volume. In some cases, it may be necessary to acquire two volumes, one for the cervix and a second for the uterine body. Likewise, a very large adnexal mass may not be imaged completely in any single volume of data obtained transvaginally. The size of the volume box provided by the abdominal probe is greater. Thus with 3-D sonography, a large mass may need to be imaged transabdominally instead of transvaginally.
Because it can study organs in numerous scanning planes, 3-D imaging has become invaluable in gynecology to assess the uterine cavity, complex ovarian masses, ovarian fertility reserve, uterine anomalies, and interstitial pregnancies. It also can simultaneously provide anatomic and dynamic information from pelvic floor structures and from mesh implants.
Of these, mapping leiomyoma location relative to the endometrial cavity and surrounding structures is an essential step in triaging patients for treatment as discussed in Chapter 9. For such mapping, 3-D sonography or 3-D SIS can be used in place of conventional SIS or MR imaging. In patients receiving gonadotropin-releasing hormone (GnRH) agonists or following uterine artery embolization (UAE), 3-D sonography can also monitor leiomyoma volume reductions. However, MR imaging is more often used following UAE.
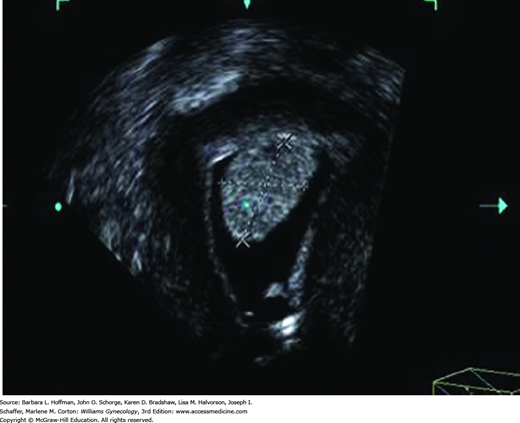
Abnormalities of the endometrium and adjacent myometrium, especially focal endometrial thickenings such as polyps, hyperplasia, and cancer, can be better defined with 3-D technology (Fig. 2-10) (Andreotti, 2006; Benacerraf, 2008). In their comparative study of 36 women with postmenopausal bleeding, Bonilla-Musoles and associates (1997) compared results from 3-D SIS with findings from TVS, 2-D SIS, transvaginal color Doppler, and hysteroscopy. Visualization of the uterine cavity and endometrial thickness with 3-D SIS was comparable to hysteroscopy and better than the other sonographic techniques. We now routinely implement 3-D imaging for evaluation of abnormal endometria during our transvaginal studies and with all SIS procedures.
Although investigational, 3-D sonography with power Doppler angiography (3D-PDA) has been used to discriminate between benign and malignant endometrial disease in women with postmenopausal bleeding and a thickened endometrium (Alcazar, 2009). 3D-PDA can assess endometrial volume, which may more accurately represent the true tissue amount compared with a 2-D measurement of endometrial thickness. Another tool, 3-D power Doppler imaging enhanced by intravenous (IV) contrast, is also being investigated to differentiate benign endometrial polyps and endometrial cancer (Lieng, 2008; Song, 2009).
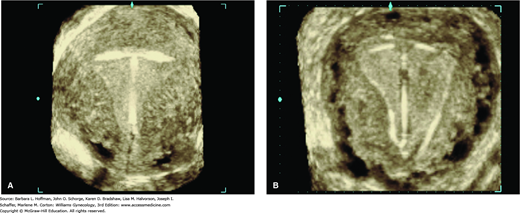
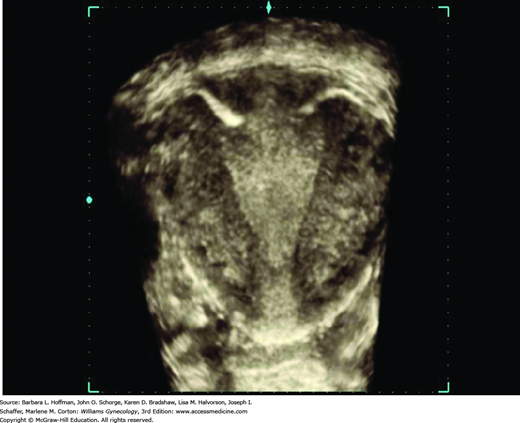
IUD positioning within the endometrial cavity can be documented adequately in most cases with traditional 2-D TVS. That said, 3-D sonography offers improved visualization, especially with the levonorgestrel-releasing IUD (Moschos, 2011). The coronal plane images, which are not possible with 2-D imaging, provide views of both the arms and shaft of the device and the relation of these to the endometrial cavity (Benacerraf, 2009). As such, patients at our institution undergoing gynecologic sonography with an IUD in situ, regardless of the study indication, have both a standard 2-D evaluation and a 3-D volume acquisition of the uterus. The coronal view of the endometrial cavity is reconstructed to establish IUD type, location, and positioning (Fig. 2-11). In addition, although the FDA still mandates a postprocedural HSG following Essure coil placement, TVS has been shown to be an acceptable method of confirmation (Fig. 2-12) (Legendre, 2010).
For adnexal mass interrogation, most agree that 3-D sonography provides detailed internal anatomy (Alcazar, 2003; Bonilla-Musoles, 1995). Moreover, the addition of power Doppler to 3-D evaluation displays the internal architecture and neovascularization also characteristic of malignant neoplasms. However, to date, 3-D power Doppler ultrasound has not shown significantly improved diagnostic accuracy compared with that of gray-scale and 2-D power Doppler imaging. Further large, randomized, controlled trials are warranted (Jokubkiene, 2007).
In reproductive medicine, 3-D imaging acquires more precise ovarian volumes and follicle counts than measurements estimated from 2-D imaging. Many predict that it will become the preferred ultrasound technique for infertility ovarian evaluation (Deutch, 2009). Moreover, 3-D sonography can also examine endometrial vascularity to predict endometrial receptivity prior to ovarian stimulation (Wu, 2003).
For congenital müllerian uterine anomalies, 3-D ultrasound is now frequently used to accurately display anatomy (Ghi, 2009; Salim, 2003). It is as sensitive as hysteroscopy and as accurate as MR imaging, and it provides detailed images of both endometrial cavity shape and external fundal contour (Bermejo, 2010). Thus, because the uterine horns and fundal contour are displayed clearly in the same plane, müllerian anomalies can be differentiated (Troiano, 2004). Importantly, 3-D imaging can provide helpful details for preoperative planning.
For pelvic reconstructive surgery indications, 3-D ultrasound has been used to evaluate pelvic floor anatomy, pelvic support, and mesh implants. First, because of its composition, typical polypropylene mesh implants appear as echogenic interwoven interfaces with ultrasound. In contrast, these are poorly depicted with radiography or MR imaging. As a result, 3-D vaginal and perineal sonography is now selected for this evaluation (Dietz, 2012; Fleischer, 2012; Schuettoff, 2006). During implant interrogation, cranial aspects of mesh or retropubic mesh may be poorly imaged. For these patients, MR imaging may be helpful.
As a second indication, postprocessing reconstruction in a coronal plane improves views of the urethra and the periurethral tissue, which are inaccessible with 2-D ultrasound techniques. 3-D images are obtained with abdominal transducers using a translabial-transperineal approach or with transvaginal probes using specialized rotational transducers (Dietz, 2007, 2012; Santoro, 2011).
In women with pelvic floor dysfunction, the reconstructed tomographic ultrasound images afforded by 3-D ultrasound are particularly useful to quantify the degree of levator ani defects (Dietz, 2010). Perhaps most importantly, 3-D imaging can provide not only anatomic but also dynamic information about pelvic floor structures, as imaging can be executed with the patient performing the Valsalva maneuver or actively contracting the pelvic floor musculature (Fleischer, 2012).
This newer technique couples IV contrast with traditional sonography. With contrast-enhanced sonography, the visible difference between the density (or signal intensity) of a focal lesion is compared with the surrounding normal organ tissue. Enhancement patterns within the mass itself are also assessed.
Ultrasound contrast agents used intravenously are small, stabilized microbubbles, usually 1 to 10 μm in diameter, and composed of perfluorocarbon or nitrogen gas encapsulated in albumin, phospholipid, or polymer shells. The gas-liquid interface contributes to the echogenicity of the microbubbles seen using traditional imaging. The high impedance mismatch between the microbubbles and adjacent RBCs in the blood vessels causes increased scattering and reflection of the ultrasound sound beam. This heightens the ultrasound signal and thereby increases brightness or echogenicity (Hwang, 2010). The degree of echo enhancement depends on many factors, including microbubble size, contrast agent density, compressibility of the bubbles, and the interrogating ultrasound frequency. The greater the size, density, and compressibility of the agent, the more reflection and echogenicity is elicited (Eckersley, 2002).
For ovarian cancer, contrast-enhanced sonography may highlight tumor neovascularization in developing microscopic tumors (Ferrara, 2000). In addition, because vascular channels associated with malignancy are often incompetent, the resultant extravasation of RBCs and contrast agent may be detected sonographically (Fleischer, 2008).
Other promising clinical applications of contrast-enhanced sonography currently under investigation include monitoring tumor and therapeutic angiogenesis, inflammation assessment, evaluation of ischemia and reperfusion injury, early detection of transplant rejection, and targeted drug delivery (Hwang, 2010).
Elastography is an ultrasound imaging technique that measures tissue stiffness in both physiological and pathological states. To obtain an elastographic image, a source of “stress” or “strain” promotes tissue deformation to assess this stiffness (Stoelinga, 2014).
There are three main types of ultrasound elasticity imaging: (1) elastography that tracks tissue movement during compression, typically used to interrogate veins for thrombus; (2) tracking of acoustic shear wave propagation through tissue, often used for prostate evaluation; and (3) the most common method, vibration sonoelastography (Garra, 2007). With vibration sonoelastography, low-amplitude, low-frequency shear waves propagate through the organ of interest, while real-time color Doppler techniques generate an image of tissue movement in response to the external vibrations (Taylor, 2000). For example, if a discrete, hard inhomogeneous mass, such as a tumor, lies within a region of soft tissue, the vibration amplitude is decreased at its location.
Numerous organs and diseases have been evaluated by sonoelastography, and uterine evaluation with this has gained increased attention. Potential areas of investigation include distinguishing endometrial polyps from submucous pedunculated myomas, endometrial cancer from benign endometrial thickening, cervical cancer from normal cervix, and leiomyomas from adenomyosis (Stoelinga, 2014). Moreover, identifying uterine and cervical stiffness during pregnancy may prove valuable for management of preterm or postterm complications (Molina, 2012).
Ultrasound energy during conventional imaging propagates harmlessly through tissue with little energy being absorbed. This energy is deposited as heat but dissipates by the cooling effects of perfusion and conduction. No harmful effects have been recorded at the intensities used for diagnostic purposes (American Institute of Ultrasound in Medicine, 2009).
If, however, the ultrasound beam carries a high level of energy and is brought into tight focus, this energy is rapidly converted into heat. When target spot temperatures rise above 55 ºC, proteins are denatured, cells die, and coagulative necrosis is incited (Lele, 1977). In contrast, surrounding tissues are warmed but not to lethal temperatures. The current gynecologic use for this modality is treatment of symptomatic leiomyomas and is illustrated in Chapter 9.
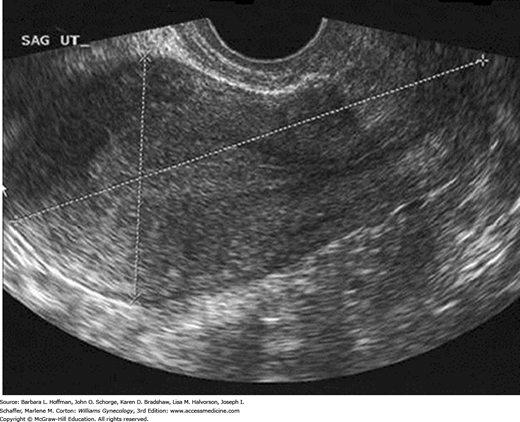
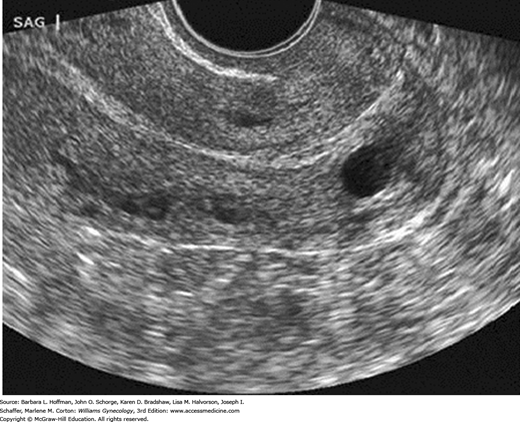
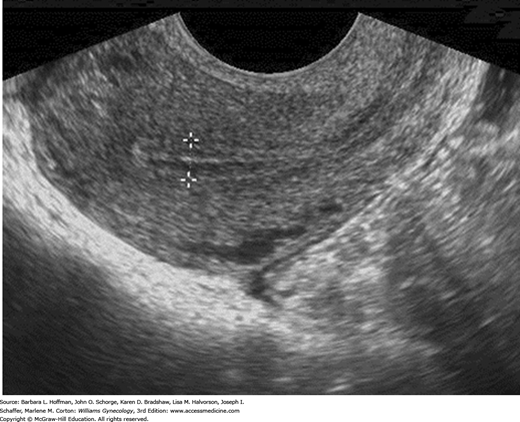
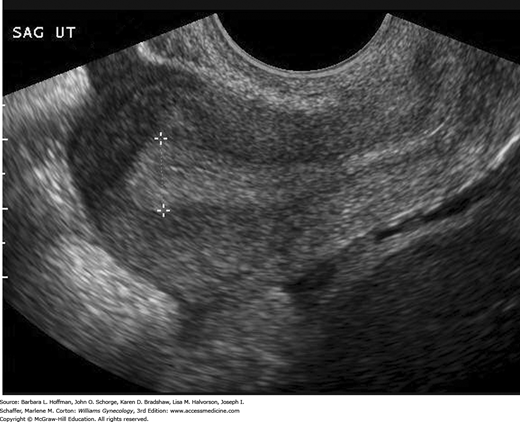
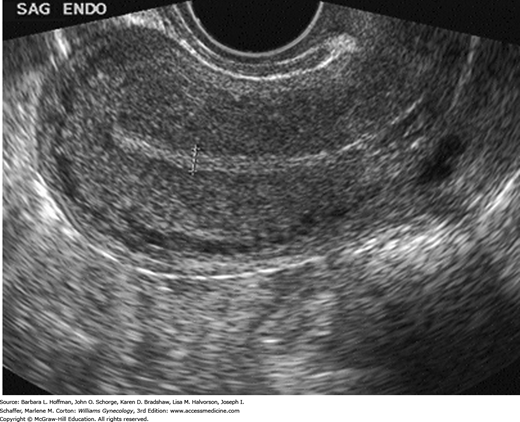
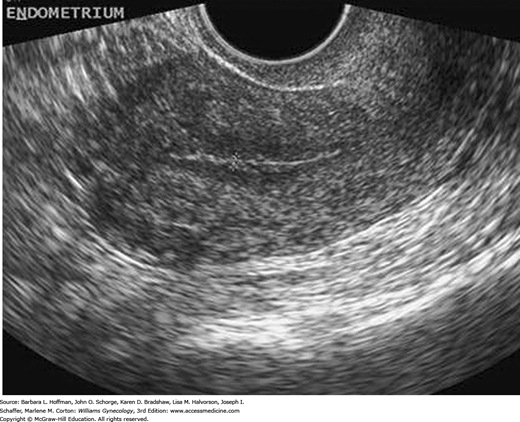
In the reproductive years, a normal uterus measures approximately 7.5 × 5.0 × 2.5 cm but is smaller in prepubertal, postmenopausal, or hypoestrogenized women. Normal uterine stroma returns low-level, uniform echoes, and the position of the endometrial and endocervical canals is indicated by linear echogenic stripes, representing the interfaces between mucus and mucosa (Fig. 2-13). The cervix is best visualized transvaginally with the tip of the probe placed 2 to 3 cm from it. The endocervical canal is a continuation of the endometrial cavity and appears as a thin echogenic line (Fig. 2-14). The vagina is seen as a hypoechoic tubular structure with an echogenic lumen that curves inferiorly over the muscular perineal body at the introitus.
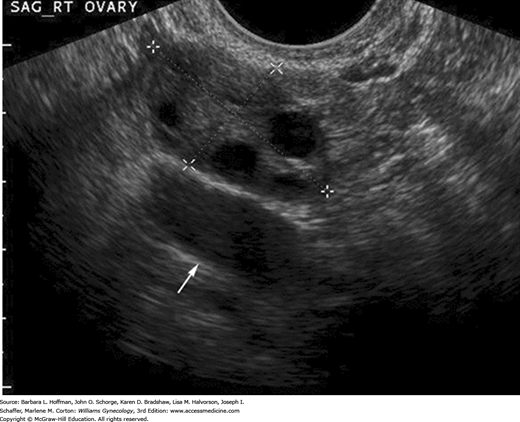
The ovaries are ellipsoid and normally lie in the ovarian fossa with their long axes parallel to the internal iliac vessels, which lie posteriorly (Fig. 2-15). Ovarian volume ranges from 4 to 10 cubic centimeters depending on hormonal status (Cohen, 1990). This volume is calculated using the formula for the volume of an ellipse: 4/3(π) × (A × B × C). In this formula, A, B, and C are the ovarian diameters in centimeters, measured in the three different planes. Ovarian follicles appear as spherical anechoic structures within the ovary and may reach a normal size of 3 cm. Normal fallopian tubes are not visible. A small amount of fluid in the posterior cul-de-sac is a normal finding and is often seen with ovulation.
Functionally, the endometrium has two main layers: the stratum basale, which comprises the densely cellular supporting stroma and varies little with the phase of the menstrual cycle, and the stratum functionale, which proliferates during each cycle and partially desquamates at menses. These layers cover the entire cavity.
Sonographically, the endometrium’s appearance during the menstrual cycle correlates with the phasic changes in its histologic anatomy. During the follicular phase, when the endometrium is provided estrogen from ovarian folliculogenesis, the stratum basale appears echogenic due to spectral reflections from the mucus-laden glands. In contrast, the stratum functionale is relatively hypoechoic because of the orderly arrangement of glands that lack secretions. The central opposing surfaces of these two endometrial layers manifest as a highly reflective, thin midline stripe. Together, the three echogenic lines create the characteristic trilaminar appearance of the proliferative endometrium (Fig. 2-16).
Measurement of this endometrial thickness extends from the echogenic interface of the anterior basale layer and myometrium to the echogenic interface of the posterior basale layer and myometrium. It thus represents a “double thickness.” The hypoechoic halo outside of and adjacent to the endometrium is not included in the measurement as this is actually the inner compact layer of myometrium. Sonographically, the endometrium is measured from a sagittal or long-axis image of the uterus in the plane where the central endometrial echo is seen contiguous with the endocervical canal and seen distinct from the myometrium. Endometrial thickness correlates approximately with the day of the cycle up to day 7 or 8.
With ovulation and progesterone production from the corpus luteum during the secretory phase, glandular enlargement and secretory vacuoles are seen histologically. During this phase, the endometrium achieves its maximum thickness as the stroma becomes more vascular and edematous. Sonographically, these changes cause the endometrium to appear echogenic (Fig. 2-17).
With menstruation, the endometrium appears as a slightly irregular echogenic interface from sloughed tissue and blood. The thinnest endometrial measurements are found at conclusion of menses (Fig. 2-18).
With cessation of estrogen stimulation beginning at menopause, the endometrium atrophies, and cyclic sloughing ceases. The postmenopausal endometrium appears thin and uniform (Fig. 2-19).
With the advent of urogynecology as a specialty, sonography is widely used to evaluate pelvic floor anatomy and function (Dietz, 2012). Various 2-D techniques, including transvaginal, transrectal, transperineal, and intraurethral sonography, have been used to investigate urethral anatomy.
Transrectal sonography was the first technique used to assess anal sphincter morphology after childbirth. This method requires special equipment and distention of the anal canal. The technique has limited value in the immediate puerperium and only provides information regarding the anal sphincter. Thus, without levator ani muscle assessment, the posterior compartment is incompletely evaluated. Alternatively, anorectal morphology and the pelvic floor can both be assessed with vaginal sonography using a rotating endorectal probe or standard transvaginal probe. These methods are described further in Chapter 25.
Perineal sonography can also evaluate pelvic floor anatomy. The technique requires filling the bladder with approximately 300 mL of saline. With the woman either supine or erect, a 5-MHz curved-array transducer is placed in sagittal orientation to the perineum. This allows real-time imaging of the pubic symphysis, levator ani muscles, urethra, bladder neck, bladder, vagina, rectal ampulla, and anal canal simultaneously and with little transducer manipulation (Dietz, 2010). Measurements have been standardized by Schaer and coworkers (1995).
3-D ultrasound is increasingly selected to examine pelvic floor anatomy. Specifically, evaluation of pelvic anatomy, support, and mesh implants are some indications, as discussed earlier.
CLINICAL APPLICATIONS OF SONOGRAPHY
Transvaginal sonography is often preferred for early evaluation of pelvic pain, abnormal uterine bleeding, pelvic mass, early pregnancy complications, infertility practices, and early detection of ovarian and endometrial cancer. Many of these topics and their radiologic characteristics are covered in other chapters. Some remaining important subjects are presented in the following sections.
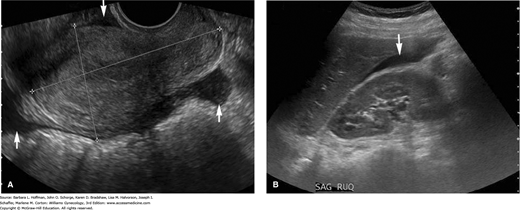
During general sonographic evaluation of the pelvis, a small amount of free fluid, as little as 10 mL, is commonly present in the posterior cul-de-sac (Khalife, 1998). If free fluid is seen extending to the fundus of the uterus, it is considered to be moderate in amount. Once identified, moderate free fluid should prompt further evaluation of the paracolic gutters and Morison pouch in the right upper quadrant to assess the extent of free fluid (Fig. 2-20). If fluid fills these areas, then the minimum volume of intraperitoneal fluid approximates 500 mL (Abrams, 1999; Branney, 1995). Large amounts of anechoic free peritoneal fluid generically described as ascites suggest a volume status abnormality or an infectious or inflammatory etiology. Free fluid that contains low-level echoes or echogenic debris is consistent with hemoperitoneum with clot, such as with a ruptured hemorrhagic cyst or ectopic pregnancy.
FIGURE 2-20
Hemoperitoneum. A. In this transvaginal image, a moderate amount of free fluid (arrows) is seen in the posterior cul-de-sac, above the fundus of the uterus, and in the anterior cul-de-sac. B. Transabdominal image of Morison pouch in the right upper quadrant. Free fluid, corresponding to the dark anechoic area (arrow), is visualized between the liver edge and the kidney, which suggests a large-volume hemoperitoneum.
The sensitivity of sonography to detect free fluid has led to its increased use during emergency trauma assessments. Focused assessment with sonography for trauma (FAST) is a limited sonographic examination directed solely at identifying free fluid for the diagnosis of traumatic injury. In the context of trauma, free fluid is usually due to hemorrhage. With FAST, four specific areas are imaged: perihepatic (right upper quadrant), perisplenic (left upper quadrant), pelvis, and pericardium. FAST has significant advantages compared with diagnostic peritoneal lavage and with CT for intraperitoneal fluid identification because it is a rapid, noninvasive, bedside test. However, there is a significant false-negative rate with FAST (Scalea, 1999). This is in part due to the FAST examination being carried out early in the resuscitation phase when only a small amount of free fluid may have collected in the dependent portions of the peritoneal cavity. In addition, as its use has become more widespread, conflicts have developed regarding credentialing and whether radiologists, emergency physicians, or trauma surgeons should be performing this sonographic technique.
Stay updated, free articles. Join our Telegram channel

Full access? Get Clinical Tree


