● HYPOPLASTIC LEFT HEART SYNDROME
Definition, Spectrum of Disease, and Incidence
Hypoplastic left heart syndrome (HLHS) is a group of complex cardiac malformations involving significant underdevelopment of the left ventricle and the left ventricular outflow tract (Fig. 22.1), resulting in an obstruction to systemic cardiac output. In HLHS, the aortic valve is often atretic, and occasionally HLHS fetuses present in utero with severe aortic stenosis. In Chapter 21, we presented cases of simple aortic stenosis that progressed in utero to critical aortic stenosis, with associated left ventricular dysfunction, endocardial fibroelastosis, and HLHS (Fig. 22.2). Figure 22.3 shows an anatomic specimen of HLHS with no left ventricle, while Figure 22.4 demonstrates an anatomic specimen of a heart with critical aortic stenosis and endocardial fibroelastosis resulting in a HLHS. HLHS is thus a wide spectrum of cardiac abnormalities that have in common severe obstruction to left ventricular outflow with ventricular dysfunction (Fig. 22.5). In general, two main classic forms of HLHS can be observed and will be discussed in this chapter. One form involves atresia of both the mitral and aortic valves, with practically no communication between the left atrium and left ventricle and a nearly absent or severely hypoplastic left ventricle (Figs. 22.5A and 22.6). The other form involves a visible left ventricle, with hyperechoic wall, globular shape, and poor contractility in association with severely dysplastic mitral valve combined with a severe aortic stenosis or aortic atresia (Figs. 22.5, 22.7, and 22.8). The reported birth incidence of HLHS is 0.1 to 0.25 per 1,000 live births (1). HLHS accounts for 3.8% of all congenital cardiac abnormalities, and up to seven-tenths of cases occur in boys (1, 2). Although HLHS is one of the most commonly diagnosed congenital heart abnormalities in utero (3), it is still missed in a significant proportion of fetuses (4). Recurrence of left-sided congenital heart disease has been reported in the range of 2% to 13% (5). It is often difficult to differentiate HLHS from critical aortic stenosis on fetal echocardiography given several overlapping features. Furthermore, critical aortic stenosis has been shown to progress to HLHS in some cases. In view of this, we hereby present the prenatal ultrasound features, associated abnormalities and prognosis of HLHS and critical aortic stenosis in the same chapter sections.
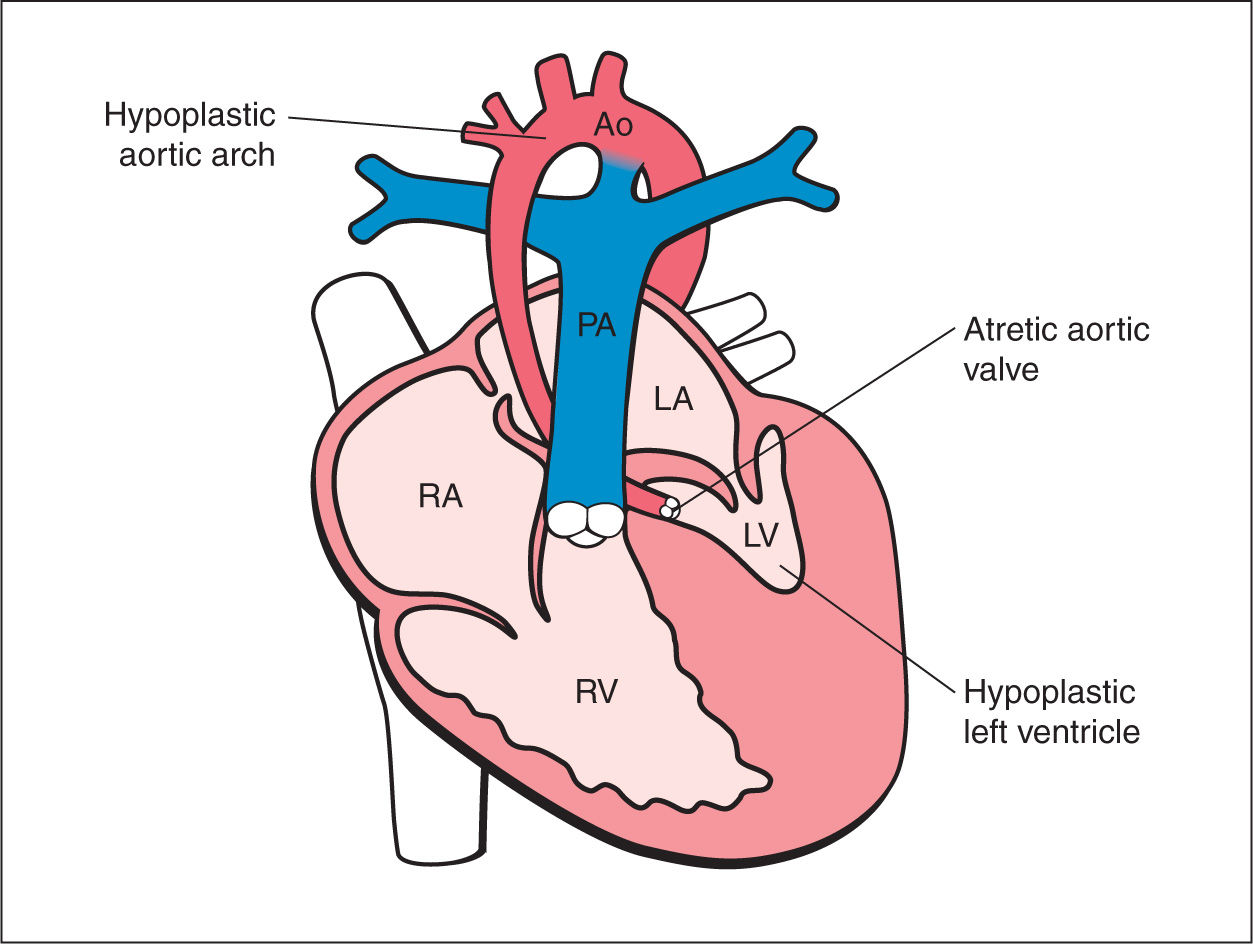
Figure 22.1: Schematic drawing of hypoplastic left heart syndrome with the typical features of hypoplastic hypokinetic left ventricle (LV), dysplastic mitral valve, atretic aortic valve, and hypoplastic aorta (Ao). RA, right atrium; RV, right ventricle; PA, pulmonary artery; LA, left atrium.
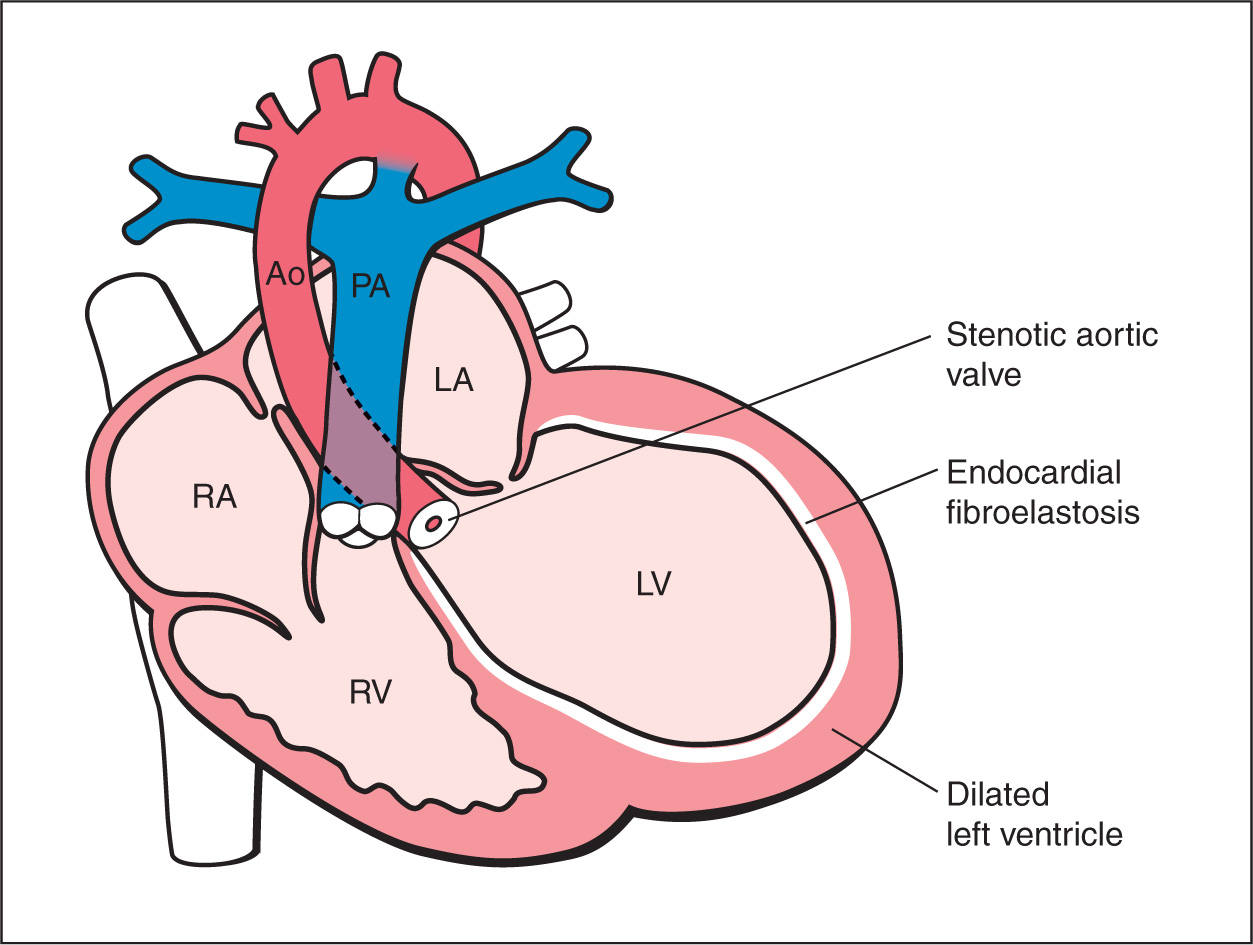
Figure 22.2: Schematic drawing of critical aortic stenosis. Note the presence of narrowing at the aortic valve level, obstruction to left ventricular outflow, small ascending aorta, and dilated, hyperechogenic left ventricle (fibroelastosis). RV, right ventricle; LV, left ventricle; RA, right atrium; LA, left atrium; PA, pulmonary artery; Ao, aorta.
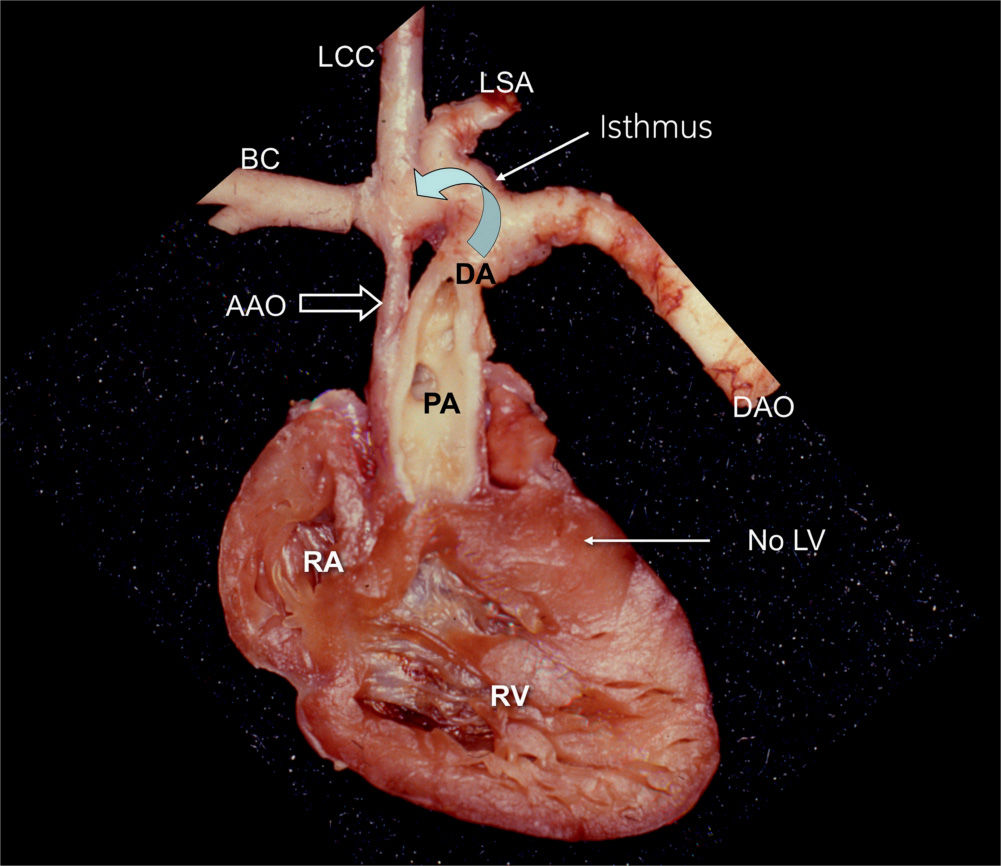
Figure 22.3: Anatomic specimen of a hypoplastic left heart in a fetus. The heart is opened at the level of the four-chamber view, demonstrating the absence of the left ventricle (LV). The ascending aorta (AAO) is hypoplastic in comparison to the dilated main pulmonary artery (PA). Retrograde flow through the ductus arteriosus (DA) provides blood to the aortic arch (curved arrow). RA, right atrium; RV, right ventricle; DAO, descending aorta; BC, brachiocephalic artery; LCC, left common carotid artery; LSA, left subclavian artery.
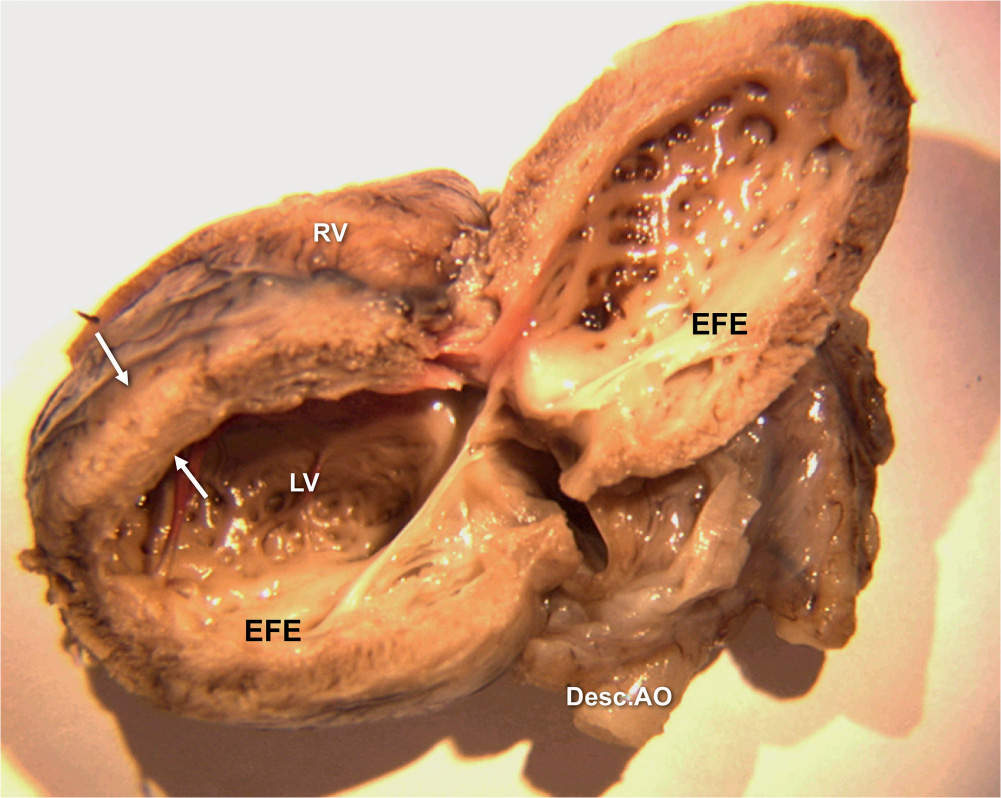
Figure 22.4: Anatomic specimen of a fetal heart with critical aortic stenosis. The lateral left ventricular (LV) wall is open, demonstrating the thickened and echogenic endocardium (arrows). Desc.AO, descending aorta; RV, right ventricle; EFE, endocardial fibroelastosis.
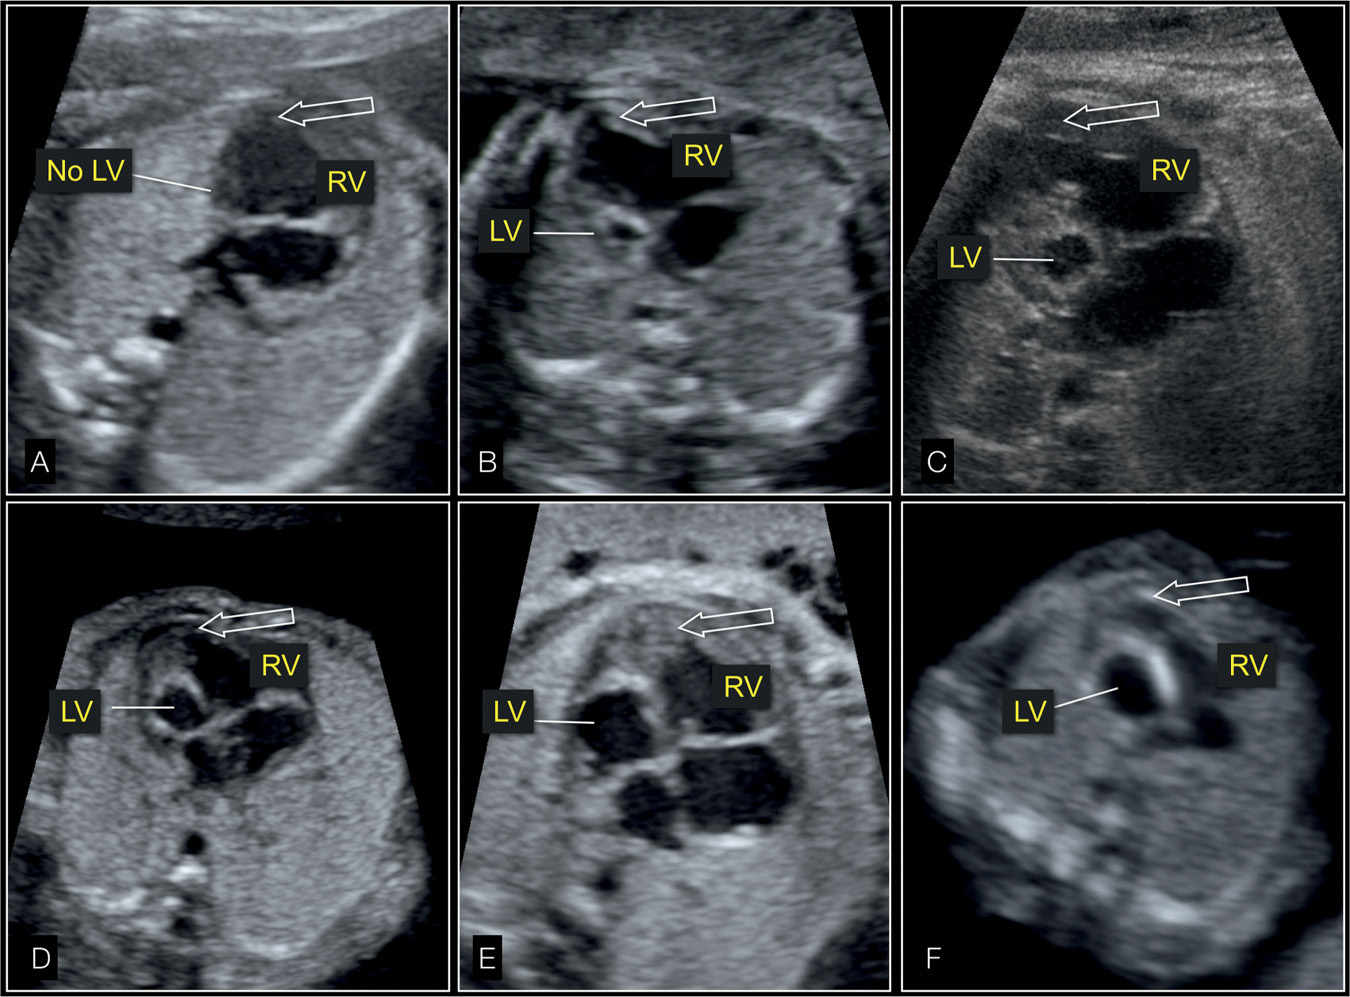
Figure 22.5: Four-chamber views of fetal hearts showing the spectrum of hypoplastic left heart syndrome with absent (A), small (B–E), and dilated (F) left ventricle (LV). The cardiac apex (arrow) is formed by the right ventricle (RV) in all cases.
Ultrasound Findings
Gray Scale
In HLHS, the four-chamber view is markedly abnormal with a small, hypokinetic left ventricle (Figs. 22.6 to 22.9) with the apex of the heart predominantly formed by the right ventricle (Figs. 22.7 and 22.8). The size of the left ventricle, however, can vary and can be absent, small, of normal size, or even dilated (Figs. 22.3 to 22.9), but in all cases this ventricle is hypocontractile with decreased function. The contractility of the left in comparison with the right ventricle can be well demonstrated with M-Mode (Fig. 22.9). In most cases the aortic valve is atretic, the mitral valve is patent but dysplastic, and the left ventricle is typically globular in shape and hypokinetic, with a bright echogenic inner wall due to the associated endocardial fibroelastosis (Figs. 22.5, 22.7A, 22.8A, and 22.9A). The left atrium is small relative to the right atrial size with a paradoxical movement of the leaflet of the foramen ovale from the left-to-right atrium (Fig. 22.10). In the five-chamber view, the aortic outflow is difficult to visualize due to its hypoplastic size (<3 mm). At the level of the three-vessel trachea view, the compensatory dilated pulmonary trunk is seen adjacent to the superior vena cava with a nonvisible or hypoplastic transverse aortic arch as a sign of the tubular hypoplasia of the aortic arch (Fig. 22.11).
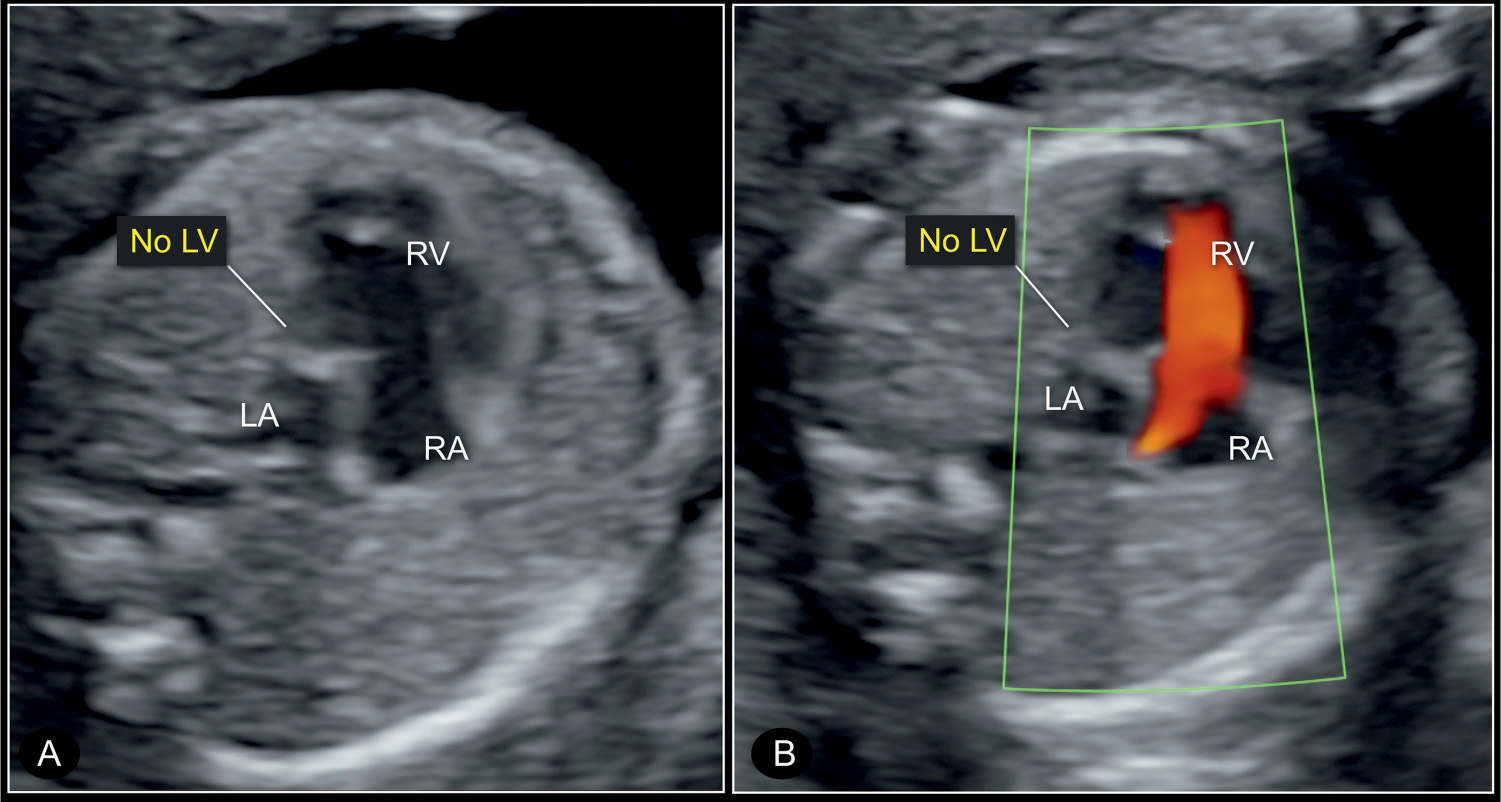
Figure 22.6: Four-chamber view of a hypoplastic left heart syndrome at 22 weeks’ gestation in 2D (A) and color Doppler (B) imaging. Note the small left atrium (LA) and the absent left ventricle (no LV) in gray scale (A). Color Doppler in B shows absence of blood filling in diastole. RV, right ventricle; RA, right atrium; LA, left atrium.
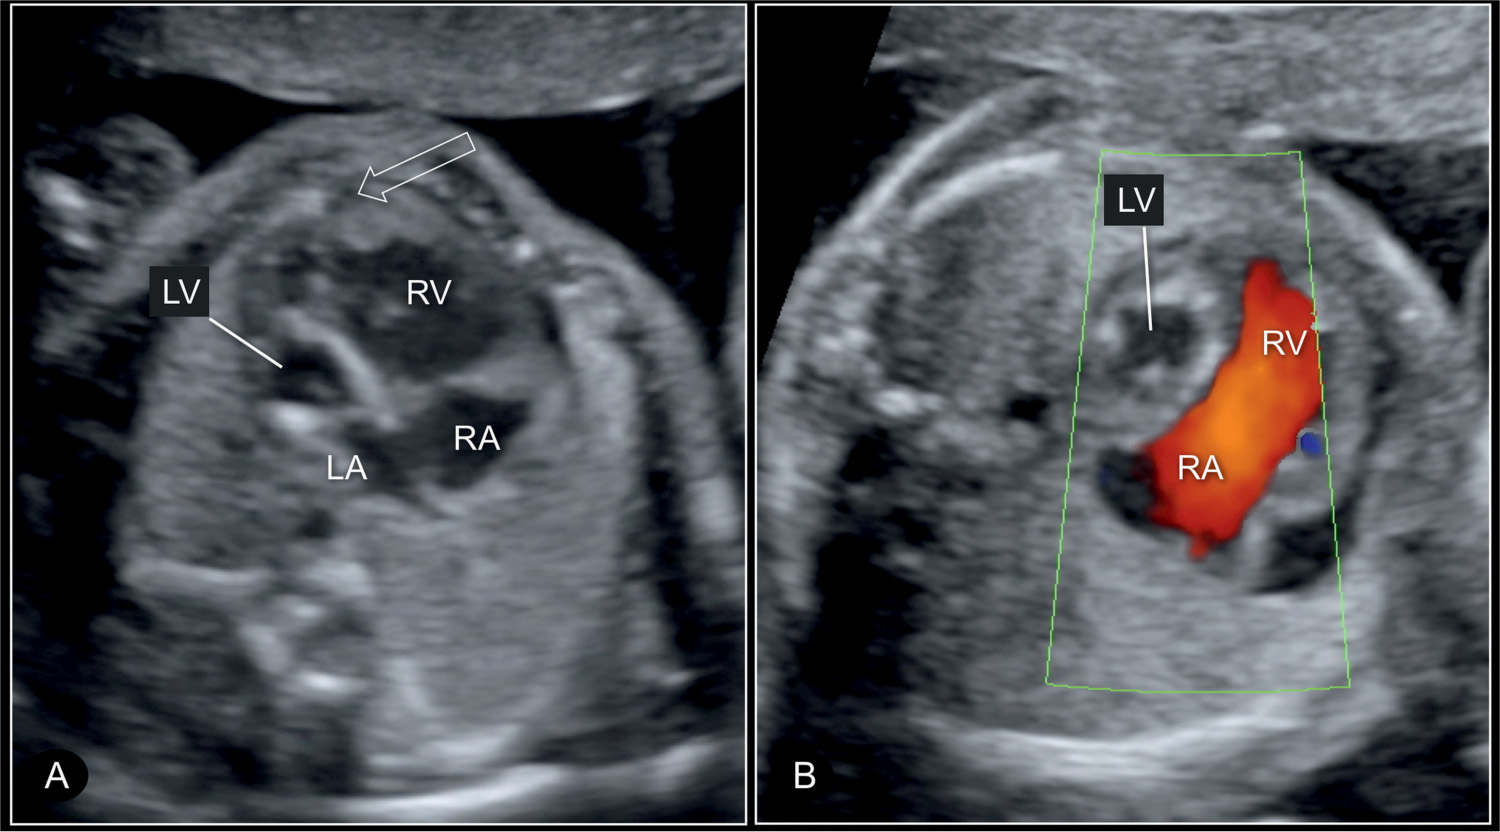
Figure 22.7: Four-chamber view of a hypoplastic left heart syndrome at 22 weeks’ gestation in 2D (A) and color Doppler (B) imaging. In this case, there is a small left atrium (LA) and hypoplastic left ventricle (LV) with echogenic wall (A) and without blood filling on color Doppler in diastole (B). Open arrow in A shows that the right ventricle is apex forming. RV, right ventricle; RA, right atrium.
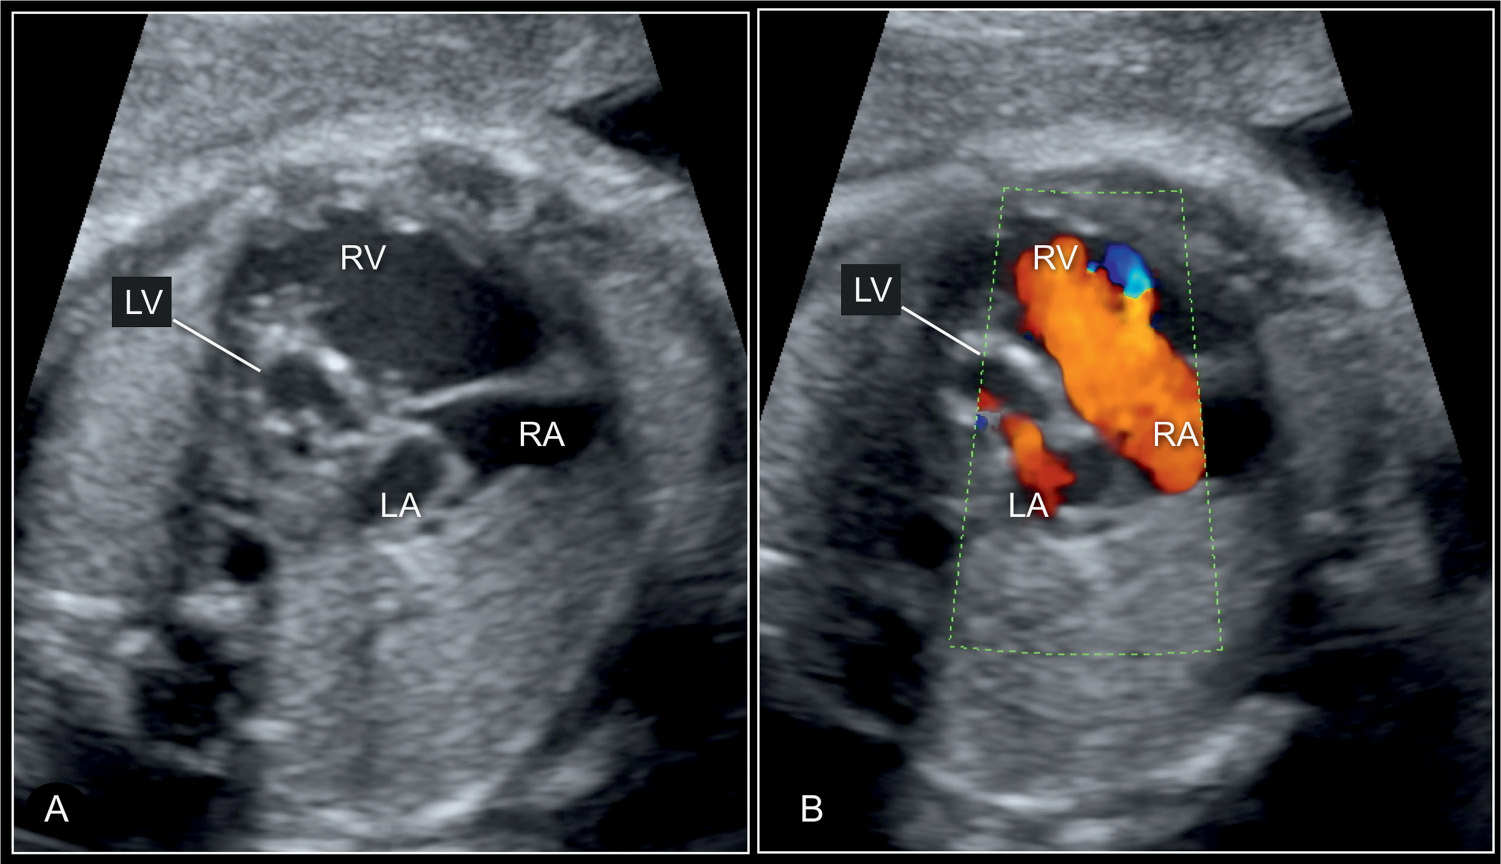
Figure 22.8: Four-chamber view of a hypoplastic left heart syndrome at 30 weeks’ gestation in 2D (A) and color Doppler (B) imaging. In this case, the diminutive left atrium (LA) and left ventricle (LV) with wall hypertrophy are seen (A) and in color Doppler some blood filling of the LV is recognized in diastole (B). RV, right ventricle; RA, right atrium.
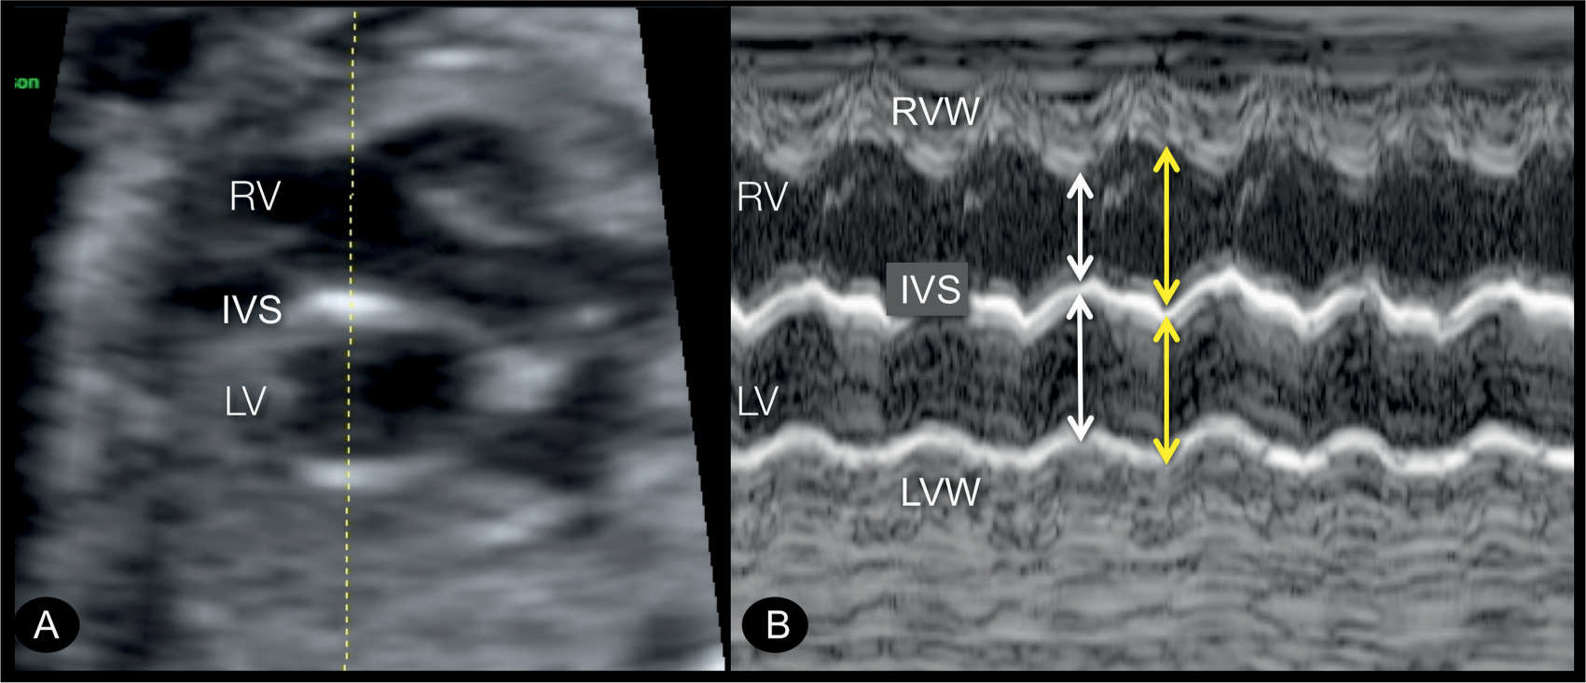
Figure 22.9: Transverse four-chamber view (A) and M-mode display (B) in a fetus with endocardial fibroelastosis in a hypoplastic left heart syndrome. In A, the left ventricle (LV) is dilated and globular in shape, with echogenic wall typical for an endocardial fibroelastosis. M-mode tracing is shown in B, demonstrating hypocontractile LV in comparison to the right ventricle (RV). Ventricular width is nearly identical in the LV in systole (white arrow) and diastole (yellow arrow) in contrast to that of the RV. IVS, interventricular septum; LVW, left ventricular wall; RVW, right ventricular wall.
Critical aortic stenosis is typically associated with an abnormal four-chamber view where the left ventricle is dilated and circular with reduced contractility (Fig. 22.12). Commonly, the left ventricular wall is echogenic, a sign of endocardial fibroelastosis (Fig. 22.13). The apex of the heart can be still formed by the dilated left ventricle. The left atrium may be dilated due to mitral valve regurgitation. The five-chamber view shows a narrow aortic root (Figs. 22.12B and 22.13B) with reduced movement of valve leaflets. The ascending aorta may show poststenotic dilation or narrowing (Fig. 22.13B).
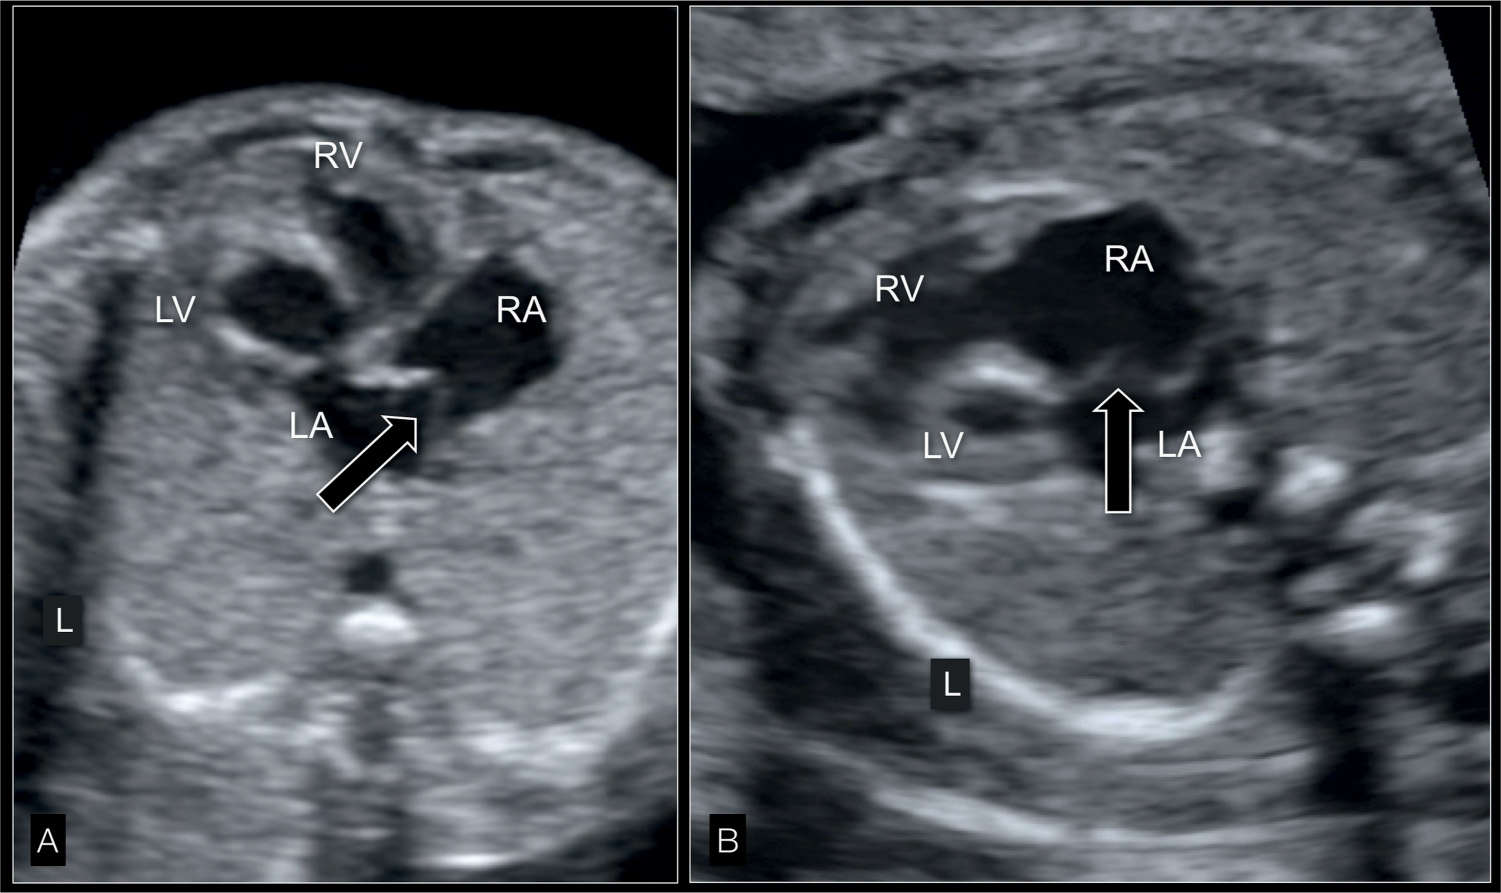
Figure 22.10: Four-chamber view in gray scale in two fetuses (A and B) with hypoplastic left heart syndrome at 22 weeks’ gestation showing the interatrial septum. The atrial septum bulges into the right atrium (RA) (white open arrows) due to left-to-right shunting at the foramen ovale. Compare with color and pulsed Doppler correlate in Figure 22.14. LA, left atrium; LV, left ventricle; RV, right ventricle; L, left.
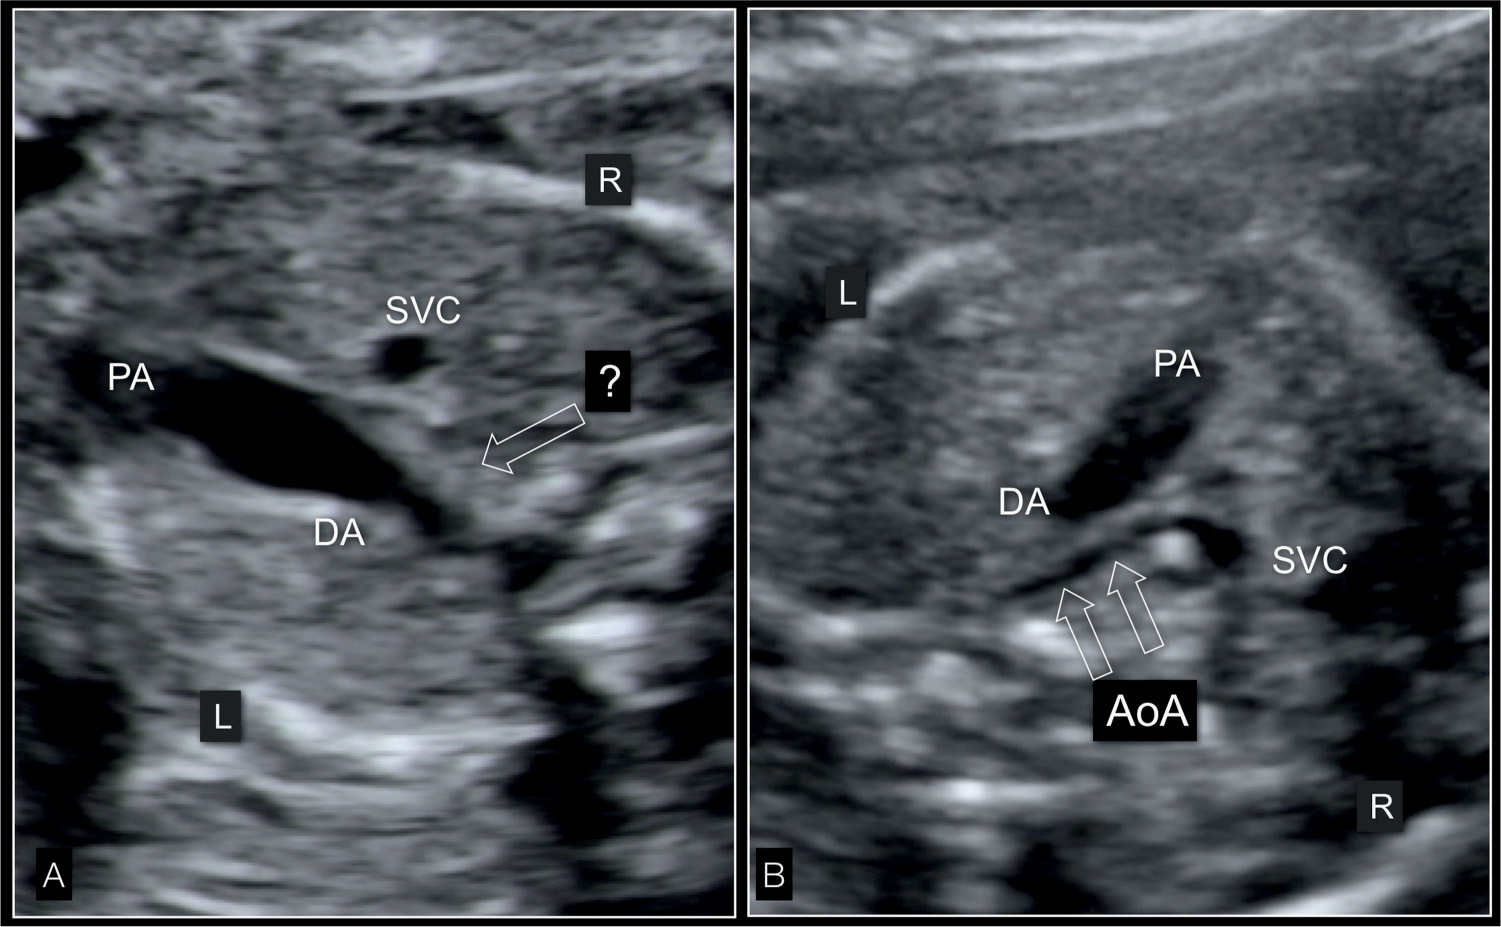
Figure 22.11: Three-vessel-trachea view in two fetuses (A and B) with hypoplastic left heart syndrome in gray scale. In A, the ascending aorta is not visible (open arrow) and the pulmonary artery (PA) is dilated. In the fetus in B, the tubular hypoplasia of the aortic arch (AoA) (open arrows) is visualized. DA, ductus arteriosus; SVC, superior vena cava; L, left; R, right.
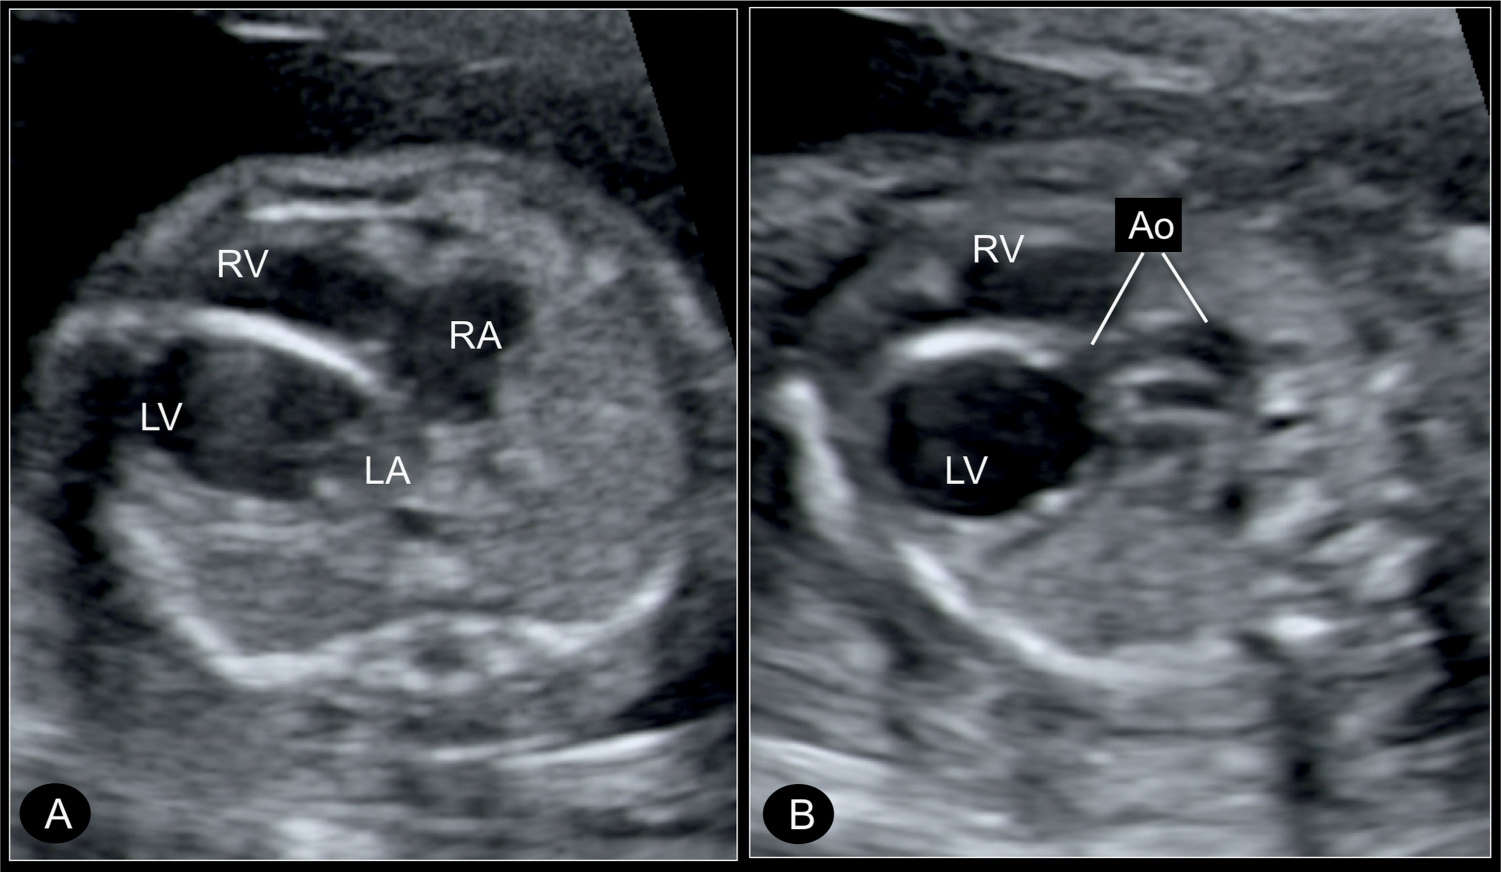
Figure 22.12: Transverse four-chamber view (A) and five-chamber view (B) in a fetus with critical aortic stenosis at 21 weeks’ gestation, with a dilated left ventricle (LV). A shows the LV dilated and globular in shape, with echogenic wall as a sign of endocardial fibroelastosis. The hypoplastic ascending aorta (Ao) is shown in B by angling the transducer. RA, right atrium; RV, right ventricle; LA, left atrium.

Figure 22.13: Apical four-chamber view (A) and five-chamber view (B) in a fetus with critical aortic stenosis at 30 weeks’ gestation. In A, the left ventricle (LV) is dilated and globular in shape, with the apex of the heart still formed by the left ventricle (open arrow). In B, the narrow aortic root with the poststenotic dilation of the ascending aorta (Ao) is visualized (double arrows). RV, right ventricle; RA, right atrium; LA, left atrium.
Color Doppler
In HLHS, color Doppler of the four-chamber view demonstrates either the unilateral perfusion between the right atrium and ventricle in cases with an absent left ventricle (Fig. 22.6B), or an absent or minimal filling of a hypoplastic left ventricle (Figs. 22.7B and 22.8B) in cases where the left ventricle is present. Owing to the increased pressure in the left atrium, a left-to-right shunting across the foramen ovale is often well visualized on color Doppler (Figs. 22.14 and 22.15) from a lateral insonation and can be confirmed by pulsed Doppler (Figs. 22.14 and 22.15). In the five-chamber view, color Doppler fails to demonstrate forward flow across the atretic aortic valve. Abnormalities in color Doppler are noted at the level of the three-vessel-trachea view where antegrade flow within the dilated pulmonary artery and reversal of flow across the narrow aortic isthmus and transverse aortic arch are visualized (Figs. 22.16 and 22.17) (see also Chapter 9). A longitudinal view of the aortic and ductal arch with color Doppler confirms the retrograde flow from the ductus arteriosus into the aortic isthmus (Fig. 22.17). Pulsed Doppler of the pulmonary venous flow is unique in HLHS and shows a characteristic end-diastolic pronounced reverse flow of the A-wave (Figs. 22.18 and 22.19). The pathophysiologic reason for the pronounced reverse flow of the A-wave in the pulmonary veins is related to the increased left atrial pressure during the cardiac cycle (6). Since in fetuses with HLHS no perfusion occurs during atrial systole (A-wave) between the left atrium and ventricle, blood empties from the left atrium through the foramen ovale into the right atrium and backward into the pulmonary veins. The latter is documented as a reversal of flow in the pulmonary veins at end diastole. It has been shown that the narrower the foramen ovale, the more severe is the end-diastolic reverse flow recorded in spectral Doppler of the pulmonary veins (7). In the rare condition of a large interatrial communication, no reverse flow is noted in Doppler waveforms of the pulmonary veins, whereas in sealed interatrial septum, a to-and-fro flow is observed (6). Figure 22.19 shows the spectrum of reverse flow in Doppler waveforms of pulmonary veins. Figure 22.19D represents a fetus with HLHS in association with sealed foramen ovale, a condition that is commonly associated with a poor prognosis.
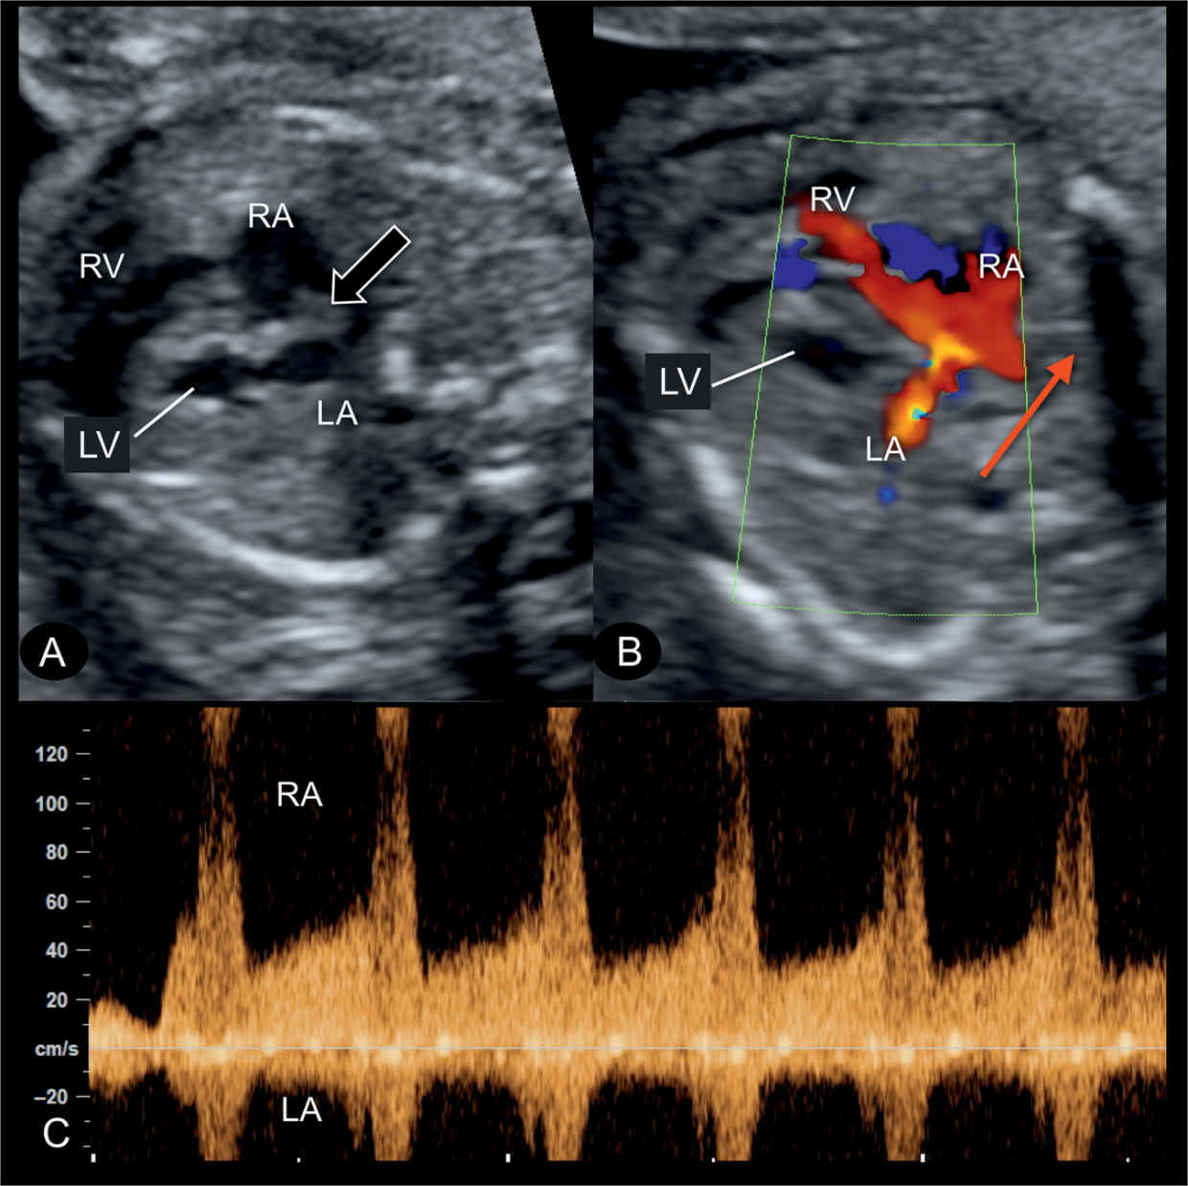
Figure 22.14: Transverse four-chamber view in gray scale (A), color Doppler (B), and the corresponding spectral Doppler (C) of the interatrial flow, in a fetus with hypoplastic left heart syndrome at 22 weeks’ gestation. A: the atrial septum bulges into the right atrium (RA) (open arrow) (see also Fig. 22.10) due to left-to-right shunting at the foramen ovale. B: demonstrates on color Doppler (red arrow) left-to-right blood shunting at the foramen ovale. C: pulsed Doppler shows the high velocities (>100 cm/s) across the foramen ovale with flow direction from left atrium (LA) to RA. LV, left ventricle; RV, right ventricle.
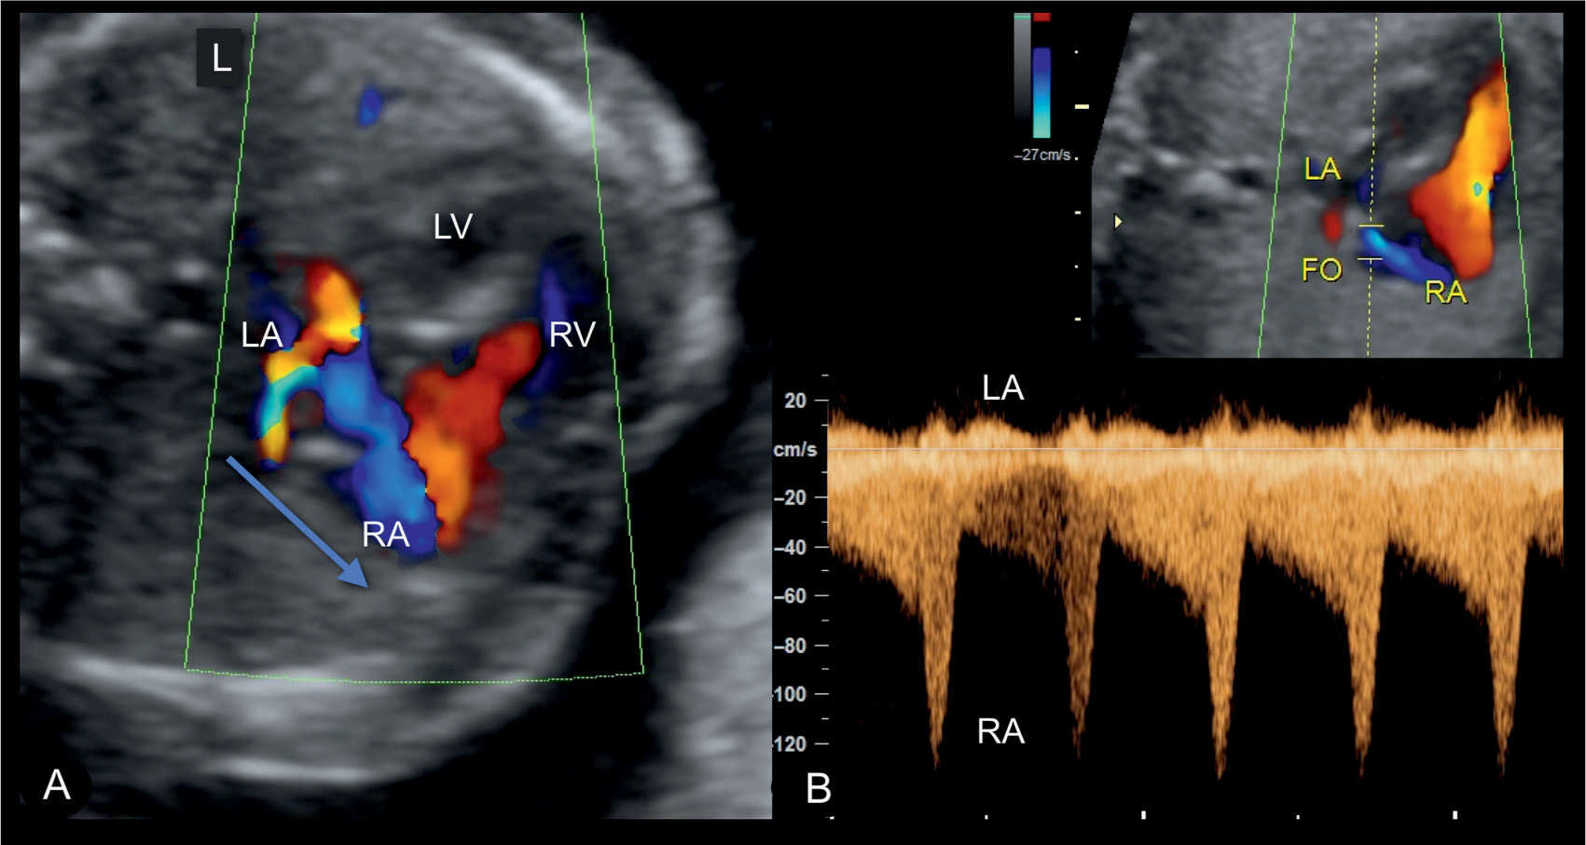
Figure 22.15: Apical four-chamber view in color Doppler in a fetus with a hypoplastic left heart syndrome, showing the interatrial left-to-right shunting in A, shown in blue color. In B, high velocities are noted on spectral Doppler similar to findings in Figure 22.14. LA, left atrium; LV, left ventricle; RV, right ventricle; RA, right atrium; FO, foramen ovale; L, left.
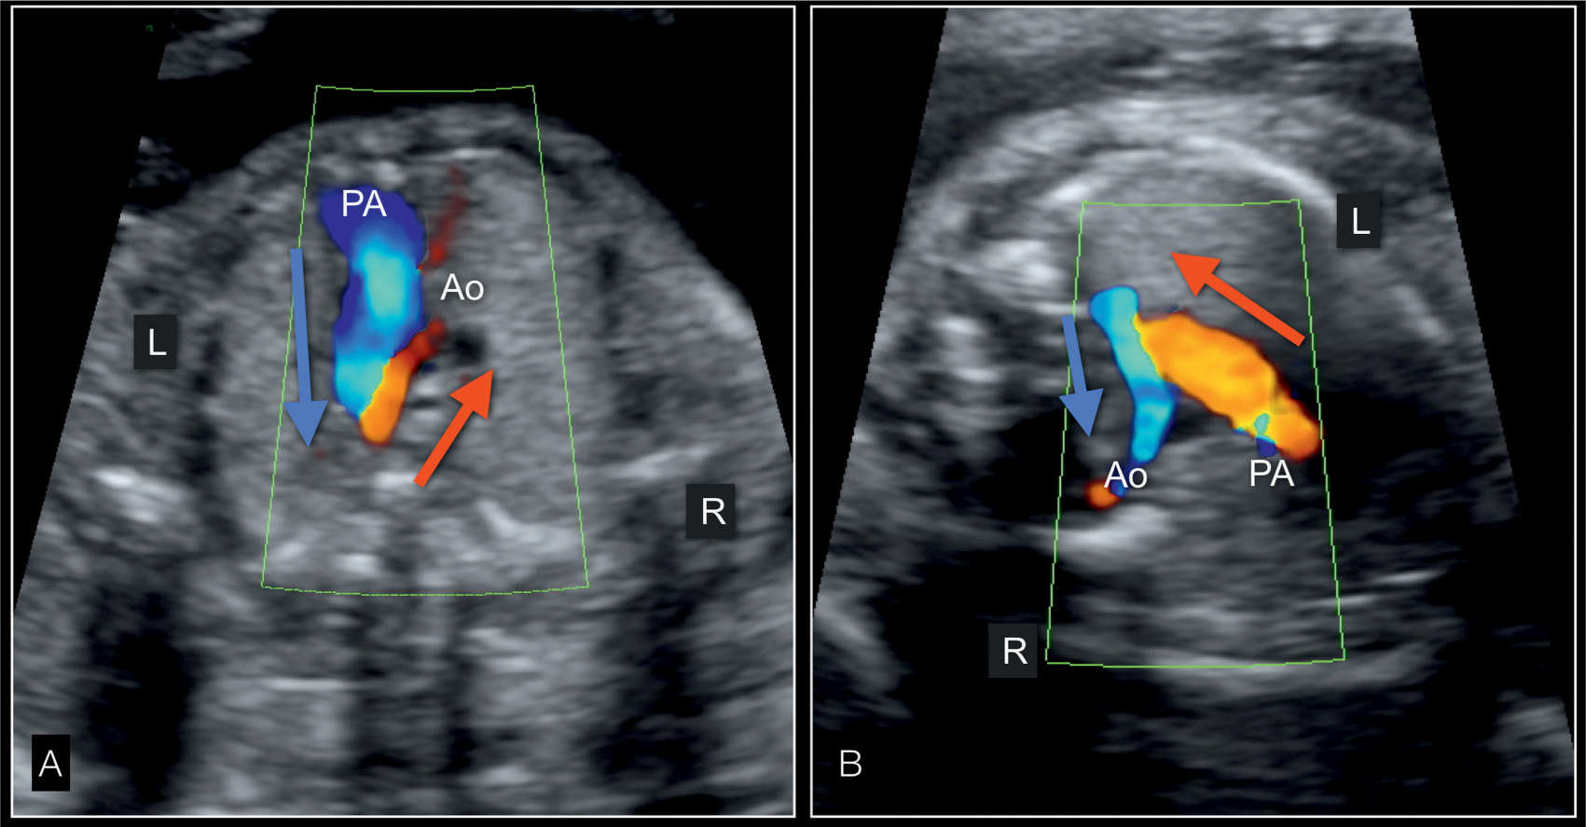
Figure 22.16: Three-vessel-trachea view in color Doppler in two fetuses with hypoplastic left heart syndrome in an apical view (A) and in a view from a left dorsoanterior position (B). In A, the dilated pulmonary artery (PA) has antegrade flow (blue, blue arrow) whereas the small aorta (Ao) has reverse flow (red, red arrow). In B, the pulmonary artery flow is up with flow in red (red arrow) whereas blood flow is in retrograde direction (down) in the aortic arch and shown in blue (blue arrow). R, right; L, left.
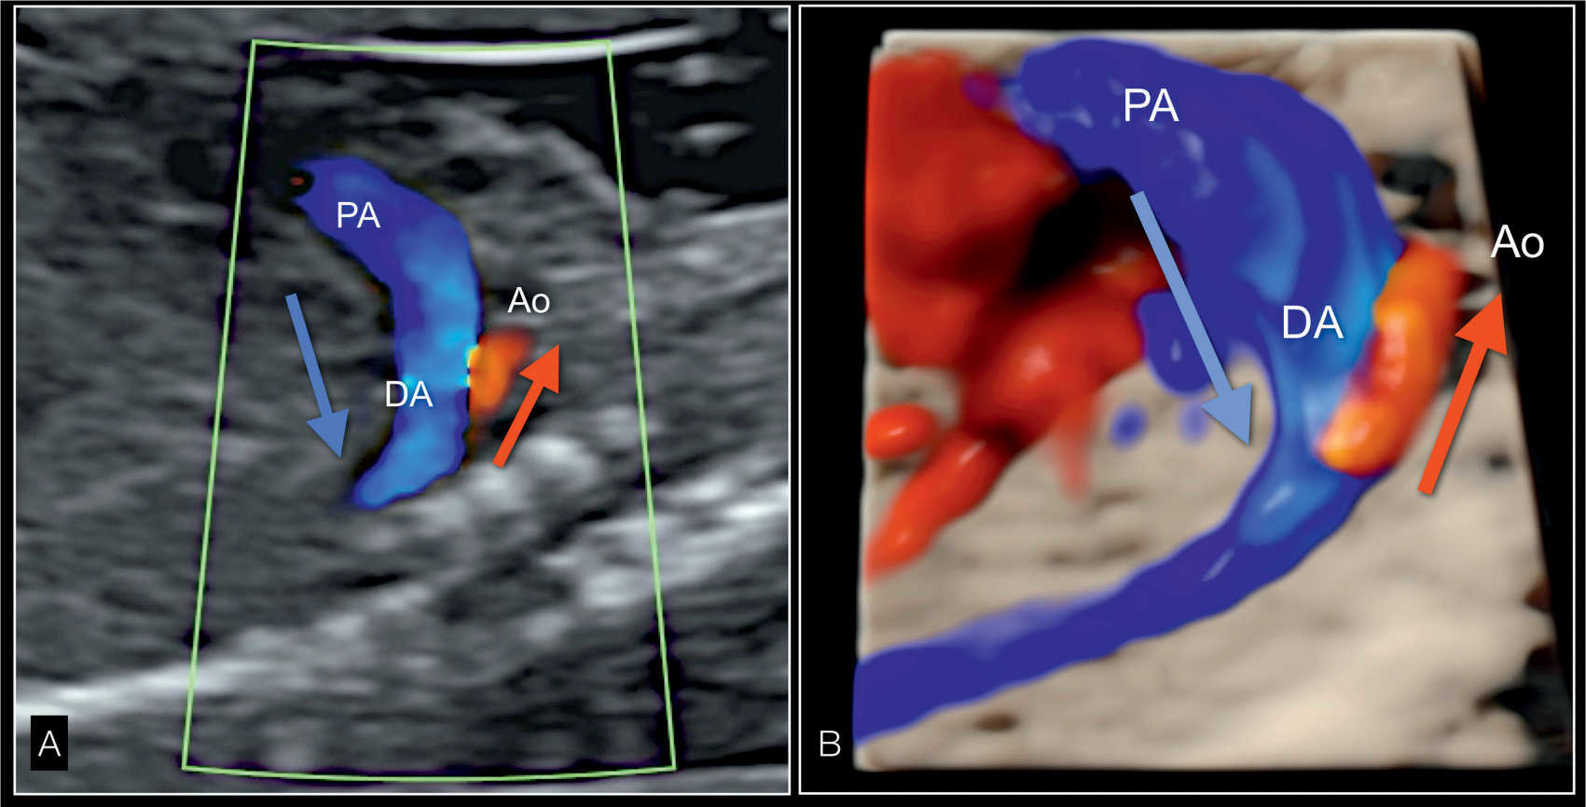
Figure 22.17: Parasagittal longitudinal view in color Doppler (A) and in 3D glass-body rendering (B) of the great vessels in a fetus with hypoplastic left heart syndrome. A shows reverse flow in the small aortic arch (Ao), shown in red (red arrow), and antegrade flow in the dilated pulmonary artery (PA) and ductus arteriosus (DA), shown in blue (blue arrow). In B, the 3D-rendered image in glass-body mode better demonstrates the spatial relationship and size of both great vessels.
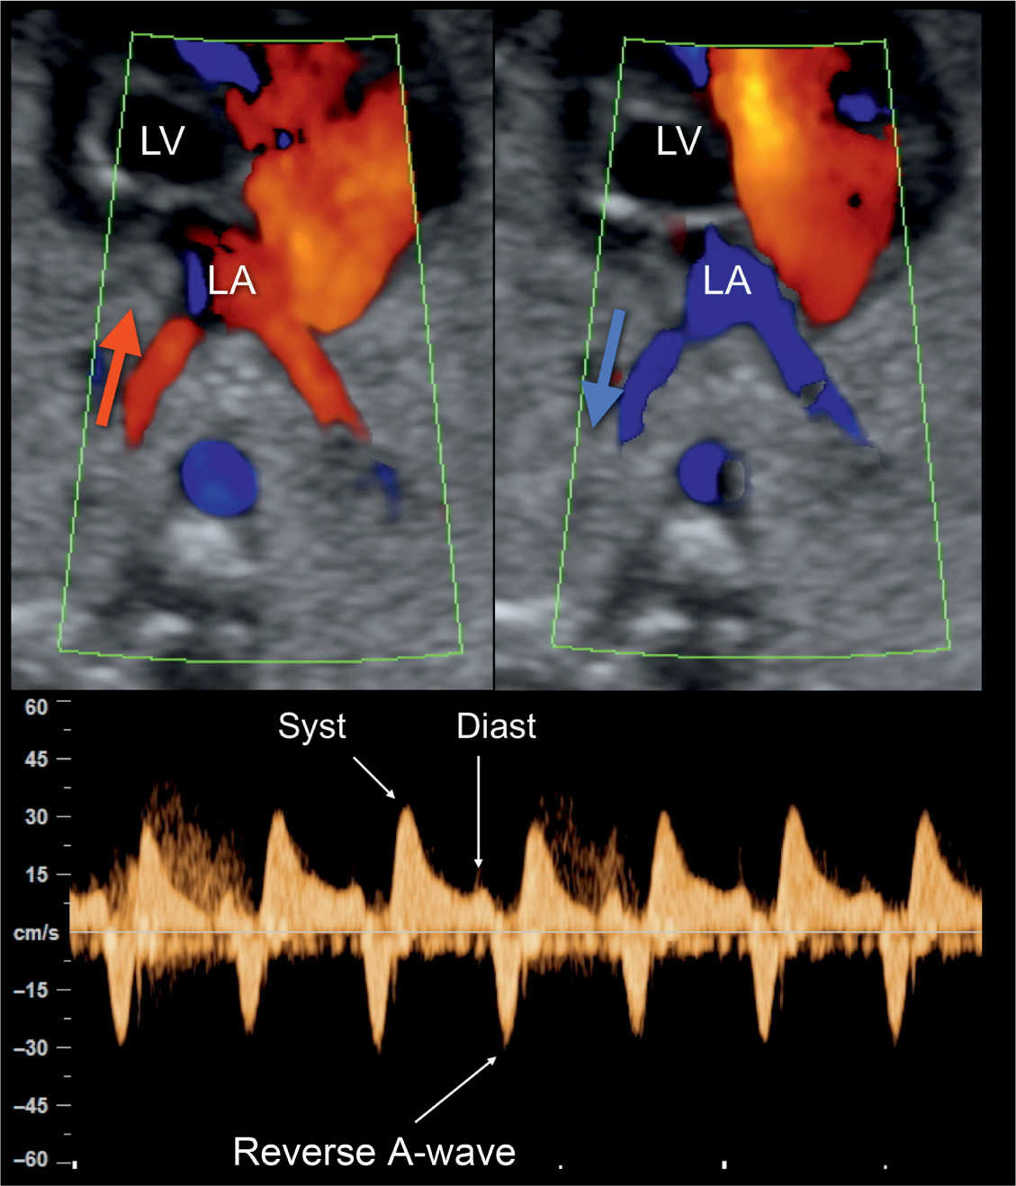
Figure 22.18: Color and pulsed Doppler examination of the pulmonary veins in a fetus with hypoplastic left heart syndrome and restrictive foramen ovale. Color Doppler shows bidirectional flow in the pulmonary veins (red in A; blue in B) at the level of their entry into the left atrium (LA). Pulsed Doppler (C) shows high systolic velocity (Syst), low diastolic velocity (Diast), and reverse flow during the atrial contraction (reverse A-wave) (compare with Fig. 22.19). LV, left ventricle.
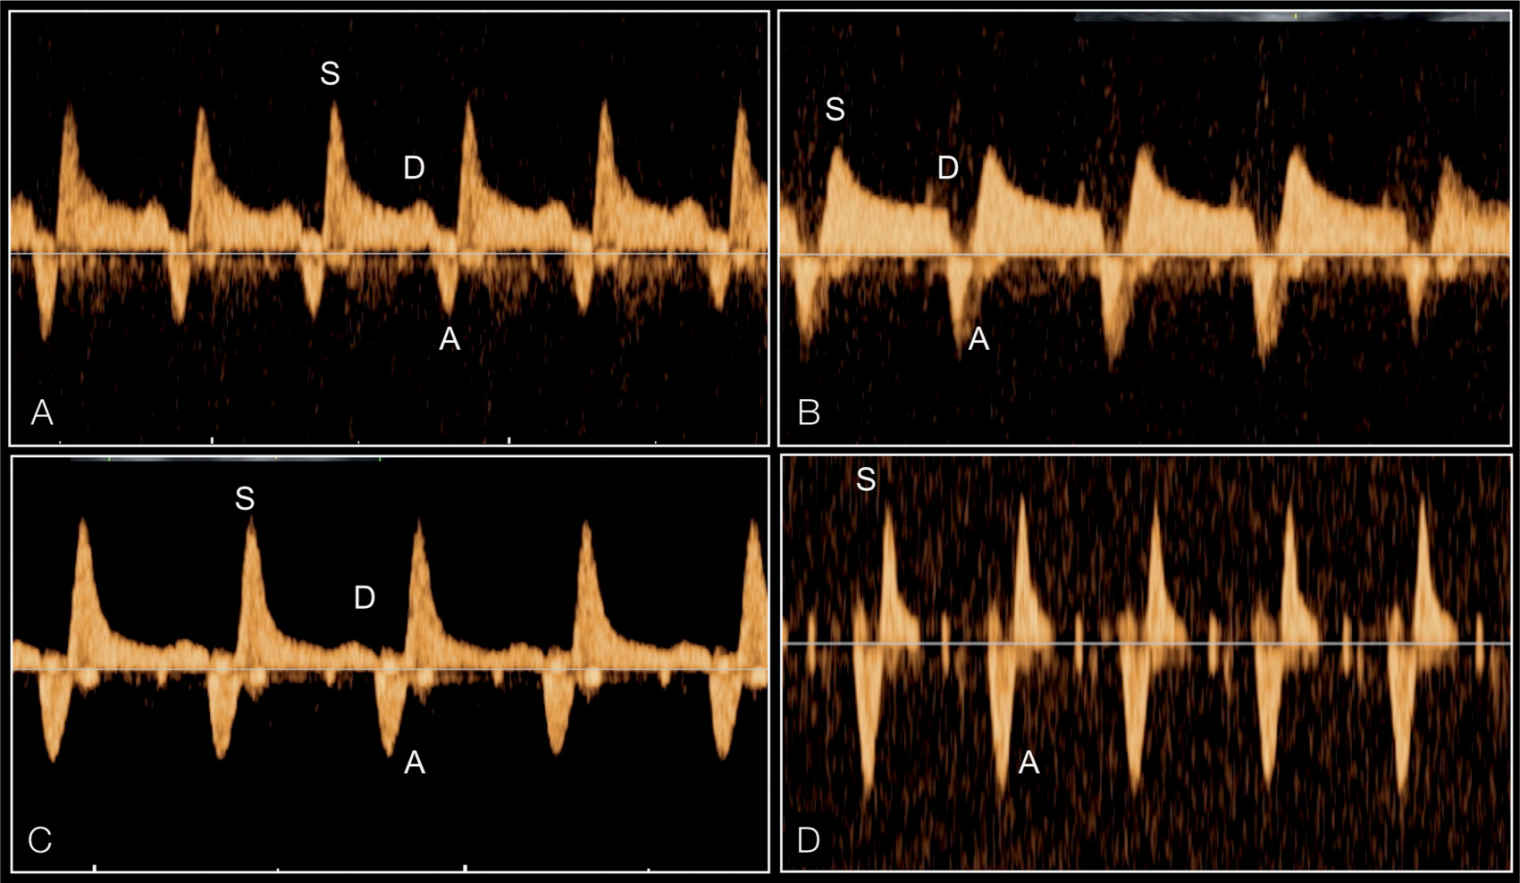
Figure 22.19: Pulsed Doppler of the pulmonary veins in four fetuses with hypoplastic left heart syndrome and varying severities of restrictive foramen ovale. Note the increase in waveform pulsatility between fetuses (A–D). The degree of reverse flow in comparison to antegrade flow is different between the four fetuses. Fetus (D) has the typical shape of a sealed foramen ovale with to-and-fro flow. S, systole; D, early diastole; A, atrial contraction.
In critical aortic stenosis, color Doppler shows at the level of the four-chamber view right and left ventricular filling during diastole, often with severe mitral valve regurgitation in systole (Fig. 22.20). In severe cases, reduced filling of the left ventricle is seen along with left-to-right shunting at the level of the foramen ovale. Pulsed Doppler interrogation of the mitral valve shows, in severe cases, an abnormal monophasic mitral flow pattern with short diastolic filling (Figs. 22.20C and 22.21A). In the five-chamber view, antegrade (often turbulent) flow is found across the severely stenotic but patent aortic valve (Fig. 22.22). Peak velocities across the aortic valve in the second half of gestation are generally high (>200 cm/s) but may also be reduced (between 80 and 200 cm/s). Reduction in systolic peak velocities or aortic regurgitation on follow-up examination can be considered a sign of left ventricular dysfunction (8). Color Doppler at the three-vessel-trachea view can still show antegrade flow during systole and reverse flow in the aortic isthmus in late systole and diastole in severe cases. Figures 22.23 to 22.27 illustrate the deterioration in a fetus presenting with critical aortic stenosis progressing to HLHS within 2 months.
Early Gestation
HLHS can be detected early in gestation (Fig. 22.28) and some may be detected at the early screening at 11 to 14 weeks, but cannot be ruled out at this stage. Cases with a combined mitral and aortic atresia, showing an absence or severely hypoplastic left ventricle, can be detected at 12 weeks or during early second trimester scan (Figs. 22.28 to 22.30). It has also been shown that HLHS can develop between the first and second trimesters, emphasizing that a normal-appearing four-chamber view at the time of nuchal translucency measurement does not rule out the development of HLHS in later gestation. With this caveat, it has been the authors’ experience that the diagnosis of HLHS is possible in early gestation. In one case, however, the presence of a stenotic aortic valve with a normal looking left ventricle at 12 weeks’ gestation progressed into HLHS at 19 weeks’ gestation. This observation has also been reported by other authors (9).
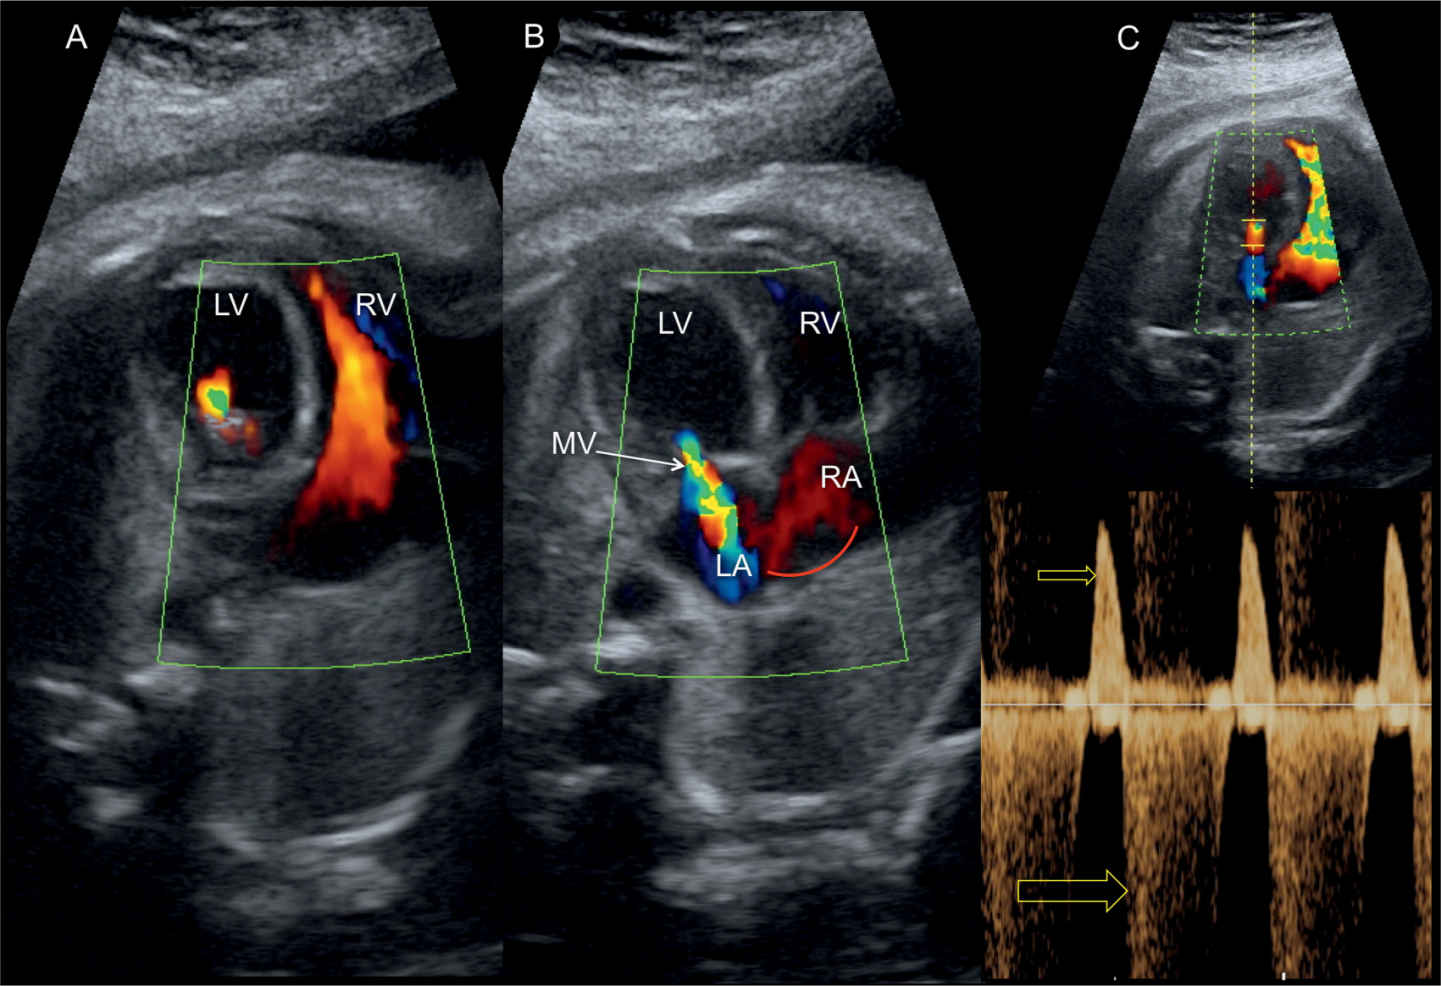
Figure 22.20: Four-chamber view in color (A and B) and pulsed Doppler (C) across the mitral valve (MV) in a fetus with critical aortic stenosis. A shows reduced diastolic filling into the left ventricle (LV) in comparison to the right ventricle (RV). B shows severe mitral regurgitation on color Doppler with left-to-right shunting across the foramen ovale (curved arrow). C demonstrates monophasic mitral inflow in diastole (small arrow) and severe holosystolic mitral regurgitation (large arrow). LA, left atrium; RA, right atrium.
Stay updated, free articles. Join our Telegram channel

Full access? Get Clinical Tree


