Background
Preterm birth (PTB) is a multifactorial disorder, and air pollution has been suggested to increase the risk of occurrence. However, large population studies controlling for multiple exposure measures in high-density settings with established commuter patterns are lacking.
Objective
We performed a geospatial analysis with the use of a publicly available database to identify whether residence during pregnancy, specifically with regard to exposure to traffic density and mobility in urban and suburban neighborhoods, may be a contributing risk factor for premature delivery.
Study Design
In our cohort study, we analyzed 9004 pregnancies with as many as 4900 distinct clinical and demographic variables from Harris County, Texas. On the basis of primary residency and occupational zip code information, geospatial analysis was conducted. Data on vehicle miles traveled (VMT) and percentages of inhabitants traveling to work were collected at the zip code level and additionally grouped by the three recognized regional commuter loop high-density thoroughfares resulting from two interstate/highway belts (inner, middle, and outer loops). PTB was categorized as late (34 1/7 to 36 6/7 weeks) and early PTB (22 1/7 to 33 6/7 weeks), and unadjusted odds ratios (OR) and adjusted ORs were ascribed.
Results
PTB prevalence in our study population was 10.1% (6.8% late and 3.3% early preterm), which is in accordance with our study and other previous studies. Prevalence of early PTB varied significantly between the regional commuter loop thoroughfares [OR for inner vs outer loop: 0.58 (95% confidence interval, 0.39–0.87), OR for middle vs outer loop, 0.74 (0.57–0.96)]. The ORs for PTB and early PTB were shown to be lower in gravidae from neighborhoods with the highest VMT/acre [OR for PTB, 0.82 (0.68–0.98), OR for early PTB, 0.78 (0.62–0.98)]. Conversely, risk of PTB and early PTB among subjects living in neighborhoods with a high percentage of inhabitants traveling to work over a greater distance demonstrated a contrary tendency [OR for PTB, 1.18 (1.03–1.35), OR for early PTB, 1.48 (1.17–1.86)]. In logistic regression models, the described association between PTB and residence withstood and could not be explained by differences in maternal age, gravidity or ethnicity, tobacco use, or history of PTB.
Conclusion
While PTB is of multifactorial origin, the present study shows that community-based risk factors (namely urban/suburban location, differences in traffic density exposure, and need for traveling to work along high–vehicle density thoroughfares) may influence risk for PTB. Further research focusing on previously unrecognized community-based risk factors may lead to innovative future prevention measures.
Preterm birth is a leading cause of neonatal mortality and morbidity and is an important contributor to the global burden of disease. Incidences of preterm birth (PTB) vary remarkably among different countries, exhibiting a PTB rate approximating 11% to 12% in the United States and about 5% to 9% in similarly developed nations. Both short- and long-term sequelae such as respiratory distress, apnea, and kernicterus but also long-term consequences (ie, cerebral palsy, chronic lung disease, and visual impairment) occur frequently in conjunction with PTB and contribute to high incurred cost burdens in care. There are multiple known clinical risk factors for PTB, the most predictive of which is a history of PTB. Measures that have been found to be preventive of PTB include antenatal progesterone administration for the prevention of recurrent PTB,13,19 smoking cessation, and cervical cerclage in limited subject cohorts. However, none of these risk factors (alone or in combination) sufficiently explain the disparity in rates observed among similarly developed nations (ie, prevalence and incidence comparisons between the United States. and others).
Interestingly, exposure to air pollution has been associated with PTB as well as other adverse pregnancy outcomes, and traffic noise (largely a surrogate for ambient exposure measures) has been shown to be associated with lower birth weight. The influence of traffic and traffic-related air pollution on PTB remains controversial. Emissions of hazardous air pollutants from mobile sources and their fuels are termed “Mobile Source Air Toxics (MSATs)” by the EPA. As a general rule, high–population density regions of the United States with significant commuter distances and few mass transit options (eg, train, subway, bus, or bike routes) have significantly higher rates of exposure. Moreover, many of the MSATs are found in combustible tobacco, and maternal smoking is a well-known risk factor for PTB in all populations studied to date.
We hypothesized that geospatial coding in the third most populous county in the United States (Harris County), which also currently lacks a broadly distributed low emission mass transit system, could be used to investigate the potential association between ambient exposures and PTB. Our aim was to describe the effect of ambient traffic exposure on preterm birth by applying geospatial analysis to a county wide health system (Harris Health System, Harris County) with a designated delivery hospital. For this purpose, we used a population-wide emissions database in combination with our robust perinatal database, allowing us to evaluate the presence of vehicular traffic and prevalence of preterm birth in different neighborhoods. As a result of today’s mobility, we considered that inhabitants will be exposed to different traffic density values while both living in and traveling through a community, for example, to work. We therefore used validated measures of traffic densities (ie, in zip code areas or neighborhoods and along thoroughfares), which are approximated by the determination of vehicle miles traveled (VMT) with vehicle traffic counts and road length.
Materials and Methods
Subjects and specimens
For this study, we used PeriBank, a perinatal database curated by Baylor College of Medicine (IRB No. H-26364; H-33382). At the time of admission, gravidae were enrolled by skilled PeriBank personnel after written informed consent was obtained. Up to 4900 variables of clinical data were sought from the electronic medical record, prenatal records, and by in-person interview. The quality of the data was ascertained by regular verification of a subset of the inserted clinical data and by a board-certified maternal-fetal medicine physician scientist (K.A.) as previously published. Clinical data that were extracted for this study comprise the patient history (including smoking status, nicotine and substance use, and familial obstetrical history and prenatal care clinics and providers), socioeconomic status (education, income, immigration status), and residential and workplace data (each trimester of pregnancy residence and workplace 5-digit zip code). Not all 4900 potential PeriBank variables were used in this analysis.
Inclusion criteria
Subjects included in the current study were enrolled in our PeriBank database between August 2011 and December 2014 ( n = 10,812). Exclusion criteria included gravidae with twin pregnancies ( n = 604), pregnancies without delivery at the current hospital ( n = 32), and those missing information on validated zip code information ( n = 648) and/or a residential zip code outside of Harris County ( n = 524).
Data sources for geospatial analysis
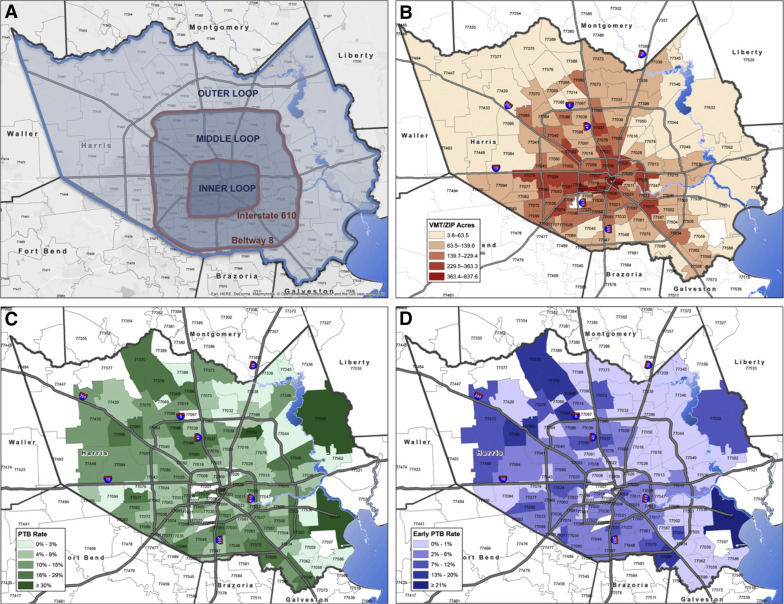
The Environmental Health Service at Baylor College of Medicine provided the dataset on traffic density on zip code basis for Harris County. To calculate traffic densities in different zip codes, vehicle miles of travel (VMT) per acre were determined by measuring the emergence of daily traffic in a road segment and subsequently summing all segments that belong to a zip code ( Figure 1 B). VMT measurements were conducted by the Houston-Galveston Area Council and have been previously validated. To acquire information on percentages of workers of zip code areas in Harris County that commute to work by car, truck, or van, we used a publicly available data source, the “American Fact Finder” of the United States Census Bureau. This database includes information from the 2009–2013 American Community Survey (inclusive of both documented and non-documented residents) and offers estimates on the percentage of workers who commute to work by car, truck, or van for each zip code within Harris County.
Besides the City of Houston, Harris County comprises smaller incorporated townships and cities, such as West University, Bellaire, and Pasadena, and has 230 listed zip codes. Of those, only 132 represent areas of residency, whereas the residual zip codes are company zip codes or post office boxes. In daily life, inhabitants of certain zip codes would cross zip code area borders to conduct their grocery shopping, dining, healthcare appointments, educational and recreational activities, and commuting to work. Because zip code areas of Harris County vary substantially in size, we applied the established “buffer” technique with the aim of establishing comparable residential areas, defined as “neighborhoods.” This validated described approach is commonly used with the aim of calculating various densities (ie, supermarkets, traffic, hospitals) within reach of residence. These neighborhoods consist of the sum of a central zip code and every adjacent zip code it is surrounded by. The described buffer approach has been conducted manually for every single zip code within Harris County, by means of up-to-date zip code maps. This enabled us to estimate traffic exposure within neighborhoods of Harris County.
With the objective of illustrating regional commuter loop thoroughfares, Harris County is subdivided into recognized inner (central-urban) and outer (urban and suburban) areas, reflecting proximity to the city center of Houston. This approach results in three loops, divided by two major highways (Interstate 610 and Beltway 8): inner loop (central-urban core), middle loop (urban), and outer loop (suburban) ( Figure 1 A). These reflect both geographical and common colloquial boundaries, whereby residents are described as living “in the loop.”
“Traffic density” is defined as VMT per acre values of discrete residential areas of Harris County. Throughout the article the term “ambient traffic exposure” is used to reflect the total traffic exposure of individuals living in Harris County, which includes commute distance within the city as well as residence. Therefore the term “ambient traffic exposure” takes into account the condition that an individual can be exposed to several of areas of different traffic densities. Collected information on VMT and percentage of inhabitants traveling to work was allocated to our patients by first trimester residential zip code as a surrogate of total exposure for the duration of the pregnancy.
Statistical analysis
All clinical and demographic data for pregnancies enrolled into our study were obtained from PeriBank. Data processing and statistical analyses of the data was conducted with SPSS (version 22, IBM, New York, NY). Characterization of clinical, demographic and environmental variables was performed with the use of descriptive statistics. Values are given as frequencies or median (interquartile range). We used the Kolmogorov-Smirnov test to examine the distribution of our variables. Because all continuous variables were non-normally distributed, we applied non-parametric statistical tests for bivariate analyses. Crude odds ratios for preterm occurrence in conjunction with environmental variables were calculated. The variables used (ie, VMT) were compared between quartiles (highest vs lowest quartile) and between below versus above median. To identify potentially confounding variables, candidates (as identified on univariate or bivariate analysis) were tested in a multivariate logistic regression model, using forward selection. The following factors were identified as confounders: prior PTB, maternal tobacco use, race/ethnicity, gravidity, and maternal age. For calculating adjusted odds ratios, we subsequently corrected for the confounding variables. For denotation of significance, P < .05 was accepted and values are shown as median (interquartile range, IQR) or as count (percentage), respectively.
Results
Study population
This cohort study on clinical, environmental, and residential data included 9004 subjects (gravidae) from August 2011 through December 2014. Table 1 displays demographic data of our study cohort, stratified by preterm categories. Our study population exhibited a median age of 29.34 years (IQR, 24.36–33.96) and is primarily of white Hispanic origin (69.5%), followed by white, non-Hispanic patients (16.1%), African Americans (10.7%), Asians (3.4%), Hawaiian/Pacific Islanders (0.2%), and Native Americans (0.1%). The majority of our subjects had no high school degree (58.1%), earned less than $34,999 per year (95.2%), and had a median gravidity of 3 (range, 2–4) while being, on average, overweight in the first trimester (median, 27.31 kg/m 2 [23.7–31.62]). Similar to other national estimates, 10.1% of all births were preterm, with 6.8% of those were late PTB, and 3.3% were early PTB. Table 2 summarizes additional clinical information on our patients. Concordant with national estimates, 9.4% of the overall study population had hypertensive disease(s), including preeclampsia (8.6%), with rarity of eclampsia and HELLP (hemolysis, elevated liver enzymes and low platelet count syndrome) (0.1% or less). The majority of subjects delivered vaginally [spontaneous vaginal (72.1%), operative vaginal (1.3%)], with a significant minority of cesarean (26.5%) and rarity of cesarean with hysterectomy (0.2%). Consistent with ours being a primary delivery hospital for our county population, subjects were rarely transported (fewer than 2 per month in total for all indications) with an indication of impending PTB, and the median number of prenatal visits among all subjects was 9 (median IQR, 4–12). As anticipated, although the number of prenatal visits differed by virtue of gestational age attained, there was no significant difference in number of prenatal visits by traffic loop designation or maternal transport status. We found the following differences between preterm and term categories in univariate analysis: maternal age ( P < .001), 1st trimester BMI ( P < .001), and ethnicity ( P = .006), and these were controlled for in multivariate models.
| Total | Preterm | Early preterm | Late preterm | Term | Preterm vs term | Early preterm vs term | Late preterm vs term | Early preterm vs late preterm | |
|---|---|---|---|---|---|---|---|---|---|
| Median (IQR) or % | Significance of difference a | ||||||||
| Number ( n ) | 9004 | 916 | 301 | 615 | 8088 | ||||
| Maternal age (years) | 29.3 (24.4-33.9) | 30.4 (24.6-35.5) | 31.4 (25.8-35.7) | 29.9 (24.2-35.2) | 29.3 (24.3-33.8) | P < .001 | P < .001 | P = .077 | P = .068 |
| Gravidity | 3 (2-4) | 3 (2-4) | 3 (2-5) | 3 (2-4) | 3 (2-4) | P = .063 | P = .02 | P = .792 | P = .048 |
| BMI (1st trimester) | 27.3 (23.7-31.6) | 28.1 (24.7-32.8) | 28.5 (25.0-32.8) | 28.3 (24.6-32.9) | 27.3 (23.6-31.5) | P < .001 | P = .017 | P = .001 | P = .922 |
| Ethnicity (%) | |||||||||
| Hispanic | 69.5% | 68.0% | 64.0% | 70.1% | 69.8% | P = .006 | P = .001 | P = .828 | P = .007 |
| Non-Hispanic | 30.5% | 32.0% | 36.0% | 29.9% | 30.2% | ||||
| African American (%, n ) | 10.7% ( n = 954) | 11.0% ( n = 100) | 10% ( n = 30) | 11.4% ( n = 70) | 10.6% ( n = 854) | P = .773 | P = .715 | P = .550 | P = .514 |
| Education (%) | |||||||||
| Less than high school | 58.1% | 59.8% | 53.5% | 62.6% | 57.9% | P = .214 | P = .702 | P = .078 | P = .129 |
| High school/GED | 27.5% | 25.7% | 31.5% | 23.0% | 27.7% | ||||
| Some college | 6.6% | 8.0% | 7.0% | 8.4% | 6.4% | ||||
| College degree | 5.8% | 4.7% | 5.0% | 4.6% | 5.9% | ||||
| Masters degree | 1.3% | 1.1% | 2.0% | 0.7% | 1.3% | ||||
| PhD or professional degree | 0.8% | 0.8% | 1.0% | 0.7% | 0.8% | ||||
| Income per year | |||||||||
| <$34,999 | 95.2% | 95.3% | 93.6% | 96.2% | 95.2% | P = .664 | P = .645 | P = .487 | P = .330 |
| $35,000-74,999 | 3.1% | 3.3% | 4.1% | 3.0% | 3.1% | ||||
| ≥$75,000 | 1.7% | 1.4% | 2.3% | 0.9% | 1.8% | ||||
a Significance of difference was derived by χ 2 or Kruskal-Wallis/Mann-Whitney U test as appropriate.
| Clinical characteristics | Total | Preterm | Early preterm | Late preterm | No preterm | Preterm vs no preterm | Early preterm vs no preterm | Late preterm vs no preterm | Early preterm vs late preterm |
|---|---|---|---|---|---|---|---|---|---|
| Median (IQR) or % | χ 2 or Kruskal-Wallis/Mann-Whitney U test | ||||||||
| Number ( n ) | 9004 | 916 | 301 | 615 | 8088 | 9004 | 8389 | 8703 | 916 |
| Chorioamnionitis (%) | 0.2% | 0.2% | 0.3% | 0.2% | 0.2% | P = .837 | P = .567 | P = .898 | P = .605 |
| IUGR | 0.7% | 1.6% | 0.7% | 2.1% | 0.6% | P < .001 | P = .898 | P < .001 | P = .104 |
| Hypertensive disease | 9.4% | 10.9% | 9.7% | 11.5% | 9.3% | P < .001 | P < .001 | P < .001 | P = .007 |
| Preeclampsia | 8.6% | 27.9% | 34.8% | 24.5% | 6.4% | ||||
| Eclampsia | 0.1% | 0.1% | 0.3% | 0.5% | 0.1% | ||||
| HELLP syndrome | 0.1% | 0.7% | 1.0% | 0% | 0% | ||||
| Prenatal visits | 9 (4-12) | 6 (0-10) | 4 (0-8) | 8 (2-10) | 10 (5-12) | P < .001 | P < .001 | P < .001 | P < .001 |
| Prior PTB | 0.4% | 1.0% | 2.6% | 0.2% | 0.3% | P = .004 | P < .001 | P = .724 | P = .003 |
| Birthweight, g (range, g) | 3300 (2975-3620) | 2437.5 (1943.8-2828.5) | 1665 (1230-2070) | 2670 (2370-2960) | 3355 (3070-3655) | P < .001 | P < .001 | P < .001 | P < .001 |
| Weight gain category | |||||||||
| Insufficient | 28.4% | 32.8% | 38.9% | 30.0% | 28.0% | P = .006 | P = .001 | P = .660 | P = .017 |
| Goal | 25.0% | 23.3% | 23.8% | 23.2% | 25.1% | ||||
| Excessive | 46.6% | 43.9% | 37.3% | 46.8% | 46.9% | ||||
| PROM | 0.4% | 1.4% | 1.3% | 1.5% | 0.2% | P < .001 | P < .001 | P < .001 | P = .872 |
| Tobacco use | 0.9% | 1.4% | 3.0% | 0.7% | 0.8% | P = .058 | P < .001 | P = .686 | P = .006 |
| Delivery route | |||||||||
| Vaginal | 72.1% | 70.2% | 67.8% | 71.3% | 72.3% | P = .410 | P = .306 | P = .424 | P = .668 |
| Operative vaginal | 1.3% | 1.0% | 1.3% | 0.8% | 1.3% | ||||
| Cesarean | 26.5% | 28.5% | 30.6% | 27.5% | 26.3% | ||||
| Cesarean hysterectomy | 0.2% | 0.3% | 0.3% | 0.3% | 0.1% | ||||
VMT measures and percentage of inhabitants traveling to work
Table 3 demonstrates the VMT per acre distribution within neighborhoods and zip code areas of Harris County, as well as percentages of inhabitants traveling to work. Additionally, Table 3 provides information on the amount of patients (in percentage) living in the three different loops of Harris County. Less than 5% relocated during their pregnancy, as determined by patient-provided zip code data for both work and residence by each trimester. Traffic density, measured in VMT per acre, is highest in the inner loop of Harris County, which embraces the city center (downtown Houston and the Texas Medical Center, which independently employs approximately 150,000 individuals ). The middle loop has less traffic density and the same is true for the outer loop, meaning that VMT decreases significantly when traveling from the city center toward suburban areas of Harris County (245.02 vs 186.64 vs 122.16 VMT per acre; P < .001). A contrary trend can be observed in the percentage of inhabitants traveling to work by car, van or truck. Significantly more inhabitants travel to work in the outer ( P < .001) and middle loops ( P < .001) when compared with the inner loop. There is a single mass transit service (Metro Line), which connects downtown Houston to the Texas Medical Center but does not service the middle or outer loop nor residential communities. In addition, the metropolitan bus service largely connects middle and inner loop communities ( http://www.ridemetro.org/Pages/SchedulesBusRail.aspx ).


