Background
Preeclampsia (PE) affects 2-3% of all pregnancies and is a major cause of maternal and perinatal morbidity and mortality. We have proposed a 2-stage strategy for the identification of pregnancies at high risk of developing PE. The objective of the first stage, at 11–13 weeks’ gestation, is a reduction in the prevalence of the disease through pharmacological intervention in the high-risk group. The objective of the second stage, during the second and/or third trimesters, is to improve perinatal outcome through close monitoring of the high-risk group for earlier diagnosis of the clinical signs of the disease and selection of the appropriate, time, place, and method of delivery.
Objective
The objective of the study was to examine the performance of screening for PE by a combination of maternal factors with early third-trimester biomarkers.
Study Design
This was a cohort study and data were derived from consecutive women with singleton pregnancies attending for their routine hospital visit at 30–34 weeks’ gestation in 3 maternity hospitals in England between March 2011 and December 2014. In the first phase of the study, only uterine artery pulsatility index (UTPI) was measured and then measurement of mean arterial pressure (MAP) was added, and in the final phase, the serum concentration of placental growth factor (PLGF) was measured and then soluble fms-like tyrosine kinase-1 (SFLT) was added. We had data on UTPI, MAP, PLGF, and SFLT from 30,935, 29,042, 10,123, and 8,264 pregnancies, respectively. The Bayes theorem was used to combine the a priori risk from maternal factors with various combinations of biomarker multiple of the median values. Ten-fold cross-validation was used to estimate the performance of screening for PE requiring delivery at < 37 weeks’ gestation (preterm-PE) and those delivering at ≥ 37 weeks (term-PE). The empirical performance was compared with model predictions.
Results
In pregnancies that developed PE, the values of MAP, UTPI, and SFLT were increased and PLGF was decreased. For all biomarkers the deviation from normal was greater for preterm-PE than term-PE, and therefore, the performance of screening was inversely related to the gestational age at which delivery become necessary for maternal and/or fetal indications. Combined screening by maternal factors, MAP, UTPI, PLGF, and SFLT predicted 98% (95% confidence interval, 88–100%) of preterm-PE and 49% (95% confidence interval, 42–57%) of term-PE, at a false-positive rate of 5%. These empirical detection rates are compatible with the respective model-based rates of 98% and 54%, but the latter were optimistically biased.
Conclusion
Combination of maternal factors and biomarkers in the early third trimester could predict nearly all cases of preterm-PE and half of those with term-PE, at 5% false-positive rate.
Preeclampsia (PE) affects 2-3% of all pregnancies and is a major cause of maternal and perinatal morbidity and mortality. The objectives of screening for PE are first to reduce the prevalence of the disease through pharmacological intervention in the high-risk group identified in the first trimester of pregnancy and second to minimize adverse perinatal events for those who develop PE by determining the appropriate time and place for delivery. The second objective can be potentially achieved through screening in the second and/or the third trimester of pregnancy.
The traditional approach to screening for PE is to use a risk-scoring system based on maternal demographic characteristics and medical history (maternal factors). However, the performance of such an approach, which essentially treats each risk factor as a separate screening test with additive detection rate (DR) and screen-positive rate, is poor.
Similarly, studies have investigated the potential value of biomarkers in predicting PE by examining the proportion of affected and unaffected pregnancies exceeding a cutoff in the measurement of such biomarkers. An alternative approach to screening, which allows estimation of individual patient-specific risks of PE is to use the Bayes theorem to combine the a priori risk from maternal factors, derived by a multivariable logistic model, with the results of various combinations of biophysical and biochemical markers. However, the measured levels of biomarkers depend on variables from maternal characteristics and medical history and for their effective use in risk assessment and screening. these covariates need to be taken into account; this can be achieved by standardizing biomarker levels into multiples of the normal median (MoM) values.
We have previously reported that first-trimester screening by a combination of maternal factors with MoM values of mean arterial pressure (MAP), uterine artery pulsatility index (UTPI), and serum placental growth factor (PLGF) could predict 65% of preterm PE and 33% of term PE, at a 5% false-positive rate (FPR). Screening at 19–24 weeks by the maternal factors, MAP, UTPI, and PLGF, improved the DR of preterm PE to about 75%, but the DR of term PE remained at 33%.
There is some evidence that the prediction of both preterm PE and term PE is improved by screening in the early third trimester than at 19–24 weeks. We have previously reported on the development of a model of screening for PE by a combination of MAP, UTPI, PLGF, and serum soluble fms-like tyrosine kinase-1 (SFLT) at 32 weeks, but the performance of screening was assessed by simulating from the fitted model and such approach is generally optimistically biased because it ignores errors of estimation and departures from the assumed model.
The objective of this study of singleton pregnancies with data on MAP, UTPI, PLGF, and SFLT at 30–34 weeks’ gestation was to examine the potential improvement in performance of screening by maternal factors along with the addition of each biomarker and combinations of biomarkers. In the estimates of performance of screening, empirical results are compared with model-based rates.
Materials and Methods
Study design and participants
This was a cohort study and data were derived from consecutive women with singleton pregnancies during their routine hospital visit at 30 +0 to 34 +6 weeks’ gestation in 3 maternity hospitals in England (King’s College Hospital between March 2011 and December 2014, University College London Hospital between December 2011 and November 2013, and Medway Maritime Hospital between November 2011 and August 2014).
In the first phase of the study, only the UTPI was measured and then the measurement of MAP was added, and in the final phase, serum concentration of PLGF was measured and then SFLT was added. The inclusion criteria, which were the same throughout the study, were singleton pregnancy delivering a nonmalformed live birth or stillbirth at ≥ 24 weeks’ gestation. We excluded pregnancies with aneuploidies and major fetal abnormalities and those ending in termination, miscarriage, or fetal death at < 24 weeks.
The left and right UTPIs were measured by transabdominal color Doppler ultrasound and the mean pulsatility index was calculated. Measurements of MAP were obtained by validated automated devices and a standardized protocol. Measurement of serum concentration of PLGF and SFLT were by an automated biochemical analyzer within 10 minutes of blood sampling (Cobas e411 system; Roche Diagnostics, Penzberg, Germany). The interassay coefficients of variation for low and high concentrations were 5.4% and 3.0% for PlGF and 3.0% and 3.2% for SFLT, respectively.
Gestational age was determined from measurement of fetal crown-rump length at 11–13 weeks or the fetal head circumference at 19–24 weeks. The women gave written informed consent to participate in the study, which was approved by the National Health Service Research Ethics Committee.
Outcome measures
Data on pregnancy outcome were collected from the hospital maternity records or the general medical practitioners of the women. The obstetric records of all women with preexisting or pregnancy-associated hypertension were examined to determine whether the condition was PE or pregnancy-induced hypertension, as defined by the International Society for the Study of Hypertension in Pregnancy. Outcome measures were PE delivering at < 37 weeks’ gestation (preterm-PE) and at ≥ 37 weeks (term-PE). The unaffected group contained all pregnancies without PE or pregnancy-induced hypertension.
Statistical analyses
Performance of screening was assessed first by examining the empirical results in 7927 pregnancies with complete data on MAP, UTPI, PLGF, and SFLT, second by examining the empirical results using all available data for each biomarker, and third by modeling, whereby values on biomarkers were simulated for our 123,406 singleton pregnancies with available data on maternal factors.
In selecting the second option, we wanted to have the maximum possible data for developing the models and examining performance of the various biomarkers; for example, in examining UTPI, we could use data from 30,935 pregnancies, rather than just 7927. However, the distribution of maternal factors was not identical in each subset used for the assessment of each biomarker or their combinations; consequently, there were differences between the data sets in the maternal factor–related performance of screening, and it was therefore difficult to compare meaningfully the additional contribution to performance between biomarkers and their combinations over and above that of maternal factors alone. To overcome this problem we obtained modeled estimates of performance by sampling biomarker multiple of the normal median values from the fitted multivariate log Gaussian distribution in the large data set of 123,406 pregnancies.
Competing risks model
This model assumes that if the pregnancy were to continue indefinitely, all women would develop PE, and whether they do so before a specified gestational age depends on competition between delivery for PE or for other reasons. The effect of each maternal factor is to modify the mean of the distribution of gestational age at delivery with PE so that in pregnancies at low risk for PE the gestational age, distribution is shifted to the right with the implication that in most pregnancies delivery will actually occur for other reasons before development of PE. In high-risk pregnancies, the distribution is shifted to the left and the smaller the mean gestational age the higher is the risk for PE.
The distribution of biomarkers is specified conditionally on the gestational age at delivery with PE. For any women with specific maternal factors and biomarker MoM, the posterior distribution of the time to delivery with PE is obtained from the application of the Bayes theorem.
Gestational age at delivery with PE was defined by 2 components: first, the prior distribution based on maternal factors and second, the conditional distribution of MoM biomarker values given the gestational age with PE and maternal factors. Values of MAP, UTPI, PLGF, and SFLT were expressed as MoMs adjusting for those characteristics found to provide a substantive contribution to their values, including the maternal factors in the prior model.
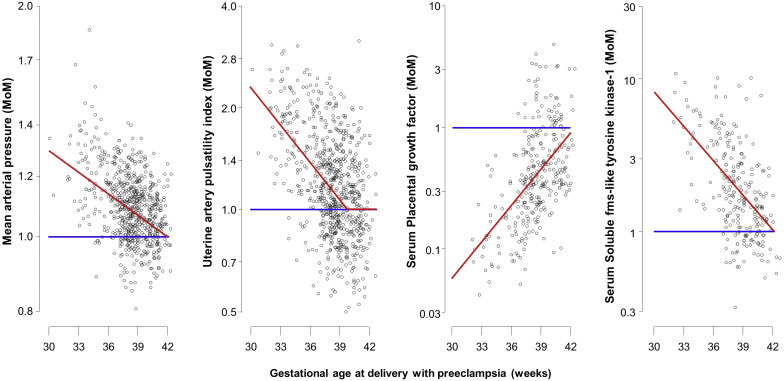
In the PE group, the mean log 10 MoM was assumed to depend linearly with gesational age at delivery, and this linear relationship was assumed to continue until the mean log 10 MoM of zero, beyond which the mean was taken as zero; this assumption was confirmed by the empirical results shown in Figure 1 . Multivariable Gaussian distributions were fitted to the log 10 MoM values of the biomarkers and a common covariance matrix was assumed for these distributions. Analysis of residuals was used to check the adequacy of the model and assess the effects of maternal factors on log 10 -transformed MoM values in pregnancies with PE.
Empirical performance of screening
Ten-fold cross-validation was used to assess the empirical performance of screening for PE by maternal factors and the combination of maternal factors with biomarkers. The data were divided into 10 equal subgroups, and the model was then fitted 10 times to different combinations of 9 of the 10 subgroups and used to predict risk of PE in the remaining tenth of the data. In each case, the maternal factor model, the regression models, and the covariance matrix were fitted to the training data set comprising nine tenths on the data and used to produce risks for the hold out sample comprising the remaining tenth of the data. The positive and negative likelihood ratios for PE with delivery at < 37 and ≥ 37 weeks’ gestation were calculated.
Model-based estimates of screening performance
To provide model-based estimates of screening performance, the following procedure was adopted. First, we obtained the dataset of 123,406 singleton pregnancies, including 2748 (2.2%) with PE, that was previously used to develop a model for PE based on maternal demographic characteristics and medical history.
Second, for each case of PE (n = 2748) and pregnancies unaffected by PE or PIH (n = 117,710), the biophysical and biochemical MoM values were simulated from the fitted multivariate Gaussian distribution for log-transformed MoM values.
Third, risks were obtained using the competing risk model from the simulated MoM values and the pregnancy characteristics. These 3 steps were applied to the pregnancies within the unaffected group with no restriction on the time of delivery.
Fourth, for a given FPR, risks from the unaffected group were used to define a risk cutoff. The proportion of PE risks was then used to obtain an estimate of the associated DR. The area under the receiver-operating characteristic curve was also calculated. The simulations were repeated 100 times to reduce variability due to the simulation process and provide suitably precise model-based estimates of performance.
Performance of biomarkers without adjustment for maternal factors
The 90th and 95th percentiles for UTPI, MAP, and SFLT and the 10th and fifth percentiles for PLGF were derived from the measurements of these biomarkers in unaffected pregnancies without conversion to MoM values. The performance of screening for PE was estimated using these percentile cutoffs.
The statistical software package R was used for data analyses. The survival package was used for fitting the maternal factors model and the package pROC was used for the receiver-operating characteristic curve analysis.
Results
Characteristics of the study population
The characteristics of the pregnancies with data on MAP, UTPI, PLGF, and SFLT are given in Supplemental Table 1 , those of the 7927 pregnancies with complete data on UTPI, MAP, PLGF, and SFLT are given in Supplemental Table 2 , and those of the total population of 123,406 pregnancies with maternal factors are given in Supplemental Table 3 .
Distribution of biomarkers
The distributions of log 10 MoM values of the biomarkers in unaffected pregnancies and in those who developed PE are shown in Supplemental Tables 4 and 5 . In the unaffected group, the median MoM value is 1.0 and on the log scale, the distribution of MoM values is very well approximated by a Gaussian distribution with mean zero. The MoM values in the PE group and the fitted regression relationships with gestational age at delivery are shown in Figure 1 . All markers showed more separation at earlier than later gestations and this is reflected in their superior performance at detection of preterm PE than term PE.
The distribution of measurements of biomarkers without adjustment for maternal factors is shown in the Supplemental Figure . The 90th and 95th percentiles for MAP were 96.9 and 100.0 mm Hg, and the respective values for UTPI were 1.03 and 1.17 and for SFLT were 3187 and 3887 pg/mL. The 10th and fifth percentiles for PLGF were 206.3 and 150.6 pg/mL, respectively.
Performance of screening for preeclampsia
Empirical and model-based performance of screening for PE by maternal factors and combinations of biomarkers are shown in Tables 1-3 , Supplemental Table 6 , and Figures 2 and 3 . The empirical performance of screening of all available data ( Table 1 ) is compatible with the performance in the 7927 pregnancies with complete data ( Supplemental Table 6 ), but in the latter, the confidence intervals are wider because of fewer data.
| Method of screening | Preeclampsia at < 37 wks | Preeclampsia at ≥ 37 wks | ||||||
|---|---|---|---|---|---|---|---|---|
| History | Combined | History | Combined | |||||
| n/N | DR, % (95% CI) | n/N | DR, % (95% CI) | n/N | DR, % (95% CI) | n/N | DR %, (95% CI) | |
| False-positive rate, 5% | ||||||||
| Maternal factors | 61/179 | 34 (27, 42) | 61/179 | 34 (27, 42); 34 | 169/555 | 30 (27, 34) | 169/555 | 30 (27, 34); 27 |
| MAP | 42/136 | 31 (23, 39) | 98/136 | 72 (64, 79); 79 | 148/509 | 29 (25, 33) | 197/509 | 39 (34, 43); 36 |
| UTPI | 55/166 | 33 (26, 41) | 105/166 | 63 (55, 71); 70 | 165/540 | 31 (27, 35) | 172/540 | 32 (28, 36); 27 |
| PLGF | 16/56 | 29 (17, 42) | 44/56 | 79 (66, 88); 86 | 64/240 | 27 (21, 33) | 95/240 | 40 (33, 46); 41 |
| SFLT | 13/47 | 28 (16, 43) | 39/47 | 83 (69, 92); 91 | 57/196 | 29 (23, 36) | 75/196 | 38 (31, 45); 40 |
| MAP, UTPI | 36/126 | 29 (21, 37) | 100/126 | 79 (71, 86); 88 | 144/495 | 29 (25, 33) | 197/495 | 40 (35, 44); 37 |
| MAP, PLGF | 16/54 | 30 (18, 44) | 50/54 | 93 (82, 98); 93 | 62/238 | 26 (21, 32) | 110/238 | 46 (40, 53); 47 |
| MAP, SFLT | 13/45 | 29 (16, 44) | 41/45 | 91 (79, 98); 95 | 56/194 | 29 (23, 36) | 88/194 | 45 (38, 53); 47 |
| UTPI, PLGF | 15/52 | 29 (17, 43) | 43/52 | 83 (70, 92); 91 | 62/236 | 26 (21, 32) | 97/236 | 41 (35, 48); 42 |
| UTPI, SFLT | 13/44 | 30 (17, 45) | 38/44 | 86 (73, 95); 94 | 55/192 | 29 (22, 36) | 74/192 | 39 (32, 46); 41 |
| PLGF, SFLT | 13/47 | 28 (16, 43) | 43/47 | 91 (80, 98); 96 | 57/196 | 29 (23, 36) | 99/196 | 51 (43, 58); 50 |
| MAP, UTPI, PLGF | 15/52 | 29 (17, 43) | 49/52 | 94 (84, 99); 95 | 60/234 | 26 (20, 32) | 110/234 | 47 (40, 54); 47 |
| MAP, UTPI, SFLT | 13/44 | 30 (17, 45) | 40/44 | 91 (78, 97); 97 | 54/190 | 28 (22, 35) | 86/190 | 45 (38, 53); 48 |
| MAP, PLGF, SFLT | 13/45 | 29 (16, 44) | 42/45 | 93 (82, 99); 97 | 56/194 | 29 (23, 36) | 104/194 | 54 (46, 61); 48 |
| UTPI, PLGF, SFLT | 13/44 | 30 (17, 45) | 40/44 | 91 (78, 97); 97 | 55/192 | 29 (22, 36) | 95/192 | 49 (42, 57); 50 |
| MAP, UTPI, PLGF, SFLT | 13/44 | 30 (17, 45) | 43/44 | 98 (88, 99); 98 | 54/190 | 28 (22, 35) | 104/190 | 55 (47, 62); 54 |
| False-positive rate, 10% | ||||||||
| Maternal factors | 80/179 | 45 (37, 52) | 80/179 | 45 (37, 52); 47 | 228/555 | 41 (37, 45) | 228/555 | 41 (37, 45); 37 |
| MAP | 59/136 | 43 (35, 52) | 109/136 | 80 (72, 86); 87 | 207/509 | 41 (36, 45) | 266/509 | 52 (48, 57); 49 |
| UTPI | 72/166 | 43 (36, 51) | 127/166 | 77 (69, 83); 79 | 224/540 | 41 (37, 46) | 229/540 | 42 (38, 47); 39 |
| PLGF | 22/56 | 39 (26, 53) | 52/56 | 93 (83, 98); 92 | 90/240 | 38 (31, 44) | 124/240 | 52 (45, 58); 55 |
| SFLT | 19/47 | 40 (26, 56) | 44/47 | 94 (82, 99); 95 | 75/196 | 38 (31, 45) | 100/196 | 51 (44, 58); 53 |
| MAP, UTPI | 51/126 | 40 (32, 50) | 106/126 | 84 (77, 90); 93 | 202/495 | 41 (36, 45) | 267/495 | 54 (49, 58); 50 |
| MAP, PLGF | 22/54 | 41 (28, 55) | 52/54 | 96 (87, 99); 96 | 88/238 | 37 (31, 43) | 144/238 | 61 (54, 67); 60 |
| MAP, SFLT | 19/45 | 42 (28, 58) | 42/45 | 93 (82, 99); 98 | 73/194 | 38 (31, 45) | 114/194 | 59 (51, 66); 59 |
| UTPI, PLGF | 20/52 | 38 (25, 53) | 47/52 | 90 (79, 97); 95 | 88/236 | 37 (31, 44) | 129/236 | 55 (48, 61); 55 |
| UTPI, SFLT | 18/44 | 41 (26, 57) | 41/44 | 93 (81, 99); 97 | 75/192 | 39 (32, 46) | 102/192 | 53 (46, 60); 54 |
| PLGF, SFLT | 19/47 | 40 (26, 56) | 47/47 | 100 (92,100); 98 | 75/196 | 38 (31, 45) | 123/196 | 63 (56, 70); 62 |
| MAP, UTPI, PLGF | 20/52 | 38 (25, 53) | 50/52 | 96 (87, 100); 97 | 86/234 | 37 (31, 43) | 142/234 | 61 (54, 67); 60 |
| MAP, UTPI, SFLT | 18/44 | 41 (26, 57) | 43/44 | 98 (88, 99); 99 | 72/190 | 38 (31, 45) | 115/190 | 61 (53, 68); 60 |
| MAP, PLGF, SFLT | 19/45 | 42 (28, 58) | 44/45 | 98 (88, 99); 99 | 73/194 | 38 (31, 45) | 129/194 | 66 (59, 73); 60 |
| UTPI, PLGF, SFLT | 18/44 | 41 (26, 57) | 43/44 | 98 (88, 99); 99 | 75/192 | 39 (32, 46) | 118/192 | 61 (54, 68); 62 |
| MAP, UTPI, PLGF, SFLT | 18/44 | 41 (26, 57) | 43/44 | 98 (88, 99); 99 | 72/190 | 38 (31, 45) | 124/190 | 65 (58, 72); 66 |
| Method of screening | Preeclampsia at < 37 wks | Preeclampsia at ≥ 37 wks | ||
|---|---|---|---|---|
| LR positive (95% CI) | LR negative (95% CI) | LR positive (95% CI) a | LR negative (95% CI) a | |
| False positive rate 5% | ||||
| Maternal factors | 6.8 (5.6, 8.4) | 1.4 (1.3, 1.6) | 6.1 (5.4, 6.9) | 1.4 (1.3, 1.4) |
| MAP | 14.4 (12.8, 16.2) | 3.4 (2.6, 4.5) | 7.7 (6.9, 8.7) | 1.5 (1.4, 1.7) |
| UTPI | 12.7 (11.2, 14.3) | 2.6 (2.1, 3.2) | 6.4 (5.6, 7.3) | 1.4 (1.3, 1.5) |
| PLGF | 15.7 (13.4, 18.5) | 4.4 (2.7, 7.3) | 7.9 (6.6, 9.5) | 1.6 (1.4, 1.7) |
| SFLT | 16.6 (14.1, 19.5) | 5.6 (3.0, 10.5) | 7.7 (6.2, 9.4) | 1.5 (1.4, 1.7) |
| MAP, UTPI | 15.9 (14.3, 17.6) | 4.6 (3.3, 6.5) | 8.0 (7.1, 9.0) | 1.6 (1.5, 1.7) |
| MAP, PLGF | 18.5 (16.5, 20.8) | 12 (5.0, 32.9) | 9.2 (7.8, 10.9) | 1.8 (1.6, 2.0) |
| MAP, SFLT | 18.2 (16, 20.8) | 10.7 (4.2, 27.2) | 9.1 (7.6, 10.9) | 1.7 (1.5, 2.0) |
| UTPI, PLGF | 16.5 (14.2, 19.2) | 5.5 (3.0, 9.9) | 8.2 (6.9, 9.8) | 1.6 (1.4, 1.8) |
| UTPI, SFLT | 17.3 (14.8, 20.1) | 7.0 (3.3, 14.7) | 7.7 (6.3, 9.5) | 1.5 (1.4, 1.7) |
| PLGF, SFLT | 18.3 (16.1, 20.8) | 11.2 (4.4, 28.5) | 10.1 (8.5, 12) | 1.9 (1.7, 2.2) |
| MAP, UTPI, PLGF | 18.8 (16.9, 21.1) | 16.5 (5.5, 49.4) | 9.4 (8.0, 11.1) | 1.8 (1.6, 2.0) |
| MAP, UTPI, SFLT | 18.2 (15.9, 20.8) | 10.4 (4.1, 26.6) | 9.1 (7.5, 10.9) | 1.7 (1.5, 2.0) |
| MAP, PLGF, SFLT | 18.7 (16.5, 21.1) | 14.2 (4.8, 42.5) | 10.7 (9.1, 12.6) | 2.0 (1.8, 2.4) |
| UTPI, PLGF, SFLT | 18.2 (15.9, 20.8) | 10.4 (4.1, 26.6) | 9.9 (8.3, 11.8) | 1.9 (1.6, 2.2) |
| MAP, UTPI, PLGF, SFLT | 19.5 (17.6, 21.8) | 41.8 (6.0, 290.2) | 10.9 (9.3, 12.9) | 2.1 (1.8, 2.5) |
| False positive rate 10% | ||||
| Maternal factors | 4.5 (3.8, 5.3) | 1.6 (1.4, 1.9) | 4.1 (3.7, 4.5) | 1.5 (1.4, 1.6) |
| MAP | 8.0 (7.3, 8.8) | 4.5 (3.2, 6.4) | 5.2 (4.8, 5.7) | 1.9 (1.7, 2.1) |
| UTPI | 7.7 (7.0, 8.4) | 3.8 (2.9, 5.0) | 4.2 (3.8, 4.7) | 1.6 (1.5, 1.7) |
| PLGF | 9.3 (8.5, 10.2) | 12.6 (4.9, 32.4) | 5.2 (4.5, 5.9) | 1. (1.6, 2.1) |
| SFLT | 9.4 (8.5, 10.3) | 14. (4.7, 42.1) | 5.1 (4.4, 5.9) | 1.8 (1.6, 2.1) |
| MAP, UTPI | 8.4 (7.7, 9.1) | 5.7 (3.8, 8.5) | 5.4 (4.9, 5.9) | 2.0 (1.8, 2.1) |
| MAP, PLGF | 9.6 (8.9, 10.4) | 24.3 (6.2, 94.7) | 6.1 (5.4, 6.8) | 2.3 (1.9, 2.7) |
| MAP, SFLT | 9.3 (8.4, 10.3) | 13.5 (4.5, 40.3) | 5.9 (5.1, 6.7) | 2.2 (1.8, 2.6) |
| UTPI, PLGF | 9.0 (8.1, 10.1) | 9.4 (4.1, 21.5) | 5.5 (4.8, 6.2) | 2.0 (1.7, 2.3) |
| UTPI, SFLT | 9.3 (8.4, 10.3) | 13.2 (4.4, 39.4) | 5.3 (4.6, 6.2) | 1.9 (1.7, 2.2) |
| PLGF, SFLT | 10 (9.4, 10.7) | (5.4, ∞) | 6.3 (5.5, 7.1) | 2. (2.0, 2.9) |
| MAP, UTPI, PLGF | 9.6 (8.9, 10.4) | 23.4 (6.0, 91.1) | 6.1 (5.4, 6.8) | 2.3 (2.0, 2.7) |
| MAP, UTPI, SFLT | 9.5 (8.7, 10.5) | 19.8 (5.1, 76.7) | 5.9 (5.2, 6.8) | 2.2 (1.9, 2.6) |
| MAP, PLGF, SFLT | 9.8 (9, 10.6) | 40.5 (5.8, 281.3) | 6.6 (5.9, 7.5) | 2.7 (2.2, 3.3) |
| UTPI, PLGF, SFLT | 9.8 (9, 10.6) | 39.6 (5.7, 274.9) | 6.1 (5.4, 7.0) | 2.3 (2.0, 2.8) |
| MAP, UTPI, PLGF, SFLT | 9.8 (9, 10.6) | 39.6 (5.7, 274.9) | 6.5 (5.8, 7.4) | 2.6 (2.1, 3.1) |
a The odds ratio for PE is increased by the positive LR and decreased by the negative LR.
| Method of screening | Areas under the receiver operating characteristic curve | |||
|---|---|---|---|---|
| PE < 37 wks | PE ≥ 37 wks | |||
| Empirical (95% CI) | Model | Empirical (95% CI) | Model | |
| Maternal factors | 0.784 (0.751, 0.817) | 0.796 | 0.750 (0.729, 0.771) | 0.752 |
| MAP | 0.927 (0.906, 0.949) | 0.954 | 0.812 (0.793, 0.832) | 0.809 |
| UTPI | 0.896 (0.869, 0.924) | 0.928 | 0.759 (0.738, 0.780) | 0.759 |
| PLGF | 0.967 (0.950, 0.983) | 0.972 | 0.819 (0.791, 0.847) | 0.834 |
| SFLT | 0.970 (0.952, 0.988) | 0.981 | 0.808 (0.776, 0.841) | 0.825 |
| MAP, UTPI | 0.945 (0.924, 0.966) | 0.975 | 0.818 (0.798, 0.838) | 0.812 |
| MAP, PLGF | 0.984 (0.973, 0.995) | 0.985 | 0.851 (0.826, 0.876) | 0.854 |
| MAP, SFLT | 0.980 (0.964, 0.997) | 0.991 | 0.844 (0.813, 0.874) | 0.851 |
| UTPI, PLGF | 0.967 (0.946, 0.988) | 0.981 | 0.819 (0.791, 0.847) | 0.834 |
| UTPI, SFLT | 0.976 (0.959, 0.993) | 0.989 | 0.810 (0.777, 0.843) | 0.828 |
| PLGF, SFLT | 0.987 (0.980, 0.994) | 0.992 | 0.848 (0.819, 0.878) | 0.862 |
| MAP, UTPI, PLGF | 0.981 (0.964, 0.997) | 0.990 | 0.851 (0.826, 0.876) | 0.854 |
| MAP, UTPI, SFLT | 0.982 (0.964, 0.999) | 0.994 | 0.844 (0.813, 0.874) | 0.853 |
| MAP, PLGF, SFLT | 0.990 (0.983, 0.997) | 0.994 | 0.867 (0.839, 0.894) | 0.853 |
| UTPI, PLGF, SFLT | 0.988 (0.981, 0.995) | 0.995 | 0.847 (0.817, 0.877) | 0.862 |
| MAP, UTPI, PLGF, SFLT | 0.990 (0.982, 0.998) | 0.996 | 0.865 (0.838, 0.893) | 0.875 |
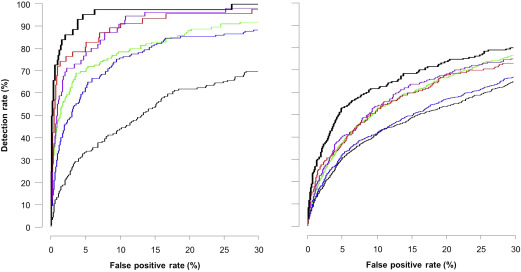
The empirical DRs are also compatible with the model-based rates, but the latter are optimistically biased ( Table 1 ). Table 2 provides the positive and negative likelihood ratios (LRs) for preterm PE and term PE. The area under the receiver-operating characteristic curve curves for prediction of PE and model-based results are shown in Table 3 . Figure 2 shows the receiver-operating characteristic curves for empirical prediction of PE by maternal factors, combination of maternal factors with each biomarker, and all biomarkers. Figure 3 shows the empirical performance of screening for PE by the combination of maternal factors with all available data on biomarkers; the empirical results are compatible with the model-based results.
The performance of screening for preterm PE and term PE by individual biomarkers using percentile cutoffs from unadjusted measurements, compared with our approach of combining the prior risk from maternal factors with biomarker MoM values is shown in Table 4 ; in general, the DR from combined screening was higher, particularly for term PE.
| Method of screening | Preeclampsia at < 37 wks | Preeclampsia at ≥ 37 wks | ||
|---|---|---|---|---|
| n/N | % (95% CI) | n/N | % (95% CI) | |
| False-positive rate, 5% | ||||
| MAP > 95th percentile | 89/136 | 65 (57, 73) | 164/509 | 32 (28, 36) |
| Maternal factors plus MAP MoM | 98/136 | 72 (64, 79) | 197/509 | 39 (34, 43) |
| UTPI > 95th percentile | 90/166 | 54 (46, 62) | 75/540 | 14 (11, 17) |
| Maternal factors plus UTPI MoM | 105/166 | 63 (55, 71) | 172/540 | 32 (28, 36) |
| PLGF < fifth percentile | 43/56 | 77 (64, 87) | 59/240 | 25 (19, 31) |
| Maternal factors plus PLGF MoM | 44/56 | 79 (66, 88) | 95/240 | 40 (33, 46) |
| SFLT > 95th percentile | 39/47 | 83 (69, 92) | 50/196 | 26 (20, 32) |
| Maternal factors plus SFLT MoM | 39/47 | 83 (69, 92) | 75/196 | 38 (31, 45) |
| False-positive rate, 10% | ||||
| MAP > 90th percentile | 107/136 | 79 (71, 85) | 222/509 | 44 (39, 48) |
| Maternal factors plus MAP MoM | 109/136 | 80 (72, 86) | 266/509 | 52 (48, 57) |
| UTPI > 90th percentile | 113/166 | 68 (60, 75) | 75/540 | 14 (11, 17) |
| Maternal factors plus UTPI MoM | 127/166 | 77 (69, 83) | 229/540 | 42 (38, 47) |
| PLGF < 10th percentile | 49/56 | 88 (76, 95) | 99/540 | 41 (35, 48) |
| Maternal factors plus PLGF MoM | 52/56 | 93 (83, 98) | 124/240 | 52 (45, 58) |
| SFLT > 90th percentile | 39/47 | 83 (69, 92) | 50/196 | 26 (20, 32) |
| Maternal factors plus SFLT MoM | 44/47 | 94 (82, 99) | 100/196 | 51 (44, 58) |
Stay updated, free articles. Join our Telegram channel

Full access? Get Clinical Tree


