Background
Antenatal steroids are standard of care for cases of anticipated preterm labor to improve neonatal outcomes. However, steroids are potent drugs, and their use in pregnancy remains largely unoptimized.
Objective
The objective of the study was to measure the maternofetal pharmacokinetics of constant, low-dose intravenous betamethasone phosphate infusions and correlate these data with the transcriptional effect exerted by subclinical betamethasone exposures on the ovine fetal lung.
Study Design
Thirty-two ewes carrying a single fetus had surgery to catheterize fetal and maternal jugular veins at 116 days of gestation (term, 150 days). Animals were recovered for 2 days and then were randomized to receive 2 sequential maternal intravenous infusions of either (n = 4/group) of the following: 1) saline, 0.125, 0.04, or 0.0125 mg/kg betamethasone phosphate over 3 hours; or 2) saline, 0.25, 0.08, or 0.025 mg/kg betamethasone phosphate over 12 hours. Each infusion was separated by 2 days. Fetal lung tissue was collected for analysis using quantitative polymerase chain reaction and an ovine-specific microarray. Plasma betamethasone levels from time-course catheter samples were determined by mass spectrometry. Data were assessed for distribution, variance, and tested by an analysis of variance.
Results
Betamethasone was detectable (>1 ng/mL) in fetal plasma only in animals randomized to 0.125 mg/kg 3 hour or 0.250 mg/kg 12 hour infusions. Fetal betamethasone half-lives were 1.7–2.8 times greater than maternal values. At maximum concentration, fetal plasma betamethasone levels were approximately 10% of maternal levels. Compared with saline control, all animals, other than those receiving 0.0125 mg/kg 3 hour betamethasone phosphate infusions, had evidence of dose-dependent glucocorticoid transcriptional responses in the fetal lung.
Conclusion
Constant maternal betamethasone infusions delivering substantially lower fetal and maternal betamethasone maximal concentrations than those achieved with current clinical treatment protocols were associated with dose-dependent changes in glucocorticoid-response markers in the fetal lung. Further studies to determine the minimally efficacious dose of steroids for improving outcomes in preterm infants should be viewed as a priority.
The use of antenatal steroids to precociously mature the fetal lung in cases of expectant preterm birth (delivery before 37 weeks’ gestation) is among the most important advances in perinatal medicine to date. Worldwide, more than 15 million babies are born preterm every year, and, of those, more than 1 million will die. First clinically studied in a trial in New Zealand, following experimental studies with sheep, antenatal steroid therapy was shown to reduce both neonatal death and a suite of comorbidities including respiratory distress syndrome and cerebral hemorrhage in premature babies delivered between 24 and 34 weeks of gestation.
The following 2 drug formulations are in common clinical use in expectation of preterm delivery : (1) a dual formulation of betamethasone phosphate and betamethasone acetate, administered as a course of 2, 12 mg intramuscular injections 24 hours apart; and (2) dexamethasone phosphate, administered as a course of 4, 6 mg intramuscular injections 12 hours apart. Betamethasone and dexamethasone have similar pharmacokinetic properties; the combined betamethasone phosphate and acetate dosing regimen used by Liggins and Howie achieved a maximum fetal plasma betamethasone concentration of approximately 20 ng/mL 1–2 hours after treatment.
Steroids are both highly potent and broad-acting drugs that have regulatory effects on as much as 20% of the genome. Antenatal steroids can perturb a wide range of homeostatic systems including insulin signalling, and the catabolic effects of antenatal steroids are associated with increases in maternal and fetal plasma amino acid concentrations. A number of investigators have expressed concern regarding aspects of antenatal steroid use in pregnancy, specifically with regard to a lack of dose optimization and the use of repeated courses of antenatal steroids when delivery occurs more than 7 days after treatment.
Importantly, the extent to which current antenatal steroid dosing regimens are optimal for safely inducing fetal lung maturation remains unclear. Antenatal steroids are not Food and Drug Administration approved for this use in pregnancy, and there has been comparatively little work undertaken to refine the optimal dosing. Moreover, there is no modification of antenatal steroid dosing to take into account pregnancy factors (ie, gestational age, maternal weight) that almost certainly have an impact on the magnitude and duration of fetal steroid exposure.
Although the long-term effects on humans are unclear, fetal growth restriction from antenatal steroid exposure has been demonstrated in numerous animal models including sheep and mice. Sustained exposures to large quantities of antenatal steroids have been linked to changes in fetal fluid composition, placental morphology, and alterations in brain development. Kutzler et al have reported that multiple courses of low-dose maternal dexamethasone (4 2 mg doses at 12 hour intervals) decreased birthweight and brain weight, although these changes did not persist at 2 weeks of postnatal life.
Data from animal studies suggest that efforts to optimize antenatal steroid dosing are warranted. Jobe et al, for example, reported that fetal sheep have increased responsiveness to antenatal steroids with increasing gestational age and that multiple antenatal steroid doses may yield a decreased benefit with increasing gestation. Loehle et al demonstrated that administering 50% of the clinical dose of betamethasone elicits maximal improvement in lung compliance (measured by pressure-volume curve) in fetal sheep at 0.75 gestation. Subsequent work, again in the sheep model, demonstrated that minimal fetal betamethasone exposures deriving from maternal betamethasone acetate injections were associated with lung maturation comparable with that with the clinical antenatal steroid dosing.
Materials and Methods
The present study was designed to inform preclinical animal studies to allow the optimization of antenatal steroid dosing for expectant preterm deliveries. Aiming to lower peak fetal betamethasone exposure, we used an extended intravenous administration protocol to deliver set doses of betamethasone to achieve a lower maternal and fetal maximum concentration than with intramuscular administration.
The two primary objectives were to investigate the feasibility of delivering a weight-calibrated subclinical dose of antenatal steroids to the mother and fetus and to measure maternofetal betamethasone pharmacokinetics. A secondary objective was to correlate these data with evidence of fetal lung maturation as measured by transcriptional changes markers of glucocorticoid signaling response. These studies were undertaken using a well-validated sheep model of pregnancy.
Study design
Animal work
All protocols were reviewed and approved by the University of Western Australia’s Animal Ethics Committee (RA/3/100/1378). All animal work was conducted in accordance with the guidelines set out in the National Health and Medical Research Council‘s Australian code for the care and use of animals for scientific purposes.
Thirty-two date-mated ewes carrying singleton fetuses at 116 days of gestational age (term, approximately 150 days) were acclimatized to a large animal surgical facility for 10 days before undergoing a recovery surgical procedure of 50 minutes in duration to place bilateral maternal jugular and unilateral fetal jugular catheters as previously described. There were no interoperative fetal losses.
Animals were recovered for 2 days before being randomized to receive 2 sequential maternal intravenous infusions of either (n = 4/group) of the following: (1) saline, 0.125, 0.04, or 0.0125 mg/kg betamethasone phosphate over 3 hours; or (2) saline, 0.25, 0.08, or 0.025 mg/kg betamethasone phosphate over 12 hours. Each infusion was separated by 2 days. Infusions were delivered with an ambulatory CADD infusion pump (Smiths Medical, St Paul, MN) attached to the unrestrained ewe’s back, with each infusion commencing at 8:00 am . The total volume infused for all groups was 90 mL of betamethasone phosphate diluted in sterile saline.
Betamethasone phosphate dosing was designed such that the highest dose, 0.25 mg/kg, was approximately equivalent to the dose received by a 50 kg woman receiving antenatal steroid therapy with a combined betamethasone phosphate and betamethasone acetate preparation, such as Celestone Chronodose (Merck & Co, Inc, Kenilworth, NJ); stepped-down doses were chosen to allow for the titration of a potential dose response in lung maturation. Two milliliters of maternal and fetal blood samples were collected into chilled K 3 EDTA vacutainers at T-minus 10 minutes and then 1, 2, 3, 4, 6, 8, 10, 12, 14, 15, and 24 hours. Separate maternal catheters were used for infusions and sample collection. Samples were centrifuged at 3000 × g , and the cleared plasma frozen –80°C for the subsequent analysis.
All animals were euthanized with intravenous pentobarbitone (160 mg/kg) immediately after the conclusion of their second infusion, and the fetus delivered for necroscopy. Fetal lung tissue (right lower lobe) was dissected and snap frozen in liquid nitrogen before being stored at –80°C for quantitative polymerase chain reaction and microarray analysis.
Measurement of plasma betamethasone by mass spectrometry
Plasma samples and betamethasone standards (500, 250, 100, 50, 25, 12, and 0 ng/mL) in control fetal sheep plasma were extracted as follows: 50 μL sample or standard was added to 50 μL of internal standard (deuterated betamethasone, 50 ng/mL), vortexed in a sealed tube for 10 seconds and then incubated at room temperature for 5 minutes. One milliliter of methyl-tert-butyl ether was added before samples were vortexed in sealed tubes for 2 minutes and then centrifuged at 3000 rpm for 10 minutes at room temperature. A total of 850 μL of cleared sample was transferred to an autosampler vial, dried under vacuum at 3000 rpm for 40 minutes at 37°C, and reconstituted in 70 μL of a 1:1 solution of methanol plus 0.1% formic acid in H 2 O. Samples were capped, incubated with gentle shaking for 10 minutes at 50°C, and then analyzed. Data were fitted to a 1-compartment model with PKSOLVER. All R 2 values were >0.98.
Measurement of transcript expression changes in the fetal lung
Quantitative polymerase chain reaction was used to compare the relative expressions of epithelial sodium channel subunits α, β, and ɣ; surfactant protein-A, -B, -C, and -D; and aquaporin-4 and -5. Briefly, samples of fetal lung tissue (right lower lobe) were homogenized for 0.5 minutes at 6500 rpm, with a Precellys 24 homogenizer. Sample cooling during homogenization was provided by a Precellys Cyro-lyse unit (both Bertin Technologies, Montigny-le-Bretonneux, France).
Total ribonuclease acid was extracted using TRIzol (Life Technologies, Carlsbad, CA) in accordance with the manufacturer’s instructions. Contaminating DNA was removed with Turbo-DNAse (Life Technologies) treatment, in accordance with the manufacturer’s instructions. The concentration of extracted ribonuclease acid was determined using a broad-range ribonuclease acid quantitation kit and a Qubit 2.0 fluorometer (both Life Technologies). All ribonuclease acid extracts were diluted in nuclease-free water (Life Technologies) to achieve a final concentration of 25 ng/μL.
Cycling was performed with an EXPRESS One-Step SuperScript quantitative reverse transcription polymerase chain reaction kit and ovine-specific polymerase chain reaction primers and hydrolysis probes in fast 96 well quantitative polymerase chain reaction plates. A total of 125 ng of template ribonuclease acid in a total reaction volume of 20 μL was added to each well. Reactions were performed on a ViiA7 real-time polymerase chain reaction thermocycler (Life Technologies). Cycling conditions were as follows: 15 minutes of reverse transcription at 50 o C; an initial denaturation at 95 o C for 20 seconds, followed by 40 cycles of 95 o C for 3 seconds; and a hold at 60 o C for 30 seconds to allow data acquisition. All quantification cycle values were normalized to the relevant 18s ribosomal ribonuclease acid quantification cycle values and expressed as fold changes relative to pooled saline control values. All statistical analyses were performed on Delta quantification cycle values.
Microarray analysis of total messenger ribonuclease acid from fetal lung right lower lobe was as performed previously. Prior to analysis, all ribonuclease acid samples underwent quality control assessment for purity and integrity and had a RNA integrity number value of between 8.2 and 9.5. For each sample, 100 ng of total ribonuclease acid was amplified using a WTPlus kit (Affymetrix, Santa Clara, CA) following the manufacturer’s instructions. Then 3.5 μg of fragmented, biotin-labeled, single-stranded DNA was hybridized in an Affymetrix hybridization oven at 60 rpm per 45°C for 16 hours in accordance with the manufacturer’s instructions.
Arrays were washed and stained on a GeneChip Fluidics Station 450 and scanned on a GeneChip 3000 7G scanner and using GeneChip Command Console Software (all Affymetrix), following the manufacturer’s instructions. Microarray data were preprocessed using the robust multiarray average algorithm, background correction, quartile normalization, and gene-level probe set summation.
Changes in fetal lung gene expression between the following groups were identified by univariate class comparison analysis with a significance threshold set at 0.01 using BRB-ArrayTools version 4.4 software developed by Dr Richard Simon and the BRB-ArrayTools Development Team : (1) 0.125 mg/kg 3 hour betamethasone phosphate vs saline control; (2) 0.04 mg/kg betamethasone phosphate 3 hour vs saline control; and (3) 0.0125 mg/kg 3 hour betamethasone phosphate vs saline control.
Gene networks were generated by Ingenuity Pathway Analysis software (QIAGEN, Redwood City, CA). Post hoc quantitative polymerase chain reaction was performed on samples from the 0.125 mg/kg 3 hour betamethasone phosphate and saline control groups to confirm transcript expression levels identified by microarray.
Five targets were selected for analysis: ACSL6 (accession, XM_012178141.1; left primer, cggagcttgcctgttacac; right primer, ggcccagggtgtcatatagag; probe identification, 77), ADAM17 (accession, XM_004005676.3; left primer, acaggtaacagcagcgagtg; right primer, caggcacacggtgtcatc; probe identification, 79), ALDH1A1 (accession, NM_001009778.1; left primer, ttgaatttgcacaccaagga; right primer, cgggatgcagctatacaaca; probe identification, 81), HSD11B1 (accession, NM_001009395.2; left primer, cgaccaaggtcaatgtgtca; right primer, atggctgtgtctgtgtcgat; probe identification, 142); and MATN2 (accession, XM_004011822.3; left primer, ccacgaggaccacgtctt; right primer, actgaggtcagcgtctcaatc; probe identification, 49) Reactions were performed on samples submitted for microarray analysis (n = 4/group) using the Roche Universal Probe Library (Roche Diagnostics Australia Pty Ltd, Sydney, New South Wales, Australia), in accordance with the manufacturer’s instructions.
Statistical analysis
For microarray data, significant pathway interactions were determined by Ingenuity Pathway Analysis (QIAGEN) with a network overlap value of P < .01 taken as significant. Activation or inhibition z-scores were taken as significant at >2 or <–2, respectively. All other statistical analyses were performed using IBM SPSS for Windows, version 20.0 (IBM Corp, Armonk, NY). One-way t tests were performed on Delta quantification cycle values to test the mean differences between 0.125 mg/kg 3 hour betamethasone phosphate and saline control groups confirmatory quantitative polymerase chain reaction data for ACSL6 , MATN2 , HSD11B1 , ALDH1A1 , and ADAM17 expression. For all other data, a one-way analysis of variance was used to test differences between the normally distributed groups, with multiple post hoc comparisons were performed with a Tukey’s test. A value of P < .05 was accepted as significant.
Results
Animal studies
Thirty of 32 animals successfully completed their respective protocols. One fetus from the 0.0125 mg/kg per 12 hour group and 1 fetus from the 12 hour saline control group died in utero after the commencement of the first infusion. All other fetuses were healthy and well developed at delivery. There were no significant differences ( P < .05) in birthweight, cord blood pH, or lung weight between groups. Necroscopy data for each group are presented in Table 1 .
| Group | Completed protocol, % | Birthweight, kg | Delivery GA | Male, % | Cord blood pH a | Cord blood pCO 2 a | Lung weight, g/kg |
|---|---|---|---|---|---|---|---|
| Saline | 87.5 | 2.5 ± 0.2 | 119.9 ± 0.9 | 60 | 7.1 ± 0.1 | 80.1 ± 10.9 | 30.3 ± 3.1 |
| 0.25 mg/kg 12 h | 100 | 2.5 ± 0.2 | 120.3 ± 0.5 | 100 | 7.1 ± 0.0 | 81.2 ± 5.2 | 32.1 ± 3.3 |
| 0.125 mg/kg 3 h | 100 | 2.8 ± 0.2 | 122.5 ± 1.0 | 80 | 7.2 ± 0.1 | 85.4 ± 4.3 | 32.7 ± 3.3 |
| 0.08 mg/kg 12 h | 100 | 2.3 ± 0.2 | 120.3 ± 0.5 | 50 | 7.3 ± 0.3 | 81.1 ± 14.9 | 33.4 ± 3.6 |
| 0.04 mg/kg 3 h | 100 | 2.7 ± 0.4 | 121.8 ± 0.5 | 30 | 7.1 ± 0.0 | 77.6 ± 4.7 | 35.3 ± 1.6 |
| 0.025 mg/kg 12 h | 100 | 2.4 ± 0.2 | 121.3 ± 0.5 | 50 | 7.1 ± 0.1 | 99.9 ± 16.4 | 37.2 ± 1.3 |
| 0.0125 mg/kg 3 h | 75 | 2.2 ± 0.2 | 120.0 ± 0.0 | 0 | 7.2 ± 0.0 | 75.3 ± 5.9 | 33.9 ± 0.5 |
a pH and pCO 2 values reflect the delay between euthanasia of ewe and fetus, surgical delivery, and blood sampling.
Betamethasone measurements
The limit of detection for our assay was 1 ng/mL in maternal plasma, with a signal to noise ratio of >10:1. A conservative cutoff of 1.3 ng/mL (30% greater than the technical limit of detection) was used as a zero point for all analyses. R 2 values for all calibration curves were >0.98. Four quality control samples were run in duplicate across the experiment to determine assay precision, yielding coefficients of variation of 3.5%, 5.6%, 4.3%, and 3.9%, respectively, indicative of a robust assay. Five to 6 unique samples were assayed for each time point in each infusion group.
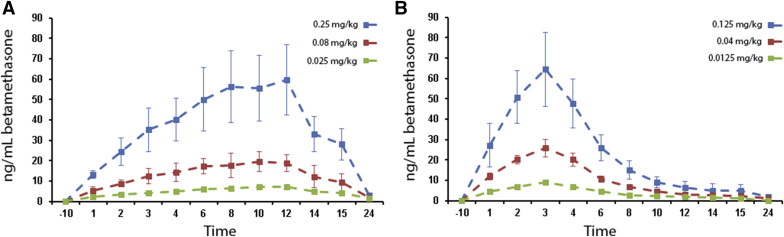
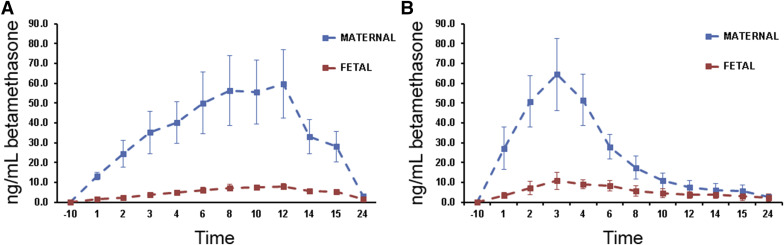
Betamethasone was detected in maternal samples from all betamethasone phosphate infusion groups; betamethasone was consistently detected only in fetal samples from the 0.25 mg/kg 12 hour (maximum concentration, 8.2 ng/mL at 12 hours) and 0.125 mg/kg 3 hour (maximum concentration, 10.4 ng/mL at 3 hours) groups. When detectable, fetal betamethasone maximum concentration was approximately 10% of maternal values and fetal half-lives were 1.7–2.8 times longer than equivalent maternal values. Basic pharmacokinetic parameters for betamethasone distribution in each group are presented in Table 2 . Maternal betamethasone concentration data are presented in Figure 1 . Fetal betamethasone concentration data vs relevant maternal betamethasone concentration data are presented in Figure 2 .
| Parameter | Unit | Maternal | Fetal | ||||||
|---|---|---|---|---|---|---|---|---|---|
| 12 h infusion | 3 h infusion | 12 h infusion | 3 h infusion | ||||||
| 0.25 mg/kg | 0.08 mg/kg | 0.025 mg/kg | 0.125 mg/kg | 0.04 mg/kg | 0.0125 mg/kg | 0.25 mg/kg | 0.125 mg/kg | ||
| t½ | Hour | 2.60 | 2.52 | 3.02 | 2.42 | 2.60 | 3.29 | 4.34 | 6.71 |
| CL | Milliliter per hour per kilogram | 340 | 321 | 260 | 370 | 280 | 216 | 2200 | 1072 |
| T max | Hour | 12.0 | 12.0 | 12.0 | 3.0 | 3.0 | 3.0 | 12.0 | 3.0 |
| C max | Nanograms per milliliter | 59.29 | 20.02 | 7.51 | 64.63 | 26.24 | 9.05 | 8.24 | 10.37 |
| Vd | Milliliter per kilogram | 1300 | 1170 | 1131 | 1300 | 1050 | 1024 | 13510 | 10370 |
| AUC 0-t | Nanograms per milliliter hour | 732.71 | 246.74 | 94.15 | 335.93 | 142.69 | 54.51 | 108.38 | 105.20 |
| MRT | Hour | 3.75 | 3.64 | 4.35 | 3.49 | 3.75 | 4.74 | 6.27 | 9.68 |
Quantitative polymerase chain reaction analysis of changes in lung transcript expression
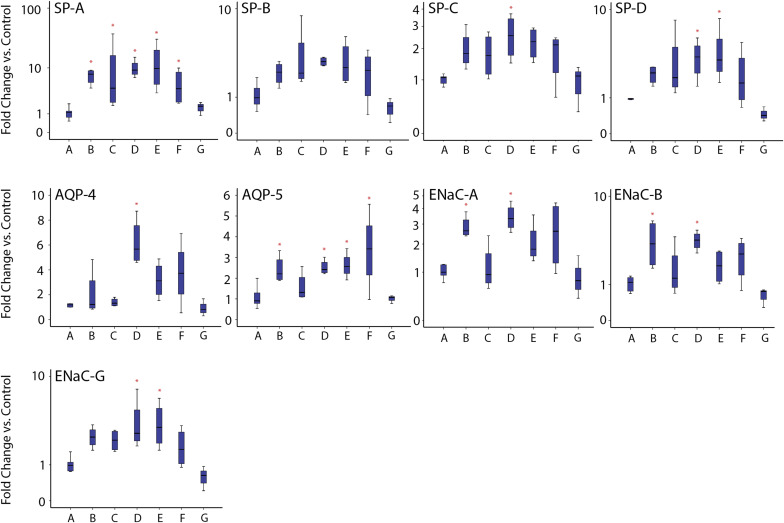
Relative to saline control, significant increases in 1 or more transcripts associated with fetal lung maturation were identified in all treatment groups apart from the 0.0125 mg/kg 3 hour betamethasone phosphate group. The relative increases in marker expression were comparable with previous studies using maternal intramuscular steroid injections. SP-A was the most consistently up-regulated transcript. The 0.25 mg/kg 12 hour and 0.08 mg/kg 12 hour groups had the most consistent transcript up-regulation of the 6 betamethasone infusion groups. The summary box and whisker plots for quantitative polymerase chain reaction studies are presented in Figure 3 .
Microarray analysis of changes in lung transcript expression
Array data have been deposited with the National Center for Biotechnology Information under series entry GSE87151. Relative to saline control, 940 targets in the 0.125 mg/kg 3 hour betamethasone phosphate group, 405 targets in the 0.04 mg/kg 3 hour betamethasone phosphate group and 313 targets in the 0.0125 mg/kg 3 hour betamethasone phosphate group were differentially regulated. There was a 60% agreement in the top 10 up-regulated and down-regulated transcripts between 0.125 mg/kg 3 hour and 0.04 mg/kg 3 hour betamethasone phosphate animals and a 20% agreement in the top 10 up-regulated and down-regulated transcripts between the 0.125 mg/kg 3 hour and 0.0125 mg/kg 3 hour betamethasone phosphate animals ( Table 3 ).
| Gene symbol | Fold change vs saline control | Function | Location | ||
|---|---|---|---|---|---|
| 0.125 mg/kg | 0.04 mg/kg | 0.0125 mg/kg | |||
| SFTPA1 | 5.60 | 4.64 | — | Collectin | Extracellular space |
| LYVE1 | 3.87 | 3.94 | — | Transmembrane receptor | Plasma membrane |
| ACSL6 | 2.45 | 2.4 | — | Enzyme | Cytoplasm |
| PI15 | 2.34 | — | — | Peptidase inhibitor | Extracellular space |
| GBP7 | 2.31 | — | — | Enzyme | Cytoplasm |
| SLC6A12 | 2.29 | 2.24 | 2.17 | Transporter | Plasma membrane |
| ADCYAP1R1 | 2.15 | — | — | G-protein coupled receptor | Plasma membrane |
| AQP9 | 2.11 | 2.07 | 1.73 | Transporter | Plasma membrane |
| MACC1 | 2.09 | — | — | Transcription regulator | Nucleus |
| ARHGAP15 | 2.07 | 1.77 | — | Rho GTPase activator | Cytoplasm |
| ABHD3 | 2.06 | 1.79 | — | Phospholipase | Plasma membrane |
| ADAMDEC1 | 2.05 | — | — | Peptidase | Extracellular space |
| SLC7A11 | 1.98 | 1.52 | — | Transporter | Plasma membrane |
| SRGN | 1.97 | — | — | Proteoglycan | Cytoplasm |
| SLCO1B3 | 1.94 | 1.89 | 2.1 | Transporter | Plasma membrane |
| GPR160 | 1.91 | 1.66 | — | G-protein coupled receptor | Plasma membrane |
| LPCAT2 | 1.91 | — | — | Acyltransferase | Cytoplasm |
| AADAC | 1.88 | — | — | Deacetylase | Cytoplasm |
| FMO2 | 1.87 | — | — | Enzyme | Cytoplasm |
| ACSL5 | 1.86 | 1.51 | — | Acyl-CoA synthetase | Cytoplasm |
| CCDC141 | 1.82 | — | — | Centrosome localisation | Cytoplasm |
| SCGB2A2 | 1.79 | — | — | Transporter | Extracellular space |
| KLF9 | 1.76 | — | — | Transcription regulator | Nucleus |
| STRA13 | 1.75 | — | — | DNA repair | Nucleus |
| SLC41A2 | 1.73 | — | — | Transporter | Plasma Membrane |
| DPYS | 1.71 | — | 1.69 | Enzyme | Cytoplasm |
| SCNN1G | 1.68 | — | — | Ion channel | Plasma membrane |
| POR | 1.67 | 1.72 | 1.66 | Enzyme | Cytoplasm |
| PTN | 1.67 | — | — | Growth factor | Extracellular space |
| HSD17B11 | 1.66 | — | — | Enzyme | Cytoplasm |
| Gene symbol | Fold change vs saline control | Function | Location | ||
|---|---|---|---|---|---|
| 0.125 mg/kg | 0.04 mg/kg | 0.0125 mg/kg | |||
| HMGB3 | –2.857 | –1.961 | — | Transcription regulator | Nucleus |
| SFRP2 | –2.439 | –1.818 | –2.128 | Transmembrane receptor | Plasma membrane |
| KCNB2 | –2.326 | — | — | Ion channel | Plasma membrane |
| TNC | –2.222 | — | — | Extracellular matrix | Extracellular space |
| COL6A6 | –2.083 | –1.887 | Cell binding | Extracellular space | |
| CHODL | –2.000 | — | — | Carbohydrate binding | Plasma membrane |
| C8orf34 | –1.961 | –1.786 | –2.041 | ORF | Other |
| LECT1 | –1.923 | -2 | — | Growth factor | Extracellular space |
| CRISPLD1 | –1.852 | –1.587 | — | Undefined | Cytoplasm |
| DBX2 | –1.852 | — | — | Transcription regulator | Nucleus |
| EPPK1 | –1.852 | — | — | Cytoskeleton | Cytoplasm |
| CHST14 | –1.786 | — | — | Enzyme | Nucleus |
| HOXA3 | –1.786 | — | — | Transcription regulator | Cytoplasm |
| BMP2 | –1.754 | — | — | Growth factor | Extracellular space |
| NLGN4Y | –1.724 | — | — | Enzyme | Nucleus |
| YPEL1 | –1.724 | –1.471 | — | Enzyme | Plasma membrane |
| ARL4C | –1.695 | –1.449 | — | Enzyme | Nucleus |
| ARSB | –1.695 | — | — | Enzyme | Nucleus |
| HBA1 | –1.695 | — | — | Transporter | Plasma membrane |
| NKAIN1 | –1.695 | — | — | Neuron development | Extracellular space |
| SNAI1 | –1.695 | — | — | Transcription regulator | Cytoplasm |
| ZNF704 | –1.695 | — | — | Undefined | Nucleus |
| CAGE1 | –1.667 | — | — | Transcription regulator | Nucleus |
| KCTD1 | –1.667 | — | — | Transcription regulator | Nucleus |
| MYOCD | –1.667 | –1.754 | Transcription regulator | Other | |
| NAV2 | –1.639 | — | — | Neuron development | Plasma membrane |
| SAMD1 | –1.639 | — | — | LDL binding | Nucleus |
| SPHKAP | –1.639 | — | — | A-kinase-anchoring protein | Cytoplasm |
| TEAD2 | –1.639 | –1.449 | — | Transcription regulator | Other |
| THY1 | –1.639 | –1.351 | — | Cell binding | Nucleus |
Stay updated, free articles. Join our Telegram channel

Full access? Get Clinical Tree


