Maintenance of ATP levels
Carbohydrate metabolism
Carbohydrates are the only fuels that can be respired anaerobically and, moreover, glucose represents the most accessible energy source for many cells and tissues, most notably the brain and the erythrocyte.
Forms of Carbohydrate
Dietary carbohydrate can be ingested in a wide variety of forms, ranging from simple mono- or disaccharides to huge polymers (polysaccharides) that contain hundreds or thousands of monosaccharide residues (Table 9.1). The mono- and disaccharides provide the body with readily available glucose and their ingestion produces a rapid increase in blood glucose level. By contrast, glucose polymers, which are most abundant in the form of storage compounds such as plant starches or animal glycogen (Table 9.1), take much longer to be digested.
| Carbohydrate | Monosaccharide components | Source |
|---|---|---|
| MONOSACCHARIDES | ||
| Glucose | Glucose | Fruit, honey |
| Fructose | Fructose | Fruit, honey |
| DISACCHARIDES | ||
| Lactose (milk sugar) | Glucose, galactose | Milk |
| Sucrose (table sugar) | Glucose, fructose | Cane sugar, prepared foods |
| TRISACCHARIDES | ||
| Trehalose | Glucose | Mushrooms |
| POLYSACCHARIDES | ||
| Amylose | Glucose (linear) | Plant starch |
| Amylopectin | Glucose (branched) | Plant starch |
| Glycogen | Glucose (branched) | Meat |
One way or another, all dietary carbohydrate can be converted to glucose. When glucose is removed from the blood because of its consumption by tissues, it is quickly replenished by breakdown of hepatic glycogen or by synthesis via hepatic gluconeogenesis.
Overview of Glucose Metabolism
Glucose is a versatile fuel: not only can it be consumed by all tissues, but it can also be respired anaerobically, unlike fats or proteins. Aerobic and anaerobic respiration of glucose share the initial pathway of glycolysis in the cytosol. In the absence of O2, glycolysis leads to the conversion of 1 mole of glucose to 2 moles of lactate. This conversion brings about the formation of ATP via substrate-level phosphorylation and the production of the reduced co-factor nicotinamide adenine dinucleotide (NADH).
Aerobic respiration continues in the mitochondrion with the tricarboxylic acid (TCA) cycle and the electron transport chain and results in the complete oxidation of the glucose molecule to its combustion products, CO2 and H2O:
Anaerobic Metabolism
All glucose metabolism begins with the anaerobic cytosolic pathway of glycolysis (Figure 9.2). The pathway converts the six-carbon glucose molecule into two molecules of the three-carbon compound pyruvate, with the net production of 2 moles of ATP per mole of glucose by substrate-level phosphorylation.
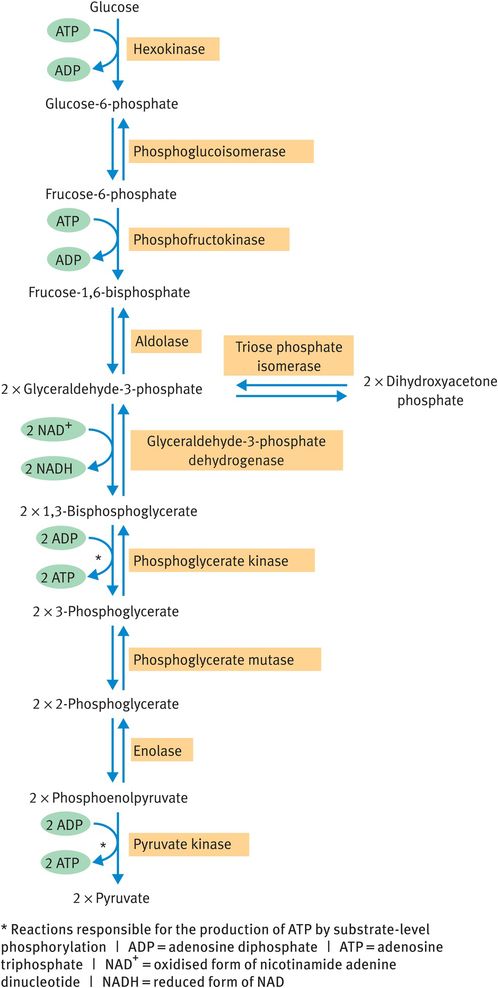
Glycolysis
Under anaerobic conditions, pyruvate is reduced to lactate (Figure 9.3). Indeed, the appearance of lactate in the bloodstream is often used as an indicator of the occurrence of anaerobic respiration. The molecule represents a metabolic dead end: the body has no use for lactate other than to reconvert it to pyruvate. However, production of lactate from pyruvate by lactate dehydrogenase results in the regeneration of oxidised nicotinamide adenine dinucleotide (NAD+) from NADH. This step is vital for the continued operation of glycolysis under anaerobic conditions because NAD+ is a co-factor for the oxidation of glyceraldehyde-3-phosphate (Figure 9.2) and cytosolic supplies of NAD+ are limited.
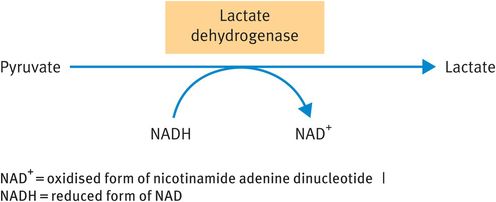
Reduction of pyruvate to lactate
The glycolytic pathway can be reversed to bring about synthesis of glucose from noncarbohydrate sources (gluconeogenesis) in the liver. When this occurs, the irreversible reactions in Figure 9.2 (unidirectional arrows) must be bypassed by separate reactions catalysed in the reverse direction, whereas the reactions denoted by double arrows may be freely reversed.
Aerobic Metabolism: Pyruvate Dehydrogenase Reaction and Tricarboxylic Acid Cycle
Under aerobic conditions, the product of the glycolytic pathway is pyruvate, which becomes the substrate for the remaining steps of the oxidative metabolism that take place within the mitochondrion. The three-carbon pyruvate molecule is converted to the two-carbon acetyl coenzyme A (CoA) molecule by the enzyme pyruvate dehydrogenase (PDH), in a reaction that produces NADH. Acetyl CoA is then consumed by the TCA cycle (Figure 9.4) and converted to two molecules of CO2. The cycle also produces three molecules of NADH, one molecule of the reduced form of flavin adenine dinucleotide (FADH2) and one molecule of guanosine triphosphate (GTP) per turn (Table 9.2). The reduced co-factors NADH and FADH2 pass their electrons along the electron transport chain to elicit ATP synthesis and GTP may be converted to ATP.
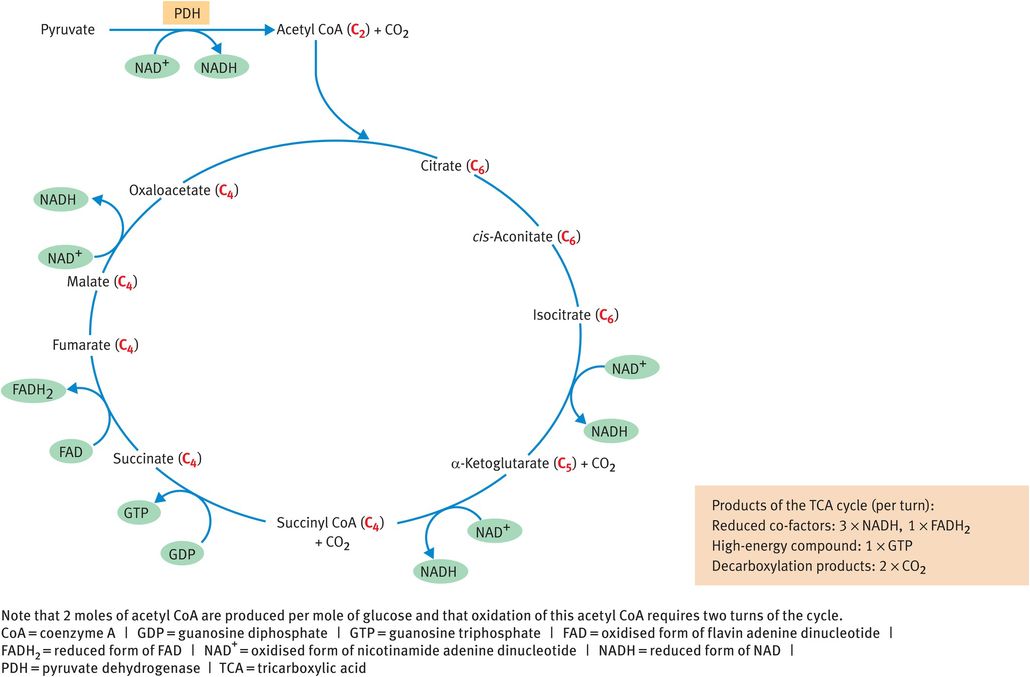
Tricarboxylic acid cycle
| Reduced co-factors produced (moles per mole glucose) | Route of ATP synthesis | Resulting ATP yielda (moles per mole glucose) |
|---|---|---|
| GLYCOLYSIS | ||
| Substrate-level phosphorylation | 2 ATP | |
| 2 NADH b | Oxidative phosphorylation | 5 ATP |
| PDH REACTION | ||
| 2 NADH | Oxidative phosphorylation | 5 ATP |
| TCA CYCLE | ||
| Substrate-level phosphorylation c | 2 ATP | |
| 6 NADH | Oxidative phosphorylation | 15 ATP |
| 2 FADH2 | Oxidative phosphorylation | 3 ATP |
The blue bracket shows the scope of anaerobic respiration, the red bracket that of aerobic respiration;
a estimated from empirical data;
b NADH generated in the cytosol must be shuttled into the mitochondrion;
c substrate-level phosphorylation during the succinyl coenzyme A synthetase reaction produces guanosine triphosphate, which can be used to synthesise ATP. | FADH2 = reduced form of flavin adenine dinucleotide | NADH = reduced form of nicotinamide adenine dinucleotide | PDH = pyruvate dehydrogenase | TCA = tricarboxylic acid
The PDH reaction, which links the anaerobic and aerobic pathways, is irreversible and cannot be bypassed in the reverse direction. Thus, no pathway exists for the conversion of acetyl CoA into pyruvate. Moreover, while two carbon atoms enter the TCA cycle in the form of acetyl CoA, two carbon atoms are lost as CO2, meaning that there is no net gain of carbon by any TCA cycle intermediate. Thus, there is no pathway for the synthesis of glucose from acetyl CoA. These observations achieve significance during starvation.
ATP Yield from Glucose
Aerobic respiration produces 30–32 moles of ATP per mole of glucose, compared with 2 moles of ATP obtained during anaerobic respiration. This means that aerobic respiration of glucose is 15–16 times more efficient than anaerobic respiration. Table 9.2 illustrates how the ATP yield is derived.
Quoted yields of ATP vary considerably from text to text. Some sources put ATP yields at 30–32 moles for aerobic respiration, others at 36–38 moles. This discrepancy represents more than just the usual inability of biochemists to agree among themselves. The higher figure is derived from theoretical considerations, where the amount of energy liberated when electrons travel along the electron transport chain is divided by the amount of energy required to synthesise an ATP molecule. Theoretical yields are 3 moles of ATP per mole of NADH and 2 moles of ATP per mole of FADH2. The lower figure is based on empirical values, that is, those derived from experiment. Empirical yields for NADH and FADH2 are 2.5 moles of ATP and 1.5 moles of ATP, respectively. These values are lower because some of the energy obtained from electron transport is used for the export of ATP from the mitochondrion as well as for the synthesis of ATP.
Anaerobic Tissues
Several cells and tissues rely wholly or partly on anaerobic respiration, either in a constitutive manner or as circumstances dictate. Partially anaerobic tissues include the kidney medulla, which is poorly perfused by blood and therefore receives little O2, and the cells of the retina, where O2 metabolism is not favoured lest it damage the light-sensitive pigments necessary for photoreception. More extreme examples are represented by the red blood cell and by vigorously exercising white (type 2) muscle fibres.
Red blood cells show great economy of volume to maintain a property of deformability, which allows them to travel unimpeded through narrow capillaries. One of the means by which this is achieved is the complete absence of intracellular organelles, including mitochondria. Thus, the red blood cell has zero capacity for oxidative metabolism and relies entirely on anaerobic conversion of glucose to lactate to meet its energy requirements.
By contrast, white muscle fibres do have mitochondria. These fibres compose fast-twitch muscles, which are the ‘fight or flight’ muscles responsible for escape from danger (or, more mundanely, for sports such as sprinting). The rapid response of such muscles, and the ATP requirement involved, precludes use of the aerobic route for ATP generation. This is not because the aerobic route is longer and more time-consuming, but rather because the rate of O2 diffusion into the muscle fibre is so slow by comparison with the rate of ATP consumption by the contracting muscle. However, the very rapid rates of the enzyme-catalysed reactions in the glycolytic pathway can be increased 1000-fold in an almost instantaneous manner and this is sufficient to cater for the muscle’s energy requirements.
As with all anaerobic episodes, the only fuel that can be respired by white muscle fibres is glucose. The white muscle fibre has large stores of intracellular glycogen to produce glucose units for anaerobic respiration (Figure 9.5) and the breakdown of glycogen in contracting muscle is stimulated by adrenaline, among other factors. The muscle cannot produce free glucose from glycogen because it lacks the enzyme glucose-6-phosphatase; therefore, glycogen is broken down to the glycolytic intermediate glucose-6-phosphate. The muscle may also take up glucose from the blood to fuel anaerobic ATP production. Ultimately, the source of blood glucose is likely to be liver glycogen.
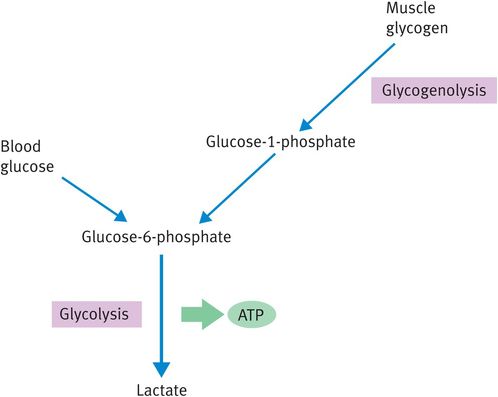
Fuels for anaerobically respiring muscle
Carbohydrate Metabolism during Starvation
During starvation, the body has access to huge fat reserves (which are metabolised to acetyl CoA) but to very little carbohydrate. Glycogen reserves are substantially depleted by the overnight fast and are undetectable after about 24 hours of fasting. This brings the body to something of a crisis because the brain has an absolute requirement for glucose. In the fed state, the brain consumes about 100 g/day of glucose and while this requirement can be reduced to about 25 g/day during starvation, it cannot be diminished any further. During such episodes, hepatic gluconeogenesis must maintain supplies of glucose.
However, the irreversibility of the PDH reaction now presents something of a stumbling block: although the abundant fat stores allow the production of large amounts of acetyl CoA, this cannot be converted to pyruvate, which would be a gluconeogenic substrate. There is also no way of synthesising another gluconeogenic intermediate from acetyl CoA because two carbon atoms are lost during TCA cycle activity. The net result of these observations is that fat can never be converted to glucose under any circumstances.
It is interesting to note that plants, perhaps as a result of occupying an evolutionary pinnacle, do have means of converting fat into glucose (the glyoxylate shuttle).
Given that the brain’s glucose requirement must be satisfied for its continued function, glucose must be synthesised from non‐carbohydrate, non‐fat precursors.
This role is fulfilled by muscle protein and amino acids are released from wasting muscle relatively early on in starvation (Figure 9.6). Such wasting is not without its penalty, however, since loss of muscle protein leads to loss of function. Death from starvation (which occurs after around 60 days in a normal-sized adult) is most commonly caused by weakening of essential muscles.
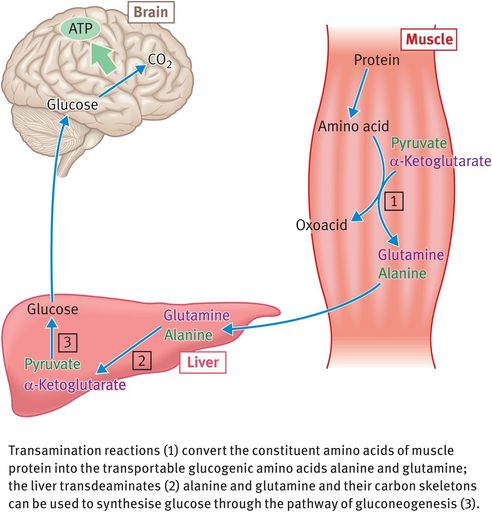
Release of glucogenic amino acids by muscle tissue during prolonged starvation
Maintenance of Blood Glucose concentrations in the Normal and Diabetic State
The body expends a great deal of effort and energy in maintaining blood glucose levels within very narrow limits (Figure 9.7). For a healthy individual without diabetes, for whom glucose homeostasis is strictly controlled, fasting blood glucose might be as low as 4 mmol/l and postprandial levels might rise as high as 8 mmol/l but values do not vary outside these limits. Blood glucose is maintained during the first 24 hours of starvation by mobilisation of liver glycogen and thereafter by muscle protein breakdown, followed by gluconeogenesis. Blood glucose concentrations are maintained at around 4 mmol/l for the duration of starvation, until death occurs.
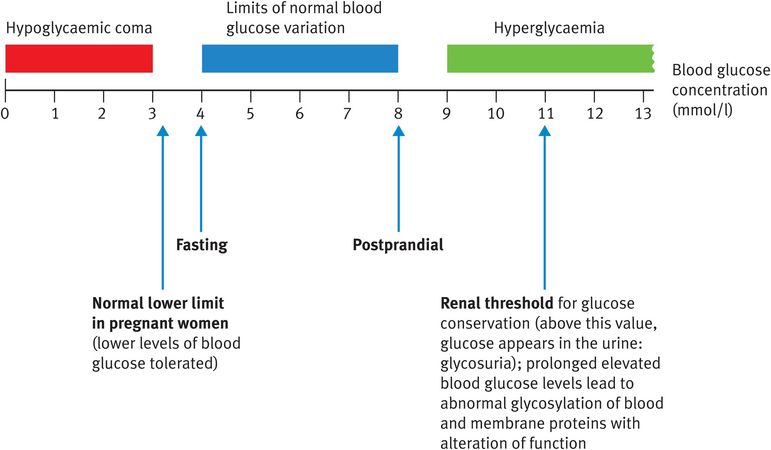
By contrast, uncontrolled diabetes can result in vast fluctuations in blood glucose concentration with severe consequences (Figure 9.7). The brain is perfectly able to function when the blood glucose concentration is 4 millimoles/l but loses this ability at 2 mmol/l, when a hypoglycaemic coma is very likely to result (Figure 9.7). When the blood glucose concentration is 2 mmol/l, there is still a total of 1.8 g of glucose present in the circulation (compared with 3.6 g at 4 mmol/l) but this glucose becomes much less accessible to the brain. These values are derived by assuming that an average-sized person has 5 l of blood (the molecular weight of glucose is 180 g). Here we can appreciate the importance of considering the concentration rather than the quantity of glucose. The brain takes up glucose by facilitated diffusion using the proteinaceous glucose transporter type 3 (GLUT3). GLUT3 has a KM for glucose of 1.6 mmol/l, meaning that the transporter will be saturated with glucose and working at maximal capacity at all normal concentrations of blood glucose. If the blood glucose concentration drops below 3 millimoles/l, however, the brain’s glucose transporter is no longer saturated and is not able to satisfy the brain’s glucose requirement. Such a situation is characteristic of hypoglycaemic coma caused, for example, by the presence of diabetes or by overconsumption of alcohol.
The Michaelis constant KM, represents the substrate concentration at which an enzyme-catalysed reaction or a transport process reaches half-maximum velocity. If the KM is low, only a low substrate concentration is required for a process to occur at maximum velocity and vice versa. It is noteworthy that the glucose transporter in the brain has a lower KM than those present in any other cell or tissue. To a certain extent, this allows the brain preferential access to the glucose present in the bloodstream. (The KM is often quoted as an inverse index of the affinity of a transporter or enzyme for its substrate. This is not an equation that bears close scrutiny but it does provide a useful conceptual perspective: if the KM is low, the affinity is high and vice versa.)
Fat metabolism
Fat molecules show great versatility in the uses to which they are put by the body. Table 9.3 outlines some of the diverse roles of fats. During the present chapter we will concern ourselves with their role in energy storage and oxidation.
| Role | Form |
|---|---|
| Energy storage | Triacylglycerol |
| Membrane formation | Phospholipids |
| Hormone synthesis | Eicosanoids (prostaglandins, thromboxanes, leucotrienes formed from essential fatty acids) |
| Intracellular signalling | Membrane phospholipids broken down to second messengers when hormone binds to its receptor |
| Regulation of gene transcription | Fatty acids (plus fat-soluble vitamins) |
Stay updated, free articles. Join our Telegram channel

Full access? Get Clinical Tree


