Background
In the setting of persistently high risk for maternal death and severe obstetric morbidity, little is known about the relationship between hospital delivery volume and maternal outcomes.
Objective
The objectives of this analysis were (1) to determine maternal risk for severe morbidity during delivery hospitalizations by hospital delivery volume in the United States and (2) to characterize, by hospital volume, the risk for death in the setting of severe obstetric morbidity, a concept known as failure to rescue.
Study Design
This cohort study evaluated 50,433,539 delivery hospitalizations across the United States from 1998–2010. The main outcome measures were (1) severe morbidity that was defined as a composite of any 1 of 15 diagnoses that are representative of acute organ injury and critical illness and (2) failure to rescue that was defined as death in the setting of severe morbidity.
Results
The prevalence of severe morbidity rose from 471.2–751.5 cases per 100,000 deliveries from 1998–2010, which was an increase of 59.5%. Failure to rescue was highest in 1998 (1.5%), decreased to 0.6% in 2007, and rose to 0.9% in 2010. In models that were adjusted for comorbid risk and hospital factors, both low and high annualized delivery volume were associated with increased risk for failure to rescue and severe morbidity. However, the relative importance of hospital volume for both outcomes compared with other factors was relatively small.
Conclusion
Although low-and high-delivery volume are associated with increased risk for both failure to rescue and severe maternal morbidity, other factors, in particular characteristics of individual centers, may be more important in the determination of outcomes.
The burdens of maternal death and severe obstetrical morbidity and childbirth in the developed world have been increasing. Dramatic advances in perinatal care over the last 3 decades have not been paralleled by improvements in maternal care. National organizations, including the American Congress of Obstetricians and Gynecologists, American Board of Obstetrics and Gynecology, the Society for Maternal-Fetal Medicine, Amnesty International, and the National Institute of Child Health and Human Development all recently have issued policy recommendations to increase awareness of the causes of maternal death and to promote improved care of pregnant women.
Referral and/or transfer of complicated patients to centers with expertise, facilities, and staffing to care for mothers at high risk for death have been proposed as a means of reducing maternal death and severe morbidity. However, little is known regarding maternal care at low-volume obstetrics centers in the United States; scant data are available on comorbid risk factors, incidence of life-threatening complications, and how often death occurs in the setting of severe morbidity. Outcomes at low-volume hospitals may be critically important, given that, as of 2008, 58% of hospitals that provide obstetrics care performed <1000 deliveries each year, and an additional 21% of hospitals performed 1000–2000 deliveries each year. In other medical specialties, higher procedural volume has been associated with improved outcomes for high-risk interventions such as lung transplantation and complex cancer surgery ; however, for some lower risk procedures, volume has been associated with lesser or no benefit.
Given the critical importance of determining the relationship between hospital volume and maternal outcomes, this analysis had 2 main objectives: (1) to determine maternal risk for severe morbidity by hospital delivery volume in the United States and (2) to characterize, by hospital volume, the risk for death in the setting of severe morbidity, which is a concept that is known as failure rescue.
Methods
Data from the Nationwide Inpatient Sample (NIS) from the Agency for Healthcare Research and Quality were used for this analysis. The NIS is the largest publicly available, all-payer inpatient database in the United States. The NIS dataset contains a random sample of approximately 20% of hospital discharges within the United States, and, through 2011, all hospitalizations for individual centers were included. The sampling frame for the NIS includes nonfederal, general, and specialty-specific hospitals throughout the United States, both academic and community facilities. The NIS included approximately 8 million hospital stays from 45 states in 2010. Because of the deidentified nature of the data set, institutional review board exemption was obtained from Columbia University, New York, NY, to perform this analysis.
We analyzed data from women who were hospitalized for a delivery from 1998–2010. Patients were identified with International Classification of Diseases, Ninth Revision, billing codes V27 and 650. Use of these codes obtained >95% of delivery hospitalizations. For each hospital, we calculated the total number of delivery hospitalizations and divided this by the number of years in which a hospital had at least 1 delivery. To avoid the inclusion of emergency deliveries that occurred in hospitals that do not otherwise provide obstetrics services, centers with annualized delivery volume of <50 were excluded; previous analyses that evaluated obstetric volume have used this threshold. In addition to annualized delivery volume, hospital characteristics included location (urban vs rural), teaching status (teaching vs nonteaching), hospital bed size, hospital ownership (government, private nonprofit, or private investor), and region (Eastern, Midwest, South, or West). Patient transfers from other hospitals were excluded, given that their outcome could have been dependent on care received from the transferring center. Within the NIS, sampling weights can be used to provide national estimates. These sampling weights were applied to determine rates of all risk factors and outcomes in the aggregate population, which are reported per 100,000 deliveries; similarly, sampling weights were used in the unadjusted and adjusted analyses. As per the data use agreement for the Nationwide Database from the Healthcare Cost and Utilization Project, individual cells with ≤10 cases are not reported.
Comorbid risk factors were determined by a review of the literature. Medical, obstetric, and demographic conditions that were shown to be predictive of severe maternal morbidity were included in the analysis. Based on data from the United Kingdom comorbid risk factors such as diabetes mellitus, hypertensive diseases of pregnancy, and substance abuse have also been shown to be associated with increased risk for death. To summarize comorbid risk, a validated index that was designed specifically for use in obstetric patient populations that includes demographic and medical risk factors (such as congenital heart disease, hypertension, and diabetes mellitus) that are predictive of maternal death and acute organ injury was included in the adjusted models. Risk factors that were included in the index were assigned a weight; patients with a score of 0 have the lowest risk of severe morbidity with increasing score associated with increased risk. In the initial study used to calculate the comorbidity index, risk for severe morbidity was 0.68% with a score of 0 compared with 10.9% with a score of >10. For categoric analyses, patients were classified based on the following scores: 0, 1, 2, 3, 4, and ≥5. The following patient demographic characteristics were evaluated additionally: maternal age, race (white, black, Hispanic), year of discharge, zip code income, and payer status.
For outcomes, measures and diagnoses of severe morbidity were reviewed in the research literature. This analysis used 15 diagnoses of acute organ injury and critical illness that were also analyzed in the validated obstetric comorbidity index: acute heart failure, acute liver disease, acute myocardial infarction, acute renal failure, acute respiratory failure, disseminated intravascular coagulation, coma, delirium, puerperal cerebrovascular disorders, pulmonary edema, pulmonary embolism, sepsis, shock, status asthmaticus, and status epilepticus. Incidence rates of severe morbidity and failure to rescue were calculated. Failure to rescue was defined as death in the setting of 1 of the 15 acute organ injury diagnoses that were representative of severe maternal morbidity. The concept of failure to rescue has arisen from the growing recognition that 1 of the most important determinants of outcomes may not be the occurrence of a complication, but how a life-threatening condition is managed. Failure-to-rescue as an outcome to evaluate how patient outcomes may differ based on institutional and provider factors. Although evaluation of failure-to-rescue with administrative data cannot determine causality, such analyses can demonstrate potentially clinically significant associations.
Annualized hospital delivery volume was analyzed in 2 ways: (1) for the unadjusted analyses, volume was analyzed categorically, and (2) for the adjusted analyses, volume was analyzed continuously. For the unadjusted analyses, delivery volume was classified into 1 of 4 categories: 50–500 deliveries (very low volume), 501–1000 deliveries (low volume), 1001–2000 deliveries (medium volume), and >2000 (high volume). Previous analyses have used varying obstetric volume cutoffs ; the volume categories that were used in this analysis were chosen because they represent easily interpretable and clinically meaningful distinctions in obstetric volume.
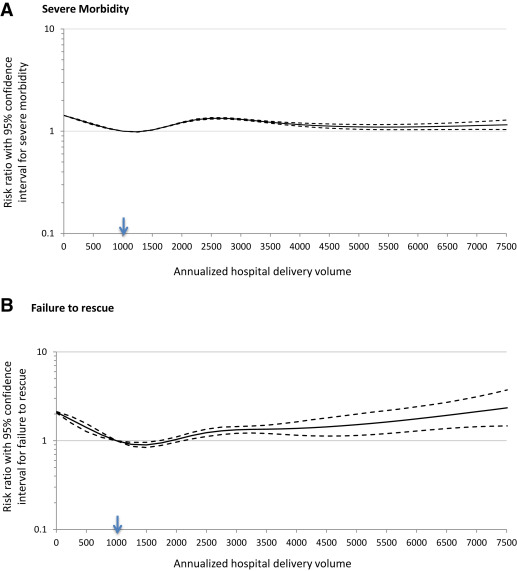
Adjusted risks for severe maternal morbidity and failure to rescue in relation to annualized delivery volume were evaluated with a generalized linear mixed-effects model with a Poisson distribution and a log link function to account for hospital clustering. Restricted cubic splines are nonparametric smoothing procedures that do not necessitate restriction on the shape of distribution; this method allows flexibility in presenting the nonlinear relationship between continuous predictors and outcome and was used to model annualized hospital delivery volume. The appropriate numbers of knots for annualized delivery volume in the models were determined by the likelihood-ratio test. A 5-piece restricted cubic spline with knot locations at annualized hospital volumes of 377 (5th percentile of the patient population), 1252 (28th percentile), 2170 (50th percentile), 3437 (73th percentile), and 7163 (95th percentile) was applied to the regression model for severe morbidity; another 5-piece restricted cubic spine model was developed for failure to rescue with knot locations at 432 (5th percentile of patients), 1478 (28th percentile), 2378 (50th percentile), 3600 (73th percentile), and 7433 (95th percentile). These models account for patient demographics, hospital characteristics, and comorbid risk. The results of the individual cubic spline regressions for severe morbidity and failure to rescue are presented visually as smoothed lines with RRs (with 95% confidence intervals) with annualized delivery volume of 1000 as the reference.
Within the adjusted models, Akaike information criteria (AIC) were used to evaluate the relative importance of each covariate on severe maternal morbidity and failure to rescue by removing 1 covariate at a time from the model. A larger AIC indicates a greater importance for the given variable that was omitted from the model. The likelihood ratio test compares the fit of a full model (including all variables) to a reduced model omitting a specified variable, thereby indicating the statistical significance of the omitted variable. All analyses were performed with SAS software (version 9.4; SAS Institute, Cary, NC).
Results
A total of 50,433,539 deliveries were included in the analysis, of which there were 284,883 cases of severe maternal morbidity and 2795 cases of failure to rescue. Failure to rescue accounted for 78.7% of the 3550 deaths in the cohort. There were 3,995,340 deliveries (7.9%) at very low-volume centers, 6,678,632 deliveries (13.2%) at low-volume centers, 12,719,964 deliveries (25.2%) at moderate volume centers, and 27,039,603 deliveries (53.6%) at high-volume centers. This cohort of patients represents a national estimate based on sampling weights from the NIS applied to an original population of 10,325,140 deliveries from 2832 hospitals. Very low-and low-volume centers were more likely to be rural, nonteaching, located in the Midwest or South, and serve lower-income patients ( Table 1 ). Most risk factors for severe morbidity and/or death were prevalent at a higher rate at moderate and high-volume hospitals. Rates of potentially high-risk conditions (such as pulmonary hypertensions, congenital heart disease, and systemic lupus) were all highest at high-volume hospitals. However, deliveries in the setting of many risk factors (such as previous cesarean delivery, gestational hypertension, mild or unspecified preeclampsia, and asthma) were not uncommon at very low-and low-volume centers ( Table 2 ).
| Volume category | Injuries per 100,000 deliveries | |||||||
|---|---|---|---|---|---|---|---|---|
| 50-500 | 501-1000 | 1001-2000 | >2000 | |||||
| n | % | n | % | n | % | n | % | |
| Deliveries, n | 3995340 | 7.9 | 6678632 | 13.2 | 12719964 | 25.2 | 27039603 | 53.6 |
| Age, y | ||||||||
| <20 | 421012 | 10.5 | 604792 | 9.1 | 960861 | 7.6 | 1699089 | 6.3 |
| 20–24 | 1349406 | 33.8 | 1998147 | 29.9 | 3325647 | 26.1 | 6129449 | 22.7 |
| 25–29 | 1136512 | 28.4 | 1932605 | 28.9 | 3632024 | 28.6 | 7550169 | 27.9 |
| 30–34 | 715802 | 17.9 | 1391837 | 20.8 | 3015584 | 23.7 | 7142120 | 26.4 |
| ≥35 | 372609 | 9.3 | 751250 | 11.2 | 1785848 | 14.0 | 4518775 | 16.7 |
| Discharge year | ||||||||
| 1998 | 319923 | 8.0 | 542169 | 8.1 | 917855 | 7.2 | 1670289 | 6.2 |
| 1999 | 316950 | 7.9 | 492742 | 7.4 | 1001132 | 7.9 | 1777928 | 6.6 |
| 2000 | 323248 | 8.1 | 517540 | 7.7 | 985485 | 7.7 | 1989851 | 7.4 |
| 2001 | 294499 | 7.4 | 570009 | 8.5 | 954945 | 7.5 | 1926590 | 7.1 |
| 2002 | 299284 | 7.5 | 527086 | 7.9 | 946281 | 7.4 | 2139245 | 7.9 |
| 2003 | 293283 | 7.3 | 531976 | 8.0 | 919554 | 7.2 | 2101735 | 7.8 |
| 2004 | 300295 | 7.5 | 492668 | 7.4 | 968214 | 7.6 | 2234461 | 8.3 |
| 2005 | 309023 | 7.7 | 503136 | 7.5 | 1060452 | 8.3 | 2133574 | 7.9 |
| 2006 | 296637 | 7.4 | 515463 | 7.7 | 1089574 | 8.6 | 2156567 | 8.0 |
| 2007 | 315523 | 7.9 | 503902 | 7.5 | 972971 | 7.6 | 2530658 | 9.4 |
| 2008 | 297924 | 7.5 | 495864 | 7.4 | 1049418 | 8.3 | 2188405 | 8.1 |
| 2009 | 328690 | 8.2 | 560429 | 8.4 | 937987 | 7.4 | 2123926 | 7.9 |
| 2010 | 300060 | 7.5 | 425648 | 6.4 | 916097 | 7.2 | 2066375 | 7.6 |
| Household income ZIP code | ||||||||
| Lowest quartile | 1035952 | 25.9 | 1358262 | 20.3 | 2248024 | 17.7 | 4785709 | 17.7 |
| Second quartile | 1631562 | 40.8 | 2077377 | 31.1 | 3216154 | 25.3 | 5221307 | 19.3 |
| Third quartile | 910518 | 22.8 | 1763445 | 26.4 | 3311374 | 26.0 | 6683046 | 24.7 |
| Highest quartile | 309366 | 7.7 | 1354525 | 20.3 | 3632455 | 28.6 | 9983036 | 36.9 |
| Unknown | 107942 | 2.7 | 125022 | 1.9 | 311956 | 2.5 | 366504 | 1.4 |
| Insurance status | ||||||||
| Medicare | 27417 | 0.7 | 41142 | 0.6 | 56650 | 0.4 | 118574 | 0.4 |
| Medicaid | 1887247 | 47.2 | 2851435 | 42.7 | 4896513 | 38.5 | 9604893 | 35.5 |
| Private | 1791125 | 44.8 | 3354606 | 50.2 | 6826356 | 53.7 | 15762226 | 58.3 |
| Self pay | 138544 | 3.5 | 207729 | 3.1 | 493217 | 3.9 | 902320 | 3.3 |
| Other | 128984 | 3.2 | 208964 | 3.1 | 405253 | 3.2 | 616780 | 2.3 |
| Unknown | 22023 | 0.6 | 14755 | 0.2 | 41976 | 0.3 | 34808 | 0.1 |
| Race | ||||||||
| White | 2135872 | 53.5 | 3226749 | 48.3 | 5365328 | 42.2 | 9991168 | 37.0 |
| Black | 203089 | 5.1 | 466168 | 7.0 | 1385910 | 10.9 | 2931176 | 10.8 |
| Hispanic | 290315 | 7.3 | 720112 | 10.8 | 2106320 | 16.6 | 5479109 | 20.3 |
| Other/unknown | 1366063 | 34.2 | 2265603 | 33.9 | 3862406 | 30.4 | 8638149 | 31.9 |
| Hospital size | ||||||||
| Small | 1227763 | 30.7 | 1390149 | 20.8 | 1411269 | 11.1 | 1474606 | 5.5 |
| Medium | 1352044 | 33.8 | 2268198 | 34.0 | 4342721 | 34.1 | 5463350 | 20.2 |
| Large | 1394664 | 34.9 | 2991148 | 44.8 | 6925018 | 54.4 | 20006777 | 74.0 |
| Unknown | 20869 | 0.5 | 29137 | 0.4 | 40956 | 0.3 | 94869 | 0.4 |
| Hospital location | 0.0 | 0.0 | ||||||
| Rural | 2769004 | 69.3 | 2213178 | 33.1 | 916945 | 7.2 | 185037 | 0.7 |
| Urban | 1205467 | 30.2 | 4436316 | 66.4 | 11762062 | 92.5 | 26759697 | 99.0 |
| Unknown | 20869 | 0.5 | 29137 | 0.4 | 40956 | 0.3 | 94869 | 0.4 |
| Hospital region | ||||||||
| Northeast | 636683 | 15.9 | 953850 | 14.3 | 2543895 | 20.0 | 4404609 | 16.3 |
| Midwest | 1319028 | 33.0 | 2137932 | 32.0 | 2903945 | 22.8 | 4570405 | 16.9 |
| South | 1326037 | 33.2 | 2488972 | 37.3 | 4452019 | 35.0 | 10302657 | 38.1 |
| West | 713592 | 17.9 | 1097879 | 16.4 | 2820106 | 22.2 | 7761931 | 28.7 |
| Hospital teaching | ||||||||
| Nonteaching | 3771998 | 94.4 | 5459540 | 81.7 | 8235508 | 64.7 | 9140368 | 33.8 |
| Teaching | 125272 | 3.1 | 1066592 | 16.0 | 4262130 | 33.5 | 17371700 | 64.2 |
| Unknown | 98071 | 2.5 | 152500 | 2.3 | 222327 | 1.7 | 527534 | 2.0 |
| Hospital owner | ||||||||
| Government | 880615 | 22.0 | 685789 | 10.3 | 860395 | 6.8 | 899632 | 3.3 |
| Private nonprofit | 633342 | 15.9 | 1585432 | 23.7 | 2765877 | 21.7 | 5487735 | 20.3 |
| Private investor | 419902 | 10.5 | 967905 | 14.5 | 2098852 | 16.5 | 1516178 | 5.6 |
| Unknown/other | 2061481 | 51.6 | 3439506 | 51.5 | 6994840 | 55.0 | 19136058 | 70.8 |
| Comorbidity index | ||||||||
| 0 | 552216 | 13.8 | 932905 | 14.0 | 1707980 | 13.4 | 3446830 | 12.7 |
| 1 | 158091 | 4.0 | 282035 | 4.2 | 559045 | 4.4 | 1244776 | 4.6 |
| 2 | 58185 | 1.5 | 104860 | 1.6 | 225179 | 1.8 | 536685 | 2.0 |
| 3 | 14416 | 0.4 | 27676 | 0.4 | 65046 | 0.5 | 167782 | 0.6 |
| 4 | 3772 | 0.1 | 7836 | 0.1 | 20422 | 0.2 | 56646 | 0.2 |
| ≥5 | 6126 | 0.2 | 12950 | 0.2 | 33576 | 0.3 | 100105 | 0.4 |
| Risk factors | Prevalence rate per 100,000 deliveries | ||||
|---|---|---|---|---|---|
| 50-500 | 501-1000 | 1001-2000 | >2000 | All patients | |
| Pulmonary hypertension a | 5.4 | 7.7 | 10.8 | 16.9 | 13.2 |
| Placenta previa a | 174.6 | 199.4 | 234.9 | 260.7 | 239.3 |
| Sickle cell disease/thalassemias a | 49.4 | 67.2 | 106.0 | 145.8 | 117.7 |
| Gestational hypertension | 3,062.4 | 2,996.8 | 2,820.7 | 2,889.0 | 2,899.8 |
| Mild or unspecified preeclampsia b | 2,609.5 | 2,272.1 | 2,469.2 | 2,677.3 | 2,565.8 |
| Severe preeclampsia or eclampsia b | 621.1 | 737.4 | 961.6 | 1,318.6 | 1,096.3 |
| Chronic renal disease b | 186.6 | 168.4 | 178.0 | 192.0 | 184.9 |
| Chronic hypertension a | 1,094.4 | 1,159.4 | 1,386.1 | 1,676.1 | 1,488.4 |
| Chronic ischemic heart disease b | 11.3 | 6.4 | 9.2 | 13.8 | 11.4 |
| Congenital heart disease a | 40.3 | 44.1 | 58.4 | 71.8 | 62.3 |
| Systemic lupus erythematosus a | 38.0 | 51.7 | 71.5 | 109.5 | 86.6 |
| Human immunodeficiency virus b | 30.9 | 51.1 | 98.7 | 146.0 | 1,12.4 |
| Multiple gestation a | 932.5 | 1,127.9 | 1,465.8 | 1,940.9 | 1,633.5 |
| Drug abuse b | 244.0 | 247.7 | 278.2 | 209.0 | 234.3 |
| Alcohol abuse b | 94.2 | 99.3 | 96.8 | 102.4 | 99.9 |
| Cardiac valvular disease a | 337.1 | 505.5 | 595.4 | 742.2 | 641.7 |
| Chronic congestive heart failure b | 0.2 | 0.1 | 0.5 | 0.7 | 0.5 |
| Asthma a | 1,414.9 | 1,661.6 | 1,963.6 | 2,369.9 | 2,098.0 |
| Preexisting diabetes mellitus a | 531.4 | 620.8 | 744.7 | 925.6 | 808.4 |
| Previous cesarean delivery a | 14,237.2 | 14,173.5 | 14,517.6 | 14,958.1 | 14,685.9 |
Prevalence of severe morbidity rose significantly over the course of the study period from 471.2 cases per 100,000 deliveries in 1998 to 751.5 per 100,000 in 2010, an increase of 59.5% ( Table 3 ). Delivery at high-volume hospitals was associated with higher risk for severe morbidity (618.6 per 100,000 deliveries), compared with moderate, low, and very low-volume centers (incidence rates of 542.1, 443.7, 476.4 cases per 100,000 deliveries, respectively). Risk was also higher for women >34 years old compared with younger women, for black women compared with other racial and ethnic groups, and in the South compared with other geographic regions. A high score on the obstetric comorbidity index was associated with increased risk for severe morbidity; for example, a score of 0 was associated with an incidence rate of 0.4% of severe morbidity, whereas a score of ≥5 was associated with an incidence of 5.7% risk of severe morbidity. The prevalence rate of individual severe morbidity diagnoses stratified by hospital volume is presented in the Appendix .
| Variable | Severe morbidity (n=284,883) | Failure to rescue (n=2795) | ||
|---|---|---|---|---|
| Cases, n | Per 100,000 deliveries, n | Cases, n | Per 100,000 cases severe morbidity, n | |
| Annualized delivery volume a , b | ||||
| 50-500 | 19033 | 476.4 | 117 | 617.2 |
| 501-1000 | 29633 | 443.7 | 267 | 902.5 |
| 1001-2000 | 68952 | 542.1 | 812 | 1177.1 |
| >2000 | 167265 | 618.6 | 1598 | 955.4 |
| Age, y a , b | ||||
| <20 | 16918 | 459.0 | 124 | 730.2 |
| 20-24 | 59964 | 468.4 | 506 | 843.4 |
| 25-29 | 74110 | 520.0 | 614 | 828.9 |
| 30-34 | 74735 | 609.3 | 722 | 966.3 |
| ≥35 | 59156 | 796.3 | 828 | 1400.5 |
| Year a , b | ||||
| 1998 | 16258 | 471.2 | 249 | 1534.2 |
| 1999 | 17400 | 484.8 | 252 | 1445.9 |
| 2000 | 17086 | 447.7 | 243 | 1421.6 |
| 2001 | 17469 | 466.3 | 185 | 1060.7 |
| 2002 | 19375 | 495.3 | 243 | 1254.9 |
| 2003 | 20968 | 545.1 | 218 | 1041.8 |
| 2004 | 22207 | 555.8 | 198 | 893.6 |
| 2005 | 22445 | 560.3 | 232 | 1032.1 |
| 2006 | 23015 | 567.1 | 155 | 671.4 |
| 2007 | 25555 | 591.1 | 161 | 628.6 |
| 2008 | 28071 | 696.3 | 189 | 675.0 |
| 2009 | 27167 | 687.6 | 225 | 829.4 |
| 2010 | 27868 | 751.5 | 243 | 873.4 |
| Household income a , b | ||||
| Lowest quartile | 62113 | 658.8 | 647 | 1041.4 |
| Second quartile | 67755 | 557.8 | 859 | 1267.7 |
| Third quartile | 67966 | 536.5 | 622 | 915.2 |
| Highest quartile | 80337 | 525.8 | 608 | 756.9 |
| Unknown | 6713 | 736.5 | 58 | 868.6 |
| Insurance status a , b | ||||
| Medicare | 2994 | 1228.1 | 51 | 1705.9 |
| Medicaid | 117111 | 608.7 | 1405 | 1199.7 |
| Private | 145154 | 523.4 | 1096 | 755.1 |
| Self pay | 10409 | 597.6 | 137 | 1318.8 |
| Other | 8501 | 625.1 | 101 | 1182.7 |
| Unknown | 714 | 629.2 | — c | 680.0 |
| Race a , b | ||||
| White | 108811 | 525.2 | 769 | 707.0 |
| Black | 42329 | 848.9 | 717 | 1694.6 |
| Hispanic | 41874 | 487.1 | 510 | 1217.9 |
| Other/unknown | 91869 | 569.5 | 798 | 868.2 |
| Hospital bed size a | ||||
| Small | 26552 | 482.4 | 188 | 706.9 |
| Medium | 72886 | 542.9 | 764 | 1048.7 |
| Large | 184305 | 588.5 | 1832 | 994.0 |
| Unknown | 1141 | 614.0 | — c | 855.0 |
| Hospital location a | ||||
| Rural | 27450 | 451.2 | 194 | 706.2 |
| Urban | 256293 | 580.3 | 2591 | 1011.0 |
| Unknown | 1141 | 614.0 | — c | 855.0 |
| Hospital region a , b | ||||
| Northeast | 51134 | 598.8 | 438 | 856.3 |
| Midwest | 56423 | 516.2 | 435 | 771.2 |
| South | 117162 | 630.9 | 1245 | 1062.6 |
| West | 60164 | 485.4 | 677 | 1124.5 |
| Hospital teaching a , b | ||||
| Non-teaching | 126091 | 473.9 | 1097 | 870.0 |
| Teaching | 154252 | 675.8 | 1610 | 1043.7 |
| Unknown | 4541 | 453.9 | 87 | 1915.6 |
| Hospital owner a | ||||
| Government | 15900 | 478.0 | 182 | 1146.0 |
| Private non-profit | 51259 | 489.5 | 434 | 846.7 |
| Private investor | 24036 | 480.4 | 267 | 1109.5 |
| Unknown/other | 193689 | 612.3 | 1911 | 986.6 |
| Comorbidity index a , b | ||||
| 0 | 114715 | 353.9 | 783 | 682.5 |
| 1 | 57800 | 527.2 | 446 | 771.9 |
| 2 | 40022 | 883.9 | 469 | 1170.8 |
| 3 | 19219 | 1426.6 | 270 | 1406.6 |
| 4 | 10519 | 2415.9 | 161 | 1532.0 |
| ≥5 | 42608 | 5692.1 | 665 | 1561.0 |
b P <.05 for failure to rescue
c Cell size ≤10 are not presented as per data usage agreement.
Failure to rescue occurred in 1.0% of women with severe morbidity cases: 2795 deaths among 284,883 cases of severe morbidity. The unadjusted risk for failure to rescue was lowest in very low-volume hospitals (0.6%) and highest in moderate volume hospitals (1.2%). Other factors that were associated with increased risk for failure to rescue included maternal age ≥35 years (failure to rescue rate, 1.5%), black race (1.7%), and obstetric comorbidity index score of ≥5 (1.6%). Failure to rescue was highest in 1998 at the start of the study period (1.5%) and decreased to 0.6% in 2007 before rising to 0.9% in 2010.
The adjusted model for severe morbidity based on hospital volume is presented in the Figure . With annualized delivery volume of 1000 as the reference, risk for severe morbidity was increased at delivery volume of 50 (risk ratio [RR], 1.40; 95% confidence interval [CI], 1.39–1.40). Risk then decreased to a nadir at an annualized volume of approximately 1250 (RR, 0.98; 95% CI, 0.98–0.99) and then rose again as volume increased, with a peak RR at annualized volume of 2500 (RR,1.34; 95% CI, 1.31–1.36) before decreasing again. Other factors that were associated with increased risk for severe morbidity included year of delivery, with risk generally increasing as the study period progressed, and higher score based on the obstetric comorbidity index (RR, 1.56; 95% CI, 1.56–1.56; Table 4 ). Analysis of AIC demonstrates that the most important factors in severe morbidity risk were (1) patient-level comorbidity as measured by the comorbidity index and (2) hospital random effects as captured by the mixed model. The role of annualized delivery volume within the model was minor ( Table 5 ).