Background
Preeclampsia (PE) is a leading cause of maternal death. Its cause is still debated but there is general agreement that the placenta plays a central role. Perhaps the most commonly proposed contributors to PE include placental hypoxia, oxidative stress, and increased proinflammatory cytokines. How the placenta responds to these abnormalities has been considered but not as part of a comprehensive analysis of low-molecular-weight biomolecules and their responses to these accepted PE conditions.
Objective
Using a peptidomic approach, we sought to identify a set of molecules exhibiting differential expression in consequence of provocative agents/chemical mediators of PE applied to healthy human placental tissue.
Study Design
Known PE conditions were imposed on normal placental tissue from 13 uncomplicated pregnancies and changes in the low-molecular-weight peptidome were evaluated. A t test was used to identify potential markers for each imposed stress. These markers were then submitted to a least absolute shrinkage and selection operator multinomial logistic regression model to identify signatures specific to each stressor. Estimates of model performance on external data were obtained through internal validation.
Results
A total of 146 markers were increased/decreased as a consequence of exposure to proposed mediators of PE. Of these 75 changed with hypoxia; 23 with hypoxia-reoxygenation/oxidative stress and 48 from exposure to tumor necrosis factor-α. These markers were chemically characterized using tandem mass spectrometry. Identification rates were: hypoxia, 34%; hypoxia-reoxygenation, 60%; and tumor necrosis factor-α, 50%. Least absolute shrinkage and selection operator modeling specified 16 markers that effectively distinguished all groups, ie, the 3 abnormal conditions and control. Bootstrap estimates of misclassification rates, multiclass area under the curve, and Brier score were 0.108, 0.944, and 0.160, respectively.
Conclusion
Using this approach we found previously unknown molecular changes in response to individual PE conditions that allowed development biomolecular signatures for exposure to each accepted pathogenic condition.
Introduction
Preeclampsia (PE) is a disorder of pregnancy characterized by hypertension and proteinuria. Its cause remains unknown. Despite increased understanding of its pathophysiology, PE incidence has increased in the United States over the past decade. As many as 75,000 women die worldwide yearly from PE. No established therapeutics exist and efforts to develop such have been hampered by the incomplete explanation of its cause. Currently, when PE cannot be temporized by clinical management, the pregnancy is ended. Typically, there is a rapid resolution of the hypertension, proteinuria, and other abnormalities. These findings and substantial other research suggest that the placenta is necessary for and a likely participant in PE. Yet, the specific changes in the placenta that may lead to PE and their antecedent causes are still debated.
Placentas from women with established PE demonstrate many alterations but it is unclear which are part of early PE pathogenesis. Among these, some appear to influence placentae very early to produce PE. These include hypoxia, oxidative stress, and increased exposure to proinflammatory cytokines. These changes are thought to arise from inadequate remodeling of the maternal vasculature leading to poor placental perfusion. Placentae experiencing hypoxia, oxidative stress, or inflammatory cytokines, eg, tumor necrosis factor (TNF)-α, initiate a cascade of events leading to maternal features of PE. Knowing what effect these factors might have on normal placenta could be used to define specific placental changes that should be evident in PE.
Evaluating molecular changes in placenta has frequently involved proteomic analysis of tissue from women with and without established PE. Common methods primarily identify highly abundant, high-molecular-weight proteins, many being structural proteins and chaperones.
The aim of this study was to document molecular changes in placenta with exposure to conditions thought to cause PE. To accomplish this, changes in the abundance of low-molecular-weight (LMW) biomolecular placental components were determined by a global, tissue “omics” approach for each condition thought to participate in PE, first to demonstrate that changes take place in response to that pathologic state and second to identify a set or signature of molecular responses characteristic of each. This should allow a PE placenta’s composition to define its exposure to early and continued abnormalities.
Materials and Methods
Specimen collection
Institutional review board approval was obtained from Brigham Young University and Intermountain Health Care to collect human placentae. No patient personal or medical information was recorded in this process and no patient identifiers were provided. Thirteen placentas were collected immediately after elective cesarean delivery from uncomplicated term pregnancies. A full-thickness (∼3 × 3 × 3 cm) block of placenta was dissected rapidly midway between the cord and placental edge, placed on ice, and processed within 30 minutes of delivery. No placenta came from a complicated pregnancy or from women with preexisting disease, eg, hypertension or diabetes.
Sample processing
Fetal membranes and decidua were removed. Explants were collected from the intervillous region representing a point midway between the chorionic and basal plates and ∼1-cm thick. After initial washing with ice-cold, sterile, phosphate-buffered saline, the tissue was cut into thin sections (≤3 mm) and kept on ice to minimize proteolysis. Slices were washed another 8-10 times until nearly all blood was removed.
Explant culture
Tissue (∼300 mg) was cultured in 4-mL Dulbecco’s Modified Eagle’s Medium supplemented with 1% penicillin-streptomycin (Sigma-Aldrich, St Louis, MO). Normal oxygen tension in the intervillous region of placenta has been reported to be 6-8%. This was considered normoxic. All explants were maintained in a modular air chamber (Billups-Rothernberg, Del Mar, CA) filled with 10% oxygen, 5% carbon dioxide, and 85% nitrogen for normoxic cultures. The medium was changed after 24 hours, and control or abnormal conditions were imposed for 48 hours.
Each explant was divided into multiple strips, 1 incubated under normal conditions and 1 for each of the PE-associated conditions, termed “stressors” as described below.
Hypoxia
Hypoxia was estimated to be 1-2% oxygen for intervillous tissue. For hypoxic treatment, placental explants were exposed to 2% oxygen, 5% carbon dioxide, and 93% N 2 .
Hypoxia-reoxygenation
Placental explants were cultured under hypoxic conditions for 24 hours and then normoxic conditions for 24 hours. Hypoxia-reoxygenation (H/R) results in release of reactive oxygen species.
Inflammatory cytokines
TNF-α was added to the culture medium at a final concentration of 5.74 nmol/L with incubations of 48 hours.
MS analysis
After capillary liquid chromatography (LC) eluate was introduced into a quadrupole time-of-flight tandem MS through an electrospray needle (6530 Accurate-Mass Quadrupole Time-of-Flight/LC/MS; Agilent Technologies, Santa Clara, CA). Needle voltage was 3800V and samples were run in the positive ion mode. Mass spectra were collected 8/s over a mass-to-charge (m/z) range of 400-3000. Data were acquired using MassHunter Data Acquisition B.06.00 and analyzed using Qualitative MassHunter B.06.00 software (Agilent Technologies). Other MS parameters were: gas temperature, 300°C; drying gas flow rate, 5 L/min; nebulizer pressure, 15 psi; fragmentor voltage, 175V; and skimmer voltage, 65V.
Time normalization, as described previously, was achieved by defining 2-minute windows across the entire LC using 11 time markers to define the middle of each elution window. These are summarized below.
Elution windows were evaluated separately. Mass spectra for all samples receiving 1 treatment were given 1 color and overlaid with other samples given a second color from the same placentas maintained under control conditions. In overlays peaks that appeared different quantitatively (differences of ∼1.5x) were evaluated statistically. Peak intensities were determined using the “extract ion count” function of the MS software (MassHunter; Agilent Technologies), compiled, and statistically tested. For any differentially expressed peak, a nearby peak, representing an endogenous species having comparable abundance under stressed and control conditions, was also extracted and peak heights were tabulated. These were used as internal references to normalize candidate peaks. In the 11 2-minute windows, approximately 7500-8000 MS features were observed.
Homogenization of placental explants
Following incubation, individual explants were homogenized as described elsewhere. Briefly, 300 mg of placenta were homogenized in the presence of 20 μL of protease inhibitor cocktail (P9599; Sigma-Aldrich) plus 20 μL of 8.87 mmol/L 1,10-phenanthroline. The homogenate was resuspended in 3 mL of phosphate-buffered saline and aliquots treated with 2 volumes of acetonitrile (1:2, vol/vol). This reduced proteins in the specimen, minimizing ion suppression, allowing for ∼5000-6000 additional low-abundance species to be interrogated using mass spectrometry (MS).
Statistical analysis
To reduce the number of potential peaks from which to identify potential biomarkers and to build a classification model, Student t test (2-tailed, paired) was performed on each peak in the data set to determine whether the abundance of an extracted peak was different between the control and a given condition. A P value <.05 was considered indicative of a potential biomarker. Any peak with a P value <.05 in any comparison (ie, controls vs hypoxia, controls vs H/R, controls vs TNF-α) was retained as a possible biomarker for the creation of a classification model.
To build the classification model, least absolute shrinkage and selection operator multinomial logistic regression was selected due to its high internal validation performance relative to other methods and its inherent ability to perform peak selection (CRAN, R Project Organization). Since no external data were available for an external validation of the classification model, the performance was assessed through internal validation. To assess overall model performance, we applied the bootstrap method to obtain estimates of the multiclass area under the curve and the Brier score. We used the .632+ bootstrap method to estimate the misclassification rate. The model is expected to have very good performance. We note that since only the peaks in the list of potential biomarkers were considered in building the final model, the estimates from internal validation are expected to be optimistic. All analyses were performed using R (R Core Team 2015, R Project Organization).
Peptide identification
Peptide candidates were submitted to tandem MS fragmentation studies to sequence them using nitrogen and sometimes argon (for poorly fragmenting species) as the collision gas. The acquisition rate for MS/MS experiments was 1 scan/s and the isolation window was 1.3 m/z for low-charge and 4 m/z for high-charge state peptides.
Due to low initial marker abundance, fragmentation data did not provide complete b- and y-series and de novo sequencing was required.
Lipid identification
Lipids were fragmented similarly using tandem MS. Databases LIPID Maps (Lipid Maps Organization), Metlin database (Scripps University), and Human Metabolome Database were used to assign lipid structures based on fragment patterns. For markers without matches in databases, elemental composition was predicted by exact mass studies using commercial standards having m/z 121.0509 and 922.0098 (Agilent Technologies).
Results
Chromatographic time alignment
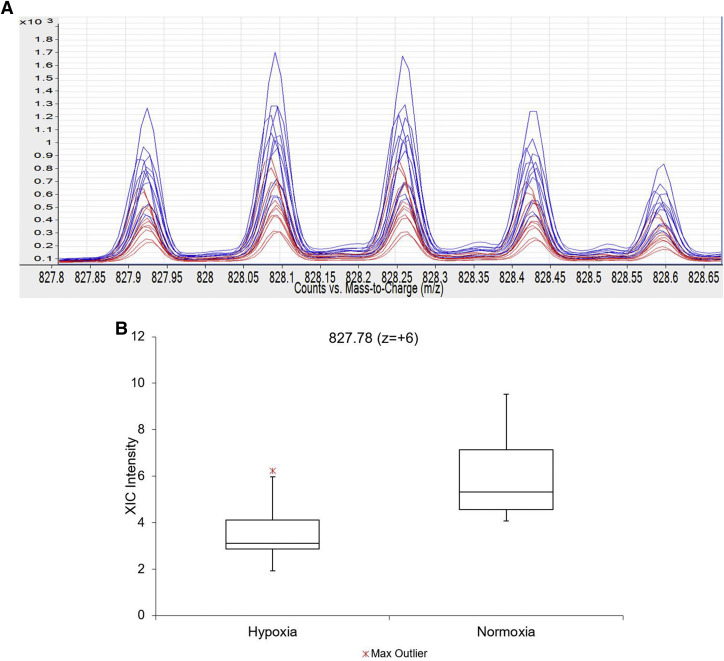
The 11 time normalization peaks are summarized by their m/z, charge state, and approximate elution time as follows: 695.09 (z = +4) 17 minutes, 827.78 (z = +6) 19 minutes, 474.2 (z = +1) 21 minutes, 672.36 (z = +3) 23 minutes, 686.46 (z = +1) 25 minutes, 1009.05 (z = +1) 27 minutes, 616.16 (z = +1) 32 minutes, 526.28 (z = +1) 34 minutes, 524.36 (z = +1) 37 minutes, 650.43 (z = +1) 39 minutes, and 675.53 (z = +1) 41 minutes.
Low-abundance LMW species altered by PE conditions
Most molecules did not change significantly with treatment. However, several biomolecules changed in response to each treatment. A few changed with >1. For example, peptide m/z 827.78 (z = +6) decreased with hypoxia and H/R but not TNF-α ( Figure 1 ).
In response to hypoxia, significant changes were observed for 75 markers ( Table 1 , A). H/R elicited significant changes in 23 molecules ( Table 1 , B). TNF-α caused significant changes in 48 molecules ( Table 1 , C). Box-and-whisker plots for differentially expressed biomolecules with P values <.001 are provided in Supplementary Figure . To better understand the biology underlying these changes, tandem MS studies were conducted to chemically classify or identify candidates.
| A. Differentially expressed biomolecules in hypoxic placental explants | ||||||
|---|---|---|---|---|---|---|
| m/z | Z | M+H | P value | Normalized P value | Hypoxia | Control |
| 456.17 | 1 | 456.17 | 8.50E-02 | 3.43E-02 | ↓ | ↑ |
| 517.03 | 1 | 517.03 | 3.56E-02 | 3.57E-03 | ↑ | ↓ |
| 639.33 | 1 | 639.33 | 1.04E-01 | 4.57E-02 | ↓ | ↑ |
| 723.22 | 1 | 723.22 | 7.26E-02 | 1.96E-02 | ↓ | ↑ |
| 889.57 | 1 | 889.57 | 7.94E-02 | 2.92E-02 | ↓ | ↑ |
| 981.43 | 1 | 981.43 | 1.01E-01 | 3.08E-02 | ↓ | ↑ |
| 489.61 a | 3 | 1466.83 | 3.67E-02 | 1.83E-02 | ↓ | ↑ |
| 643.59 a | 4 | 2571.36 | 5.93E-02 | 2.87E-02 | ↓ | ↑ |
| 520.3 | 5 | 2597.5 | 8.07E-03 | 3.82E-03 | ↓ | ↑ |
| 574.3 | 5 | 2867.5 | 4.29E-02 | 2.16E-02 | ↓ | ↑ |
| 830.4 a | 6 | 4977.4 | 1.44E-03 | 3.87E-04 | ↓ | ↑ |
| 478.17 | 1 | 478.17 | 1.29E-03 | 3.00E-03 | ↓ | ↑ |
| 495.05 | 1 | 495.05 | 8.78E-02 | 1.13E-01 | ↑ | ↓ |
| 512.18 | 1 | 512.18 | 1.03E-02 | 7.77E-03 | ↓ | ↑ |
| 545.12 | 1 | 545.12 | 9.85E-04 | 1.41E-03 | ↓ | ↑ |
| 570.55 | 4 | 2279.2 | 4.98E-03 | 5.83E-03 | ↓ | ↑ |
| 736.08 | 6 | 4411.48 | 1.42E-02 | 2.79E-02 | ↓ | ↑ |
| 676.49 | 7 | 4729.43 | 8.69E-04 | 4.54E-03 | ↓ | ↑ |
| 694.64 | 7 | 4856.48 | 2.18E-04 | 7.38E-04 | ↓ | ↑ |
| 823.26 a | 6 | 4934.56 | 8.31E-03 | 3.34E-02 | ↓ | ↑ |
| 827.78 a | 6 | 4961.68 | 5.28E-06 | 1.08E-04 | ↓ | ↑ |
| 997.5 | 5 | 4983.5 | 2.04E-03 | 1.11E-02 | ↓ | ↑ |
| 1001.9032 | 5 | 5005.516 | 1.06E-03 | 1.57E-02 | ↓ | ↑ |
| 1257.62 | 4 | 5027.48 | 5.87E-03 | 2.93E-02 | ↓ | ↑ |
| 1012.89 a | 5 | 5060.45 | 3.28E-04 | 5.64E-03 | ↓ | ↑ |
| 1271.37 | 4 | 5082.48 | 7.46E-03 | 4.28E-02 | ↓ | ↑ |
| 1063.73 | 5 | 5314.65 | 7.80E-02 | 6.09E-03 | ↓ | ↑ |
| 1334.9 | 4 | 5336.6 | 4.55E-02 | 9.65E-03 | ↓ | ↑ |
| 500.14 | 10 | 4992.4 | 1.25E-02 | 6.27E-03 | ↓ | ↑ |
| 405.18 | 1 | 405.18 | 5.74E-02 | 3.54E-02 | ↑ | ↓ |
| 425.13 | 1 | 425.13 | 1.66E-03 | 6.65E-04 | ↑ | ↓ |
| 431.05 | 1 | 431.05 | 7.45E-02 | 8.62E-02 | ↓ | ↑ |
| 447.11 | 1 | 447.11 | 3.04E-04 | 4.13E-06 | ↑ | ↓ |
| 469.09 | 1 | 469.09 | 1.17E-02 | 2.51E-02 | ↑ | ↓ |
| 504.23 | 1 | 504.23 | 5.51E-03 | 1.49E-02 | ↓ | ↑ |
| 736.39 | 6 | 4413.34 | 1.43E-04 | 1.13E-02 | ↓ | ↑ |
| 427.18 | 1 | 427.18 | 1.55E-02 | 4.73E-03 | ↑ | ↓ |
| 458.25 a | 1 | 458.25 | 2.45E-03 | 7.80E-04 | ↓ | ↑ |
| 563.29 | 1 | 563.29 | 8.32E-03 | 3.61E-03 | ↓ | ↑ |
| 400.91 | 3 | 1200.73 | 6.33E-05 | 2.09E-05 | ↓ | ↑ |
| 401.57 | 3 | 1202.71 | 3.52E-04 | 9.91E-05 | ↓ | ↑ |
| 744.49 a | 11 | 8179.39 | 7.71E-05 | 6.96E-05 | ↓ | ↑ |
| 711.87 | 14 | 9953.18 | 1.47E-03 | 1.81E-03 | ↓ | ↑ |
| 415.19 | 1 | 415.19 | 7.90E-02 | 1.23E-02 | ↑ | ↓ |
| 519.27 | 1 | 519.27 | 1.24E-02 | 1.14E-03 | ↓ | ↑ |
| 650.97 | 13 | 8450.61 | 5.13E-04 | 3.29E-04 | ↓ | ↑ |
| 462.59 | 3 | 1385.77 | 1.01E-02 | 1.43E-02 | ↓ | ↑ |
| 868.07 | 6 | 5203.42 | 3.14E-04 | 6.70E-05 | ↓ | ↑ |
| 753.52 a | 7 | 5269.69 | 4.53E-02 | 6.88E-02 | ↓ | ↑ |
| 893.79 | 6 | 5357.74 | 2.25E-02 | 7.00E-02 | ↓ | ↑ |
| 1038.8 a | 8 | 8306.22 | 4.43E-02 | 1.14E-01 | ↓ | ↑ |
| 429.19 | 1 | 429.19 | 3.93E-02 | 8.1E-02 | ↑ | ↓ |
| 435.19 | 1 | 435.19 | 8.62E-03 | 2.0E-02 | ↑ | ↓ |
| 413.19 | 1 | 413.19 | 6.07E-02 | 0.029 | ↑ | ↓ |
| 470.74 | 1 | 470.74 | 5.91E-02 | 4.28E-02 | ↓ | ↑ |
| 417.33 a | 1 | 417.33 | 3.16E-03 | 2.79E-04 | ↓ | ↑ |
| 424.33 a | 1 | 424.33 | 1.27E-03 | 3.25E-05 | ↑ | ↓ |
| 431.3 a | 1 | 431.3 | 1.33E-02 | 1.26E-03 | ↓ | ↑ |
| 722.41 a | 1 | 722.41 | 5.63E-02 | 1.33E-02 | ↓ | ↑ |
| 536.32 a | 1 | 536.32 | 2.26E-02 | 4.45E-02 | ↓ | ↑ |
| 616.35 | 1 | 616.35 | 8.87E-02 | 1.07E-01 | ↓ | ↑ |
| 622.39 a | 1 | 622.39 | 2.19E-02 | 6.63E-02 | ↓ | ↑ |
| 652.41 a | 1 | 652.41 | 4.66E-02 | 5.04E-02 | ↓ | ↑ |
| 666.42 a | 1 | 666.42 | 2.67E-02 | 2.97E-02 | ↓ | ↑ |
| 688.4 a | 1 | 688.4 | 5.08E-02 | 4.22E-02 | ↓ | ↑ |
| 864.54 a | 1 | 864.54 | 6.34E-02 | 6.22E-02 | ↓ | ↑ |
| 594.36 a | 1 | 594.36 | 1.34E-02 | 3.69E-02 | ↓ | ↑ |
| 414.76 | 1 | 414.76 | 3.84E-02 | 2.56E-01 | ↓ | ↑ |
| 423.75 | 1 | 423.75 | 3.15E-02 | 1.45E-01 | ↓ | ↑ |
| 452.37 a | 1 | 452.37 | 9.27E-03 | 9.97E-05 | ↑ | ↓ |
| 454.38 a | 1 | 454.38 | 8.91E-04 | 3.46E-06 | ↑ | ↓ |
| 510.38 a | 1 | 510.38 | 2.99E-02 | 6.35E-02 | ↓ | ↑ |
| 480.39 a | 1 | 480.39 | 1.01E-02 | 7.21E-06 | ↑ | ↓ |
| 484.43 | 1 | 484.43 | 2.87E-05 | 1.05E-06 | ↑ | ↓ |
| 649.49 | 1 | 649.49 | 3.84E-02 | 7.57E-03 | ↑ | ↓ |
Stay updated, free articles. Join our Telegram channel

Full access? Get Clinical Tree


