Objective
We describe current evidence for staging low malignant potential ovarian tumors and their conformity to current consensus guidelines and practice from an international perspective.
Data Sources
A search of MEDLINE, EMBASE, and SCOPUS databases was conducted for articles published between January 1990 and April 2015.
Study Eligibility Criteria
Studies on low malignant potential ovarian tumors that evaluated the prognostic value of disease stage, staging vs no staging, complete vs incomplete staging, or discrete components of staging were eligible. Studies that described only crude survival rates were excluded.
Study Appraisal and Synthesis Methods
Eligible studies were categorized according to their outcome (disease stage, staging procedure, or discrete staging elements). Data were abstracted using a standard form. Inconsistencies on data abstraction were resolved by consensus among the authors. Risk of bias was assessed using the Newcastle-Ottawa Scale.
Results
Of 1116 studies, 702 were excluded for irrelevance and 364 for not meeting inclusion criteria. Nine studies were excluded for describing crude survival rates without a comparative conclusion. We found that studies supporting the value of defining disease stage or staging procedures (mostly conducted in northern Europe) included more patients than studies that did not find disease stage or staging useful (predominantly from North America, 4072 vs 3951). Disease stage correlated with survival in 13 of 25 studies, whereas none of the studies that evaluated the value of staging found it beneficial (9 studies, 1979 patients). Studies that evaluated isolated components of staging found no benefit to these procedures. Regional guidelines and consensus reviews drew conclusions based on a limited number of studies that generally originated from the same region.
Conclusions
Although the correlation of stage with survival was mixed, performing staging procedures for low malignant potential ovarian tumors is not supported by the best available evidence. Guidelines in support of staging based their recommendations on a few regional studies and conflict with better-quality data that do not support staging procedures. An international consensus statement is needed to standardize the surgical management of low malignant potential ovarian tumors.
Low malignant potential ovarian tumors were first described by Taylor in 1929. At that time, this category of ovarian tumors was addressed as semimalignant, a description that may explain the persistence of controversy in their management for the last century. Low malignant potential accounts for 14-15% of all primary ovarian tumors and has been variably placed in a gray zone between benign and malignant. Although the prognosis of low malignant potential ovarian tumors remains more favorable than invasive tumors, the histological types and microscopic and macroscopic architecture resemble invasive malignant tumors.
Preoperative ultrasonographic diagnosis is reliant on finding typical features of multiloculated or septated cyst with papillary projection; however, up to one third may present as uniocular cysts. Therefore, 78% of low malignant potential ovarian tumors are encountered and managed by general obstetrician-gynecologists, whereas only 10% are managed by gynecological oncologists.
Management among surgeons, particularly general obstetrician-gynecologists, is inconsistent; 35% do not perform staging biopsies, whereas 9% tend to perform complete staging. Full surgical staging has been justified by some because of the difference in prognosis between early and advanced disease stage. However, the prognostic value of disease stage has not been evident in other studies. Furthermore, there is no evidence that adjuvant therapy improves outcomes for higher staged tumors.
Accordingly, it is unclear whether defining stage or performing surgical staging is of value. This lack of strong evidence regarding surgical staging weakens practice guidelines and makes them less likely to be followed. Because disease recurrence or persistence is reported in up to 14% of cases, it is important to define an appropriate treatment strategy to reduce unnecessary procedures or the need for reintervention.
Materials and Methods
Objective
The aim of this systematic review is to assess current evidence on surgical staging from a global perspective and to appraise congruence of current consensus statements or guidelines with the best available evidence. This review also summarizes surgeons’ attitude toward staging and to what extent it has been influenced by evidence and clinical guidance.
Literature search
A search was conducted for studies that addressed the value of staging compared with no staging, complete vs incomplete staging, the value of discrete components of staging, and the prognosis of early vs advanced International Federation of Gynecology and Obstetrics stages of low malignant potential ovarian tumors based on the final pathology report.
Based on this review protocol and in collaboration with an expert librarian, a search on MEDLINE, EMBASE, and SCOPUS databases was done for articles published between January 1990 and April 2015. Search key words included borderline ovarian tumors or ovarian low malignant potential tumors and surgical staging or staged or unstaged or lymphadenectomy or omentectomy or peritoneal biopsy or cytology and recurrence or prognosis or outcome or survival. References from related studies and reviews were searched. No language restriction was applied. The detailed search strategy is provided in the Appendix .
Eligibility criteria and study selection
All abstracts were screened for selection of relevant studies, and full texts were reviewed for eligibility prior to inclusion. Studies were categorized according to whether they described the prognostic impact of early vs late stages, surgical staging vs no staging, complete vs incomplete staging, or discrete staging components (lymphadenectomy, omentectomy, peritoneal biopsy, or cytology). Studies that described only crude survival rates without comparative conclusions were excluded. Sample size alone was not a criterion for exclusion. The outcomes of interest include whether the staging procedure or a knowledge of stage was correlated to the patient outcomes and whether the study origins or the statistical methods applied in these studies influenced their conclusion.
To identify consensus statements or guidelines from different regions and congruence with current evidence, we searched MEDLINE, EMBASE, and SCOPUS databases for the articles that contain the following terms: borderline ovarian tumors or low malignant potential ovarian tumors and guidelines or consensus or recommendations. We recorded the publication date, the country of origin, recommendations, and the evidence cited to support these recommendations. For the evaluation of gynecological surgeons’ attitudes toward staging, we searched for the terms the following terms: borderline ovarian tumors or low malignant potential ovarian tumors and survey. We reported the publication date, the country of origin, the surveyed population, and a summary of survey results.
Study selection
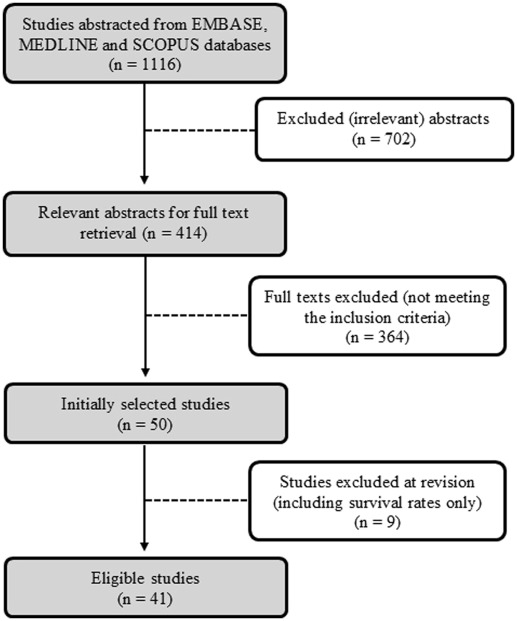
Of 1116 abstracts initially available based on search terms, 702 were excluded for not being relevant to the primary objectives. Additional 364 articles were screened out during review of full texts for not meeting the inclusion criteria. During data extraction, 9 studies were excluded because they provided only crude survival rates without comparative conclusion. Overall, 41 studies with data on 8023 women were eligible ( Figure 1 ). One investigation was considered in the study count but excluded from population size analysis because of the duplication of patients with another study.
Data abstraction
Extraction of the data from the full articles was performed using a standardized form that included authors, year of the study, country of origin, type of study, time frame of data collection, sample size, primary method of statistical analysis, duration of follow-up, outcomes, and conclusions. Data were extracted from the main text, tables, and figures. Inconsistencies between reviewers on study selection and data extraction were resolved by consensus among the authors; discrepancies found were minor. For simplicity, studies were categorized based on their conclusion to either prognostically valuable or prognostically not valuable according to whether a study found disease stage and/or staging procedure(s), useful or not. Observational studies were assessed using the Newcastle-Ottawa Scale.
Pooled analysis was not feasible because of the heterogeneity of the cohort criteria (spectrum of disease stage, histopathology of the tumor), statistical analysis, duration of follow-up, and primary outcomes. Furthermore, some studies presented their results as descriptive statements of conclusion rather than quantitative conclusions. An analysis was performed using Microsoft Office Excel 2010 (Microsoft, Redmond, WA).
Results
All studies were retrospective and originated from 16 countries ( Table 1 ). Twelve studies were conducted in middle and northern Europe. Another 12 studies originated in southern Europe and the Middle East. There were 8 studies from North America, 7 studies from Asia, and 2 from Australia.
| Author | Year | Country | Type of study | Data collection frame | Sample size | Duration of follow-up | Statistical method | Outcome | Comparison groups | Conclusion | Quality of study a |
|---|---|---|---|---|---|---|---|---|---|---|---|
| Studies that analyzed the value of disease stages (early vs late) | |||||||||||
| Loizzi et al | 2015 | Italy | Retrospective | January 1991 to December 2011 | 55 | N/A | Univariate analysis | Disease-free survival time and rate | Stages I-II and stage III | PNV | 6 |
| Trillsch et al , b | 2015 | Germany | Retrospective | 1998–2008 | 559 | N/A | Cox regression | Progression-free survival | Stages II-III vs stage I | PV | 7 |
| Menczer et al | 2012 | Israel | Retrospective | March 1, 1994, to June 30, 1999 | 225 | 13 y survival was considered | Univariate analysis | 13 y survival rate | Stage I and stage II/III | PNV | 5 |
| Bois et al , b | 2013 | Germany | Retrospective | 1998 to 2008 | 950 | N/A | Cox regression | Progression-free survival | Stage I vs II/III | PV | 7 |
| Ferrero et al. | 2012 | Italy | Retrospective | January 1985 to August 2010 | 209 | Mean, 52.7 mo (range, 4-240 mo) | Cox regression | Disease-free survival | Stage I vs II/III | PNV | 6 |
| Ewald-Riegler et al | 2012 | Germany | Retrospective | 1997 and 2000 | 158 | Median, 42.12 mo | Cox regression | Relapse-free survival | Staging I vs II/III | PV | 6 |
| Tang et al , c | 2012 | Australia, Hong Kong, The Netherlands | Retrospective | 1985 and 2008 | 940 | Median, 53.9 mo (range, 0–60 mo) | Cox regression | Disease-free survival and overall survival | Stage I vs II-IV | PV | 6 |
| Shih et al | 2011 | United States | Retrospective | 1979–2008 | 266 | Median, 44.4 mo (range, 0–273.6 mo) | Univariate analysis | 3 y overall survival | Stages I, II, and III/IV | PNV | 6 |
| Tsai et al | 2011 | Taiwan | Retrospective | 2000–2006 | 61 | Mean, 56.5 mo (range, 12–103 mo) | Cox regression | Disease-free survival | Stage Ia vs Ib-III | PNV | 6 |
| Park et al | 2011 | Korea | Retrospective | 1990–2010 | 130 | Mean and median, 90 and 79 mo (range, 5–236 mo) | Cox regression | Disease-free survival | Stage I vs II/III | PNV | 7 |
| Poncelet et al | 2010 | France | Retrospective | 1990–2000 | 317 | Mean, 34.4 ± 2.6 mo (women followed up by CA125) and 40 ± 5.1 mo (women who were not) | Multivariate logistic regression | Recurrence rates | Stage Ia vs other stages | PV | 7 |
| Park et al | 2009 | Korea | Retrospective | April 1989 to May 2008 | 360 | Median, 70 mo (range 3–216 mo) | Cox regression | Disease-free interval | Early stages (I/II) vs late stages (III/IV) | PV | 6 |
| Lenhard et al | 2009 | Germany | Retrospective | 1983 to 2006 | 113 | Mean, 9.6 ± 6.6 y | Kaplan-Meier curve (log-rank test) | Overall survival (5 and 10 y survival rates), relapse rate | Stage Ia vs higher stages | PNV | 6 |
| Kane et al | 2009 | France | Retrospective | January 1973 to February 2006 | 168 | Median, 57 mo (range, 1–437 mo) | Univariate analysis | Recurrence-free interval | Stage II and stage III | PNV | 5 |
| De Iaco et al | 2008 | Italy | Retrospective | January 1985 to June 2006 | 168 | Mean, 60.5 (range 4-240 mo) | Cox regression | Recurrence rate | Stage I and stage III | PNV | 6 |
| Ren et al | 2008 | China | Retrospective | January 2001 to June 2007 | 234 | Median, 40 mo (range, 8–78 mo) | Cox regression | Disease-free survival | Stages I, II, and III | PV | 7 |
| Cusidó et al | 2007 | Spain | Retrospective | January 1990 to December 1997 | 457 | Mean, 88 ± 41.21 mo | Univariate analysis | Recurrence | Stages I, II, and III | PNV | 5 |
| Yokoyama et al | 2006 | Japan | Retrospective | 1994–2003 | 124 | Median, 57 mo (1–126 mo) | Kaplan-Meier curve (disease-free survival) and multinomial logistic regression (for recurrence) | Disease-free survival and recurrence | Stage I vs II-IV | PNV | 5 |
| Romagnolo et al | 2006 | Italy | Retrospective | January 1992 to June 2004 | 113 | Median, 40 mo for laparotomy, 47 mo for laparoscopy | Kaplan-Meier curve (log-rank test) | Progression-free survival (at 10 y) | Stages Ia, Ib-Ic, II, and III | PV | 6 |
| Camatte et al | 2002 | France | Retrospective | January 1969 to December 2000 | 68 | Median, 71.5 mo (range, 3-313 mo) | Univariate analysis | 5 y recurrence rate | Stage I vs stage II/III | PV | 5 |
| Gershenson et al | 1998 | United States | Retrospective | 1956 through mid-1996 | 39 | Median, 111 mo | Cox regression | Overall survival and progression-free survival | Stage II vs III– IV | PNV | 7 |
| Tamakoshi et al | 1997 | Japan | Retrospective | Jan. 1, 1980 to Dec. 31, 1994 | 150 | Mean, 61 mo (range, 2–140 mo) | Kaplan-Meier curve (log-rank test) | Survival rates | Stage I vs II–III | PV | 6 |
| Sykes et al | 1997 | Australia | Retrospective | 1972–1994 | 234 | Mean, 54 m (range, 2-234 mo) | Kaplan-Meier curve | Recurrence rate and overall survival | Stage I vs II–III | PNV | 6 |
| Kærn et al | 1993 | Norway | Retrospective | 1970–1982 | 370 | Median, 127 m (range, –218 mo) | Kaplan-Meier curve (log-rank test), Cox regression | Relapse, disease-free survival and corrected survival | Stage I and stage II–III | PV | 5 |
| Leake et al | 1992 | United States | Retrospective | 1997–1984 | 200 | Mean, 120, median, 134.4 mo (range, 48-324 mo) | Kaplan-Meier curve (log-rank test) | Survival rates (20 y) | Stage, I, II, and III | PV | 5 |
| Studies that evaluated the value of complete vs incomplete staging | |||||||||||
| Kristensen et al | 2014 | Denmark | Retrospective | Jan. 1, 2007, to Dec. 31, 2011 | 75 | Median, 28.7 mo (range, 3.8-67.1 mo) | Univariate analysis | Recurrence | Complete staging was defined as radical surgery, cytology, multiple peritoneal biopsies, and omentectomy. Incomplete staging was defined as the lack of 1 or more of these steps. | PNV | 6 |
| Romeo et al | 2013 | Spain | Retrospective | January 1992 to December 2002 | 46 | Median, 64.8 mo (interquartile range, 30 to 72 mo) | Kaplan-Meier curve (log-rank test), Cox regression | Relapse-free survival | Incomplete staging included lack of infracolic omentectomy, incomplete exploration of the entire cavity, and the paucity of peritoneal biopsies and peritoneal washings. | PNV | 7 |
| Azuar et al | 2013 | France | Retrospective | January 1990 to December 2007 | 142 | Mean, 80.5 mo (range, 12–168 mo) | Multivariate logistic regression | Relapse | Optimal staging was defined as inspection of the peritoneal cavity, an infracolic omentectomy, peritoneal biopsies, and appendectomy for mucinous tumors (incomplete staging was not defined). | PV | 6 |
| Avril et al | 2012 | Germany | Retrospective | 1998–2008 | 70 | Mean, 63 mo, median, 56 mo (range 0–165 mo) | Univariate analysis | Recurrence-free and overall survival | Complete staging includes omentectomy, multiple peritoneal biopsies and peritoneal cytology (incomplete staging was not defined). | PV | 5 |
| Anfinan et al | 2011 | Canada | Retrospective | January 1994 to December 2005 | 138 | Median, 37 mo (range, 39–154 mo) | Kaplan-Meier curve (Log-Rank test) | Overall survival and recurrence-free survival | Complete staging included inspection of all peritoneal surfaces and peritoneal washing, infracolic omentectomy, multiple peritoneal biopsies, and pelvic and paraaortic LA. Incomplete staging was considered when at least 1 of these procedures was missed. | PNV | 5 |
| Koskas et al | 2011 | France | Retrospective | 1997 to 2004 | 97 | Median, 48 mo (range, 3–182 mo) | Kaplan-Meier curve | Recurrence | Complete staging was defined as at least peritoneal cytology sampling, peritoneal biopsies and omentectomy, or omental biopsy (incomplete staging was not defined). | PNV | 4 |
| Di Re et al | 1994 | Italy | Retrospective | January 1975 to December 1991 | 34 | Mean, 108 mo, median, 86 mo (range, 20–222 mo) | Univariate analysis | Survival and recurrence | Complete staging was defined as peritoneal washing, cytopathology, total hysterectomy. and bilateral oophorectomy, infracolic ± gastrocolic omentectomy (if omentum is involved), appendectomy, random peritoneal biopsies and paraaortic and pelvic LA. Incomplete staging ranged from unilateral oophorectomy to any staging procedure that was not complete. | PNV | 5 |
| Studies that evaluated the value of staging over no staging d | |||||||||||
| Guvenal et al | 2013 | Turkey | Retrospective | N/A | 539 | Median, 36 mo (range, 1-120 mo) | Kaplan-Meier curve (log-rank test) | Overall survival | Staged vs unstaged (staged patients are those who had peritoneal washing, omentum, and peritoneal biopsies with or without LA) | PNV | 5 |
| Wong et al | 2007 | Singapore | Retrospective | January 1991 to December 2004 | 247 | Mean, 21 mo (range 2–140 mo) | Univariate analysis | Recurrence, mortality rate | Staged vs unstaged (staged patients had peritoneal washings, adnexectomy, peritoneal biopsies, and omental biopsy) | PNV | 5 |
| Suh-Burgmann | 2006 | United States | Retrospective | 1982–2004 | 193 | Mean, 82.8 mo (range, 6–230.4 mo) | Cox regression | Disease-free survival | Staged vs unstaged (staging refers to peritoneal and/or omental biopsies, lymph node biopsies and appendectomy) | PNV | 7 |
| Wingo et al | 2006 | United States | Retrospective | April 2003 to May 2005 | 32 | N/A | Descriptive data | Recurrence | Staged vs unstaged (staging included cytology, omentectomy, peritoneal biopsy and in most patients, pelvic/paraaortic node dissection) | PNV | 5 |
| Rao et al | 2004 | United States | Retrospective | January 1984 to June 2003 | 248 | N/A | Logistic regression | Recurrence | Staged vs unstaged (staging was not defined) | PNV | 6 |
| Winter et al | 2002 | United States | Retrospective | 1979–1997 | 93 | Mean, 78 ± 50.4 mo | Univariate analysis | Recurrence and mortality rates | Staged vs unstaged (staging referred to hysterectomy and bilateral salpingo-oophorectomy, pelvic or paraaortic LA, omental biopsy, peritoneal biopsies, and cytological washings) | PNV | 6 |
| Studies that evaluated the value of staging elements e | |||||||||||
| Baran et al | 2011 | Turkey | Retrospective | 2003–2009 | 25 | Mean, 25,6 mo (range, 10–82 mo) | Univariate analysis | Recurrence | LA | LA not valuable | 6 |
| Pirimoglu et al | 2008 | Turkey | Prospective | 1998–2007 | 57 | Median, 54.6 mo (range, 12–96 mo) | Descriptive data | Lymph node metastasis, upstaging | LA | LA not valuable | 5 |
| Ayhan et al | 2005 | Turkey | Retrospective | January 1982 to December 2004 | 100 | It ranged from 1 to 157 mo | Kaplan-Meier curve | Overall disease-free survival | Peritoneal cytology | Cytology not valuable | 6 |
a Quality of the studies in terms of bias risk was assessed using the Newcastle-Ottawa Scale. Numbers given refer to the total number of stars
b These studies extracted data from a single database and yielded similar evidence. Only 1 study was included in the analysis (according to sample size)
c In this study, the distribution of participation in sample size was as follows: Australia (67.45%), Hong Kong (16.81%), and The Netherlands (15.74%)
d Menczer et al, De Iaco et al, and Sykes et al are also included under this section
e Guvenal et al, Romeo et al, Shih et al, Tsai et al, Rao et al, and Camatte et al are also included under this section.
Prognostic variables and outcomes were analyzed using a Cox proportional hazards model in 12 studies, Kaplan-Maier survival curves in 12 studies, multivariate logistic regression in 3 studies, univariate analyses in 12 studies, and descriptive data in 2 studies. In these descriptive studies, the authors provided conclusions based on the subjective comparison of outcomes between study groups without statistical analysis. In terms of methodological quality, most studies had Newcastle-Ottawa Scale scores of 5–7, indicating good quality.
Comprehensive analysis of evidence
Of the 41 included studies, 38 studies provided information about the prognostic value of early vs late disease stages or performing surgical staging, and 13 studies described the value of specific staging elements (10 studies described both overall and specific elements of staging). A summary of included studies is presented in Table 1 and Figure 2 .
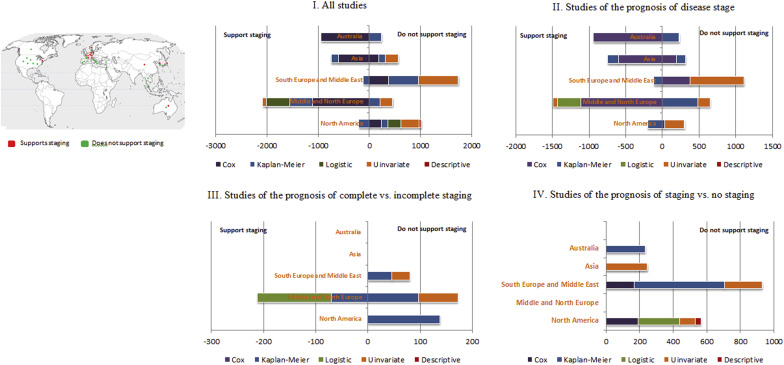
Among the 38 studies, 24 concluded that staging procedures or disease stage were prognostically nonvaluable, whereas 14 studies supported the prognostic value of disease stage or staging procedure (prognostically valuable). The number of included patients was comparable (3951 vs 4072, respectively). The 38 studies were geographically plotted ( Figure 3 ). Nine of the 14 prognostically valuable studies were conducted in northern/middle Europe. By contrast, 7 of the 24 prognostically not valuable studies were conducted in North America and 8 in southern Europe and the Middle East. Comparable numbers of the prognostically not valuable and prognostically valuable studies originated from both Asia and Australia.
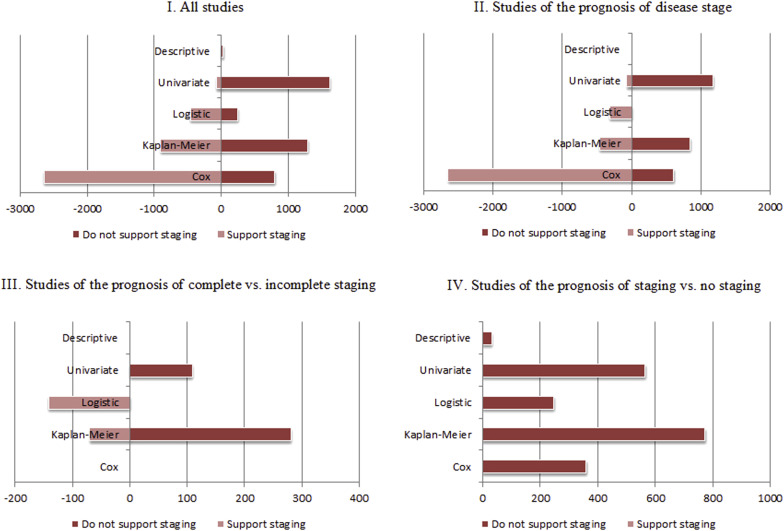
In terms of analytic approach, prognostically valuable studies predominantly used a Cox proportional hazards model in their analysis ( Figure 4 ). Of 4072 patients included in the prognostically valuable studies, data from 2642 women were analyzed using Cox models vs 800 of the 3951 in the prognostically not valuable studies. In the prognostically not valuable studies, univariate analyses were the most prevalent method of analysis (1620 of 3951 women).
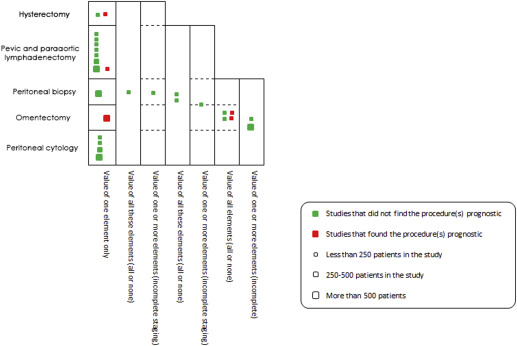
The descriptions of staging and complete staging as opposed to no staging and incomplete staging were relatively inconsistent among studies. Because of this inconsistency, staging procedure(s) that were conducted in each of these studies were extracted and analyzed along with isolated procedures from studies of discrete staging elements. The number, the size, and the value of discrete and combined elements of staging in these studies were then plotted in Figure 5 . We compared the categories of staging (complete/incomplete, etc) based on how the staging was described in each study.
Value of disease stage
Of the 41 studies, 25 studies addressed the prognostic value of disease stage (I-IV) at the time of surgery including overall survival, disease-free survival, and recurrence. However, they inconsistently defined early and late disease stages, for example, grouping stage I and II as early or II-IV as late ( Table 1 .I). Thirteen studies concluded that disease stage was prognostically not valuable. However, more patients were included in the 12 studies that found that early stages yielded better prognosis (2619 prognostically not valuable vs 3490 patients prognostically valuable).
Geographically, prognostically valuable studies predominantly originated in northern/middle Europe ( Figure 3 ). Studies from North America were nearly balanced between finding and not finding a difference in prognosis by stage. In terms of statistical analysis, most evidence that supports the prognostic value of disease stage was derived from Cox models. Prognostically not valuable studies were predominantly limited to univariate analyses ( Figure 4 ). Median duration of follow-up was comparable between the prognostically not valuable and prognostically valuable studies (58.8 months vs 57.5 months, respectively).
Value of surgical staging
Complete vs incomplete staging
Seven studies addressed the impact of complete vs incomplete staging on survival and recurrence; 5 of these concluded that complete staging did not improve the outcome in comparison with incomplete staging (n = 390 women included in these 5 studies). The 2 studies that found that staging improved outcomes included 212 women and originated in middle/northern Europe in 2012 and 2013 ( Figure 3 ). Studies from North America and southern Europe found no difference in outcomes between complete and incomplete staging.
Overall, Cox models were not used in any of the 7 studies; rather, Kaplan-Meier models was the predominant statistical analysis used for analysis ( Figure 4 ). The range of postoperative follow-up in prognostically not valuable studies was 28.7–138 months vs 70–142 months in prognostically valuable studies.
Staging vs no staging
The value of staging vs no staging was directly evaluated in 9 studies. All studies found that staging did not influence disease-free survival or overall survival (1979 patients). These studies were conducted in North America, southern Europe, Asia, and Australia. No studies were conducted in middle/northern Europe ( Figure 3 ). Evidence was principally derived from Kaplan-Meier curves (n = 773), univariate analysis (n = 565), and Cox models (n = 361) ( Figure 4 ). Median length of follow-up was 57 months.
Discrete staging elements
Among the 41 included studies, 13 studies assessed the impact of discrete staging elements ( Figure 5 ). Eight of these studies evaluated the value of lymphadenectomy during surgical management of low malignant potential tumors. Seven studies failed to find an association between lymphadenectomy and survival, whereas in 1 investigation lymphadenectomy was associated with a longer relapse-free survival compared with no lymphadenectomy ( P = .04). The 7 studies were conducted in northern Europe, southern Europe, North America, and Asia using Kaplan-Meier curves (n = 539), a univariate analysis (n = 291), and a Cox model (n = 61). The study that supported the value of lymphadenectomy was conducted in Spain using Kaplan-Meier analysis (n = 46).
The value of obtaining peritoneal cytology was investigated in 4 studies; all showed no impact on disease outcomes. Two studies were conducted in northern Europe, 1 in southern Europe, and 1 in Asia. Of the 1187 patients included in these studies, 919 were analyzed using Cox models. Biopsies from the peritoneum were tested in 2 studies; neither supported it as a prognostic factor. They were both conducted in middle/northern Europe using a Cox model (559 of 634) and a univariate analysis (75 of 634).
Lastly, omentectomy was reported in 1 study in middle/north Europe (Germany) demonstrating better progression-free survival compared with no omentectomy. One study did not find hysterectomy to be associated with outcome (n = 225), whereas 1 investigation did (n = 25), and both utilized univariate analysis.
Clinical guidance and surgeons’ practice
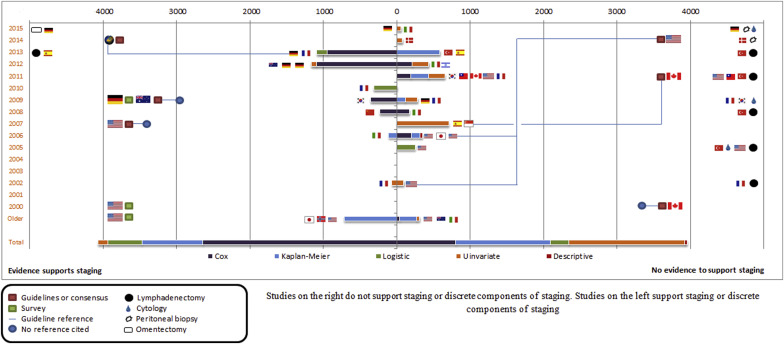
Six relevant guidelines or consensus statements were identified between 1990 and 2015 ( Table 2 ). Three of these guidelines recommended complete staging for low malignant potential ovarian tumors in 2007 (United States), 2009 (Australia), and 2014 (international, predominantly from Germany). The other 3 concluded that staging is not indicated; these guidelines were published in 2000 (Canada), 2011 (Canada), and 2014 (United States). In the same time frame, we identified 3 surveys of surgeons’ attitude from the United States (1999, 2000) and Germany (2009). All indicated that the majority of surgeons perform complete staging. These are shown in Figure 2 (consensuses are shown as red boxes, surveys as green boxes).


