Background
Systematic evaluation and estimation of growth trajectories in twins require ultrasound measurements across gestation that are performed in controlled clinical settings. Currently, there are few such data for contemporary populations. There is also controversy about whether twin fetal growth should be evaluated with the use of the same benchmarks as singleton growth.
Objectives
Our objective was to define the trajectory of fetal growth in dichorionic twins empirically using longitudinal 2-dimensional ultrasonography and to compare the fetal growth trajectories for dichorionic twins with those based on a growth standard that was developed by our group for singletons.
Study Design
A prospective cohort of 171 women with twin gestations was recruited from 8 US sites from 2012–2013. After an initial sonogram at 11 weeks 0 days–13 weeks 6 days of gestation during which dichorionicity was confirmed, women were assigned randomly to 1 of 2 serial ultrasonography schedules. Growth curves and percentiles were estimated with the use of linear mixed models with cubic splines. Percentiles were compared statistically at each gestational week between the twins and 1731 singletons, after adjustment for maternal age, race/ethnicity, height, weight, parity, employment, marital status, insurance, income, education, and infant sex. Linear mixed models were used to test for overall differences between the twin and singleton trajectories with the use of likelihood ratio tests of interaction terms between spline mean structure terms and twin-singleton indicator variables. Singleton standards were weighted to correspond to the distribution of maternal race in twins. For those ultrasound measurements in which there were significant global tests for differences between twins and singletons, we tested for week-specific differences using Wald tests that were computed at each gestational age. In a separate analysis, we evaluated the degree of reclassification in small for gestational age, which was defined as <10th percentile that would be introduced if fetal growth estimation for twins was based on an unweighted singleton standard.
Results
Women underwent a median of 5 ultrasound scans. The 50th percentile abdominal circumference and estimated fetal weight trajectories of twin fetuses diverged significantly beginning at 32 weeks of gestation; biparietal diameter in twins was smaller from 34–36 weeks of gestation. There were no differences in head circumference or femur length. The mean head circumference/abdominal circumference ratio was progressively larger for twins compared with singletons beginning at 33 weeks of gestation, which indicated a comparatively asymmetric growth pattern. At 35 weeks of gestation, the average gestational age at delivery for twins, the estimated fetal weights for the 10th, 50th, and 90th percentiles were 1960, 2376, and 2879 g for dichorionic twins, respectively, and 2180, 2567, and 3022 g for the singletons, respectively. At 32 weeks of gestation, the initial week when the mean estimated fetal weight for twins was smaller than that of singletons, 34% of twins would be classified as small for gestational age with the use of a singleton, non-Hispanic white standard. By 35 weeks of gestation, 38% of twins would be classified as small for gestational age.
Conclusion
The comparatively asymmetric growth pattern in twin gestations, initially evident at 32 weeks of gestation, is consistent with the concept that the intrauterine environment becomes constrained in its ability to sustain growth in twin fetuses. Near term, nearly 40% of twins would be classified as small for gestational age based on a singleton growth standard.
Twin gestations represented 3.4% of US births in 2014. The infant mortality rate is higher for twins vs singletons (23.6 vs 5.4 per 1000 live births) as is the rate of cerebral palsy (7 vs 1.6 per 1000 live births). Cross-sectional US natality data demonstrate that, after 28 weeks of gestation, twins are born with lower mean birthweights and that the difference between twins and singletons progressively widens with increasing gestational age, which implies that growth slows at the beginning of the third trimester in twin gestations. However, these findings reflect birth size and do not convey the longitudinal pattern of in utero fetal growth from early in pregnancy. Such cross-sectional studies based on birthweight cannot assess early onset growth abnormalities adequately because the data are biased inherently by preterm deliveries that are associated with complications that may also affect fetal growth or by iatrogenic preterm deliveries that result from suspected growth restriction.
Systematic evaluation and estimation of growth trajectories in twins require ultrasound measurements across gestation. Currently, there are few such data for contemporary populations. Furthermore, no previous study of twins that has been performed in multiple clinical centers with a rigorous design that has included training of sonographers, standardization of ultrasound measurements, and assessment of quality control has been conducted.
Understanding fetal growth in twin gestations is important, given that fetal growth is an influential determinant of health and disease in the perinatal period, childhood, and adult life and that there is uncertainty about whether twin fetal growth should be evaluated similarly to singleton growth. Therefore, in collaboration with 8 institutions, the Eunice Kennedy Shriver National Institute for Child Health and Human Development (NICHD), National Institutes of Health conducted a prospective cohort study of dichorionic twin gestations as a part of the NICHD Fetal Growth Studies. Our objective was to define empirically the predominant trajectory of fetal growth in dichorionic twins using longitudinal 2-dimensional ultrasonography and to compare and contrast the fetal growth trajectories for dichorionic twins with the singleton growth standard that was previously developed by our group.
Materials and Methods
A prospective cohort study was conducted in which women with dichorionic twin gestations, irrespective of the mode of conception, maternal medical history, or obesity status, were enrolled. Heterogeneity of the population’s characteristics in the selection of pregnant women was important to maximize the possibility that factors associated with twin fetal growth could be examined and that the study conclusions would be more generalizable to the population of twins in the United States. Women were enrolled between 8 weeks 0 days and 13 weeks 6 days of gestation. Accurate dating was required for enrollment. Thus, the ultrasound estimate of gestational age had to match the last menstrual period–based gestational age (for the larger twin) according to the following criteria: (1) last menstrual period date and ultrasound date matched within 5 days for gestation estimates between 8 weeks 0 days and 10 weeks 6 days of gestation; (2) 6 days for those between 11 weeks 0 days and 12 weeks 6 days of gestation; and (3) 7 days for those between 13 weeks 0 days and 13 weeks 6 days of gestation. For women with an in vitro fertilization (IVF) conception, a calculated last menstrual period was determined with the date of transfer and embryo age at transfer. Ultrasound determination of chorionicity was established at the initial ultrasound examination. The pregnancy was classified as dichorionic if 2 gestational sacs were present with a thick intervening membrane and twin peak or lambda sign. If chorionicity was unable to be determined, the patient was determined to be ineligible. Chorionicity was confirmed by ultrasound imaging at the subsequent visit. Information on chorionicity was also abstracted from the clinical placenta pathology report.
Inclusion criteria were maternal age 18–45 years and anticipated delivery at the participating hospital. Study participants were excluded if fetal reduction was planned or if the first-trimester sonogram indicated congenital anomalies (structural or chromosomal), increased nuchal translucency (≥3.5 mm) in either twin, monochorionic twins, or crown-rump length discordance >10%, because there is an increased risk of adverse perinatal outcomes with these conditions. Recruitment began February 1, 2012, and continued through January 31, 2013, with final data collection completed on September 30, 2014. Institutional Review Board approval was obtained for the NICHD and all participating clinical institutions and the data and imaging coordinating centers.
A standardized ultrasound protocol was developed, and sonographers underwent extensive training and credentialing to ensure high-quality ultrasound images. All study scans were performed on Voluson E8 machines (GE Healthcare, Milwaukee, WI) with standard operating procedures specified. Study data were collected into a customized application of the ViewPoint clinical system (GE Healthcare) with modifications to meet the study goals and electronically uploaded into a web-based data collection system that is designed for study purposes with the use of Clinical Trial Processor software from the Radiological Society of North America. Measurements subsequently were entered manually into a web-based data collection system.
After written informed consent was obtained, women underwent an enrollment visit. The initial study ultrasound imaging was scheduled between 11 weeks 0 days and 13 weeks 6 days of gestation. First-trimester parameters included crown-rump length, biparietal diameter (BPD), head circumference (HC), abdominal circumference (AC), humerus length (HL), femur length (FL), placental location, determination of chorionicity, and twin designation. Study Twin 1 was defined and labelled as the fetus closest to the cervical os. In-person interviews were conducted to obtain information on sociodemographic characteristics; medical, reproductive, and pregnancy histories, and health and lifestyle behaviors. Women were then assigned randomly to receive sonograms according to 1 of the following 2 schedules: schedule A: 16, 20, 24, 28, 32, and 35 weeks or schedule B: 18, 22, 26, 30, 34, and 36 weeks. Women were expected to have a sonogram scheduled within ±1 week of the targeted gestational age. Women were assigned randomly to 1 of 2 schedules to ensure adequate representation of gestational weeks for statistical modeling. Care was undertaken to allow the research ultrasound images to report to the clinical side if needed, recognizing the high-risk status of twin pregnancies. Follow-up sonograms included core biometric measurements (BPD, HC, AC, FL). The HC/AC ratio was calculated for examination of trends in growth patterns over time. Estimated fetal weight (EFW) was calculated with the Hadlock formula, which incorporates HC, AC, and FL.
Several steps were performed to maintain consistency of study twin designation. At each follow-up visit, a series of identifying information was collated at the end of the examination that included fetal sex, identification of anatomic differences, placental location and cord insertion, fetal position, size, location, and presentation/lie. The list was autopopulated for fetus A or B. The sonographer then assigned each twin to the corresponding Study Twin Identification number (1 or 2) based on information from the previous sonogram. At delivery, care was taken to match same-sex twins with their designation in the longitudinal component of the study with the use of an established protocol: a designation form was completed that collected information on birth date and time, neonatal sex, birthweight, presentation at birth (vertex, breech, or unable to determine), whether an external or internal version was performed before delivery, and identifying anatomic differences. Placental samples, or buccal swabs if the placenta was not available, were obtained for zygosity determination with the use of standard single tandem repeat identifier kits (Applied Biosystems AmpFLSTR Identifiler PCR Amplification Kit; ThermoFisher Scientific, Waltham, MA), for all same-sex twin pairs.
A 10% random sample of ultrasound images was selected for quality control review of core biometrics (CRL, BPD, HC, AC, FL) with the use of a similar approach as the NICHD Fetal Growth Studies: Singletons. The correlation between the expert reviewer and site sonographer was ≥88% for all parameters across visits, with 21 of 26 measures having a correlation of ≥95%, which suggests excellent reliability.
In the descriptive analysis, baseline and clinical data were compared for participants by study cohort with the use of chi-square or t -tests for categoric or continuous data, respectively. All serial ultrasound data were used to estimate fetal individual parameters, the HC/AC ratio, and EFW by gestational age. Ultrasonography measurements (BPD, HC, AC, HL, FL), the HC/AC ratio, and EFW were log-transformed to stabilize variances across gestational ages and to improve normal approximations for the error structures.
The primary analysis compared fetal growth trajectories for dichorionic twins with 1737 singleton gestations that were included in the NICHD Fetal Growth Studies: Singleton standard. Briefly, the singleton standard enrolled low-risk women and excluded women with certain pregnancy complications or infants with neonatal conditions such as anomalies, aneuploidy, and death. For the twin cohort, all of the data that women contributed to the study were included until they were censored by deactivation, pregnancy loss, or delivery. For modeling twin trajectories, we used linear mixed models with a cubic spline mean structure and a random effects structure that included linear, quadratic, and cubic random effects for the twin pair and an intercept term for the individual fetus within twin pair. This hierarchic random effect structure incorporates correlation for both twin-pair and fetus-within-twin pair in the modeling. The linear mixed models were also used to test for overall differences (ie, global tests) between the twin and singleton trajectories (for EFW and other measurements) with the use of likelihood ratio tests of interaction terms between spline mean structure terms and twin-singleton indicator variables. For the cubic spline mean structure, 3-knot points (25th, 50th, and 75th percentiles) were chosen at gestational ages that evenly split the distributions. For an overall comparison between twin and singleton fetal trajectories, the singleton standards were weighted to have the same distribution of race/ethnicity as in the twin sample. For those ultrasound measurements for which there were significant global tests for differences between twins and singletons, we tested for week-specific differences using Wald tests that were computed at each gestational age. These tests were conducted on the estimated curves with and without adjustments for maternal characteristics: age in years, race/ethnicity, height (centimeters) and pregravid weight (kilograms), parity, full-time employment/student status (yes/no), marital status (married/living as married vs not), health insurance (private/managed vs Medicaid/other), income (≤$29,999, $30,000–49,999, $50,000–$74,999, $75,000–$99,999, and ≥$100,000), education (<high school, high school, some college, college undergraduate, and postgraduate college), and infant sex (male or female). We used multiple imputation (with 20 imputations) to account for missing covariates when we performed covariate-adjusted tests for week-specific twin vs singleton differences in fetal growth curves.
Because decreased BPD, despite similar HC measurements in twins compared with singletons, has previously been reported, we examined breech position in relation to BPD by including breech position as a time-dependent covariate in the linear mixed model described earlier. This analysis addresses the question of whether the mean BPD measurement changes because of the breech position of the fetus.
Last, we evaluated the degree of reclassification in small for gestational age (SGA), defined as <10th percentile, that would be introduced if fetal growth estimation for twins was based on an unweighted singleton non-Hispanic white standard similar to our previous study.
To assess the robustness of the findings in a low-risk cohort of twins, we performed a sensitivity analysis that was limited to fetuses from women without any preexisting or obstetric diseases (eg, gestational diabetes mellitus, hypertensive disorders) who were not smoking or drinking during pregnancy and who delivered ≥37 weeks of gestation. We also repeated the EFW comparison with the singleton standard that was limited to dizygotic twin pregnancies, which was defined at birth as unlike-sex or same-sex pairs with dizygosity confirmed by placental pathologic testing. Finally, we compared EFW trajectories for twin pregnancies that were conceived spontaneously, by IVF (excluding donor eggs or embryos), or by other medically assisted reproductive techniques.
A post hoc power analysis demonstrated that we had extremely high power to detect differences. Specifically, with the use of an approximate mean singleton birthweight at 35 weeks of gestation (the average age of delivery of twins) of 2800 g, standard deviation of 440 g, and an assumed conservative 10% increase in standard deviation for twins, we had 95% power for detecting a 5% difference in weight (as a proxy of trajectories) between the cohort of 1731 singletons in the standard cohort and our cohort of 171 pairs of dichorionic twins and a 2-tail probability value at <.05. Further, the aforementioned calculations are extremely conservative because they use a single estimate at birth rather than longitudinal trajectories.
All analyses were implemented with the use of SAS software (version 9.4; SAS Institute, Inc, Cary, NC) or R (version 3.1.2; available at http://www.R-project.org ). Significance was defined by a 2-tail probability value of <.05.
Results
There were 171 women with dichorionic twins who were recruited into the study, of whom 152 (88.9%) delivered 2 live born infants ( Table 1 ; Figure 1 ). The flow diagram for study participants is presented in Figure 1 . Women underwent a median of 5 ultrasound scans. The women with dichorionic twins were primarily non-Hispanic white (54.5%), followed by non-Hispanic black (21.1%), Hispanic (19.3%), and Asian (4.7%) with an average age of 31.6 ± 6.1 years and prepregnancy body mass index of 28.6 ± 7.0 kg/m 2 ( Table 1 ). Most women in the cohort had a college or postgraduate education, a family income of ≥$75,000, and private or managed healthcare insurance and were employed. Conception was spontaneous in 53.2% of the dichorionic twin pregnancies; 26.9% were conceived by IVF without donor eggs or embryos, 7.6% by IVF with donor eggs or embryos, 5.8% by intrauterine insemination, and 6.4% by ovulation induction without IVF or intrauterine insemination. With regard to complications, 5.8% of women had chronic hypertension; 1.8% women had pregestational diabetes mellitus, and 38.0 % women had a prepregnancy body mass index of ≥30 kg/m 2 . The mean ± SD age at delivery was 35.1 ± 4.3 weeks of gestation. There were 15 monozygotic twins (8.8%), 133 dizygotic twins (77.8%), and 23 twins with unknown zygosity (13.5%); the reasons are listed in Table 1 . Placental pathologic information was available for 137 twin pairs (80.1%) and resulted as 134 (97.8%) dichorionic and 3 (2.2%) monochorionic twins.
| Maternal characteristic | Measure |
|---|---|
| Race/ethnicity, n (%) | |
| White/non-Hispanic | 93 (54.5) |
| Black/non-Hispanic | 36 (21.1) |
| Hispanic | 33 (19.3) |
| Asian | 8 (4.7) |
| Multiracial | 1 (0.6) |
| Age, y a | 31.6 ± 6.1 |
| Gravidity, n (%) | |
| 1 | 51 (29.8) |
| 2 | 59 (34.5) |
| ≥3 | 32 (18.7) |
| Parity, n (%) | |
| 0 | 96 (56.1) |
| 1 | 54 (31.6) |
| ≥2 | 21 (12.3) |
| Maternal height, cm a | 165.1 ± 6.4 |
| Prepregnancy weight, self-reported, kg a | 75.4 ± 20.2 |
| Prepregnancy body mass index (kg/m 2 ), n (%) | |
| <25.0 | 67 (39.2) |
| 25.0–29.9 | 39 (22.8) |
| ≥30.0 | 65 (38.0) |
| Mean ± SD | 28.6 ± 7.0 |
| Marital status, n (%) | |
| Never married | 32 (18.7) |
| Married/living as married | 135 (78.9) |
| Divorced/separated/widowed | 4 (2.3) |
| Education, n (%) | |
| <High school | 12 (7.0) |
| High school | 22 (12.9) |
| Some college | 29 (17.0) |
| College undergraduate | 70 (40.9) |
| Postgraduate college | 38 (22.2) |
| Family income, n (%) | |
| ≤$29,999 | 35 (20.5) |
| $30,000–49,999 | 9 (5.3) |
| $50,000–74,999 | 14 (8.2) |
| $75,000–99,999 | 18 (10.5) |
| ≥$100,000 | 79 (46.2) |
| Health insurance, n (%): | |
| Private/managed care | 117 (68.4) |
| Medicaid, other | 40 (23.4) |
| Self-pay | 3 (1.8) |
| Current student, n (%) | |
| Yes | 14 (8.2) |
| No | 157 (91.8) |
| Current paid jobs, n (%) | |
| 0 | 37 (21.6) |
| 1 | 126 (73.7) |
| ≥2 | 8 (4.7) |
| Smoked cigarettes in the past 6 mo, n (%) | |
| Yes | 26 (15.2) |
| No | 144 (84.2) |
| Missing | 1 (0.6) |
| Frequency of alcoholic beverages in the past week, n (%) | |
| ≥5 | 0 |
| 2–4 times | 1 (0.6) |
| Once | 3 (1.8) |
| Not at all | 167 (97.7) |
| Conception by ovulation stimulation drugs or assisted reproductive technology, n (%) | |
| In vitro fertilization | 46 (26.9) |
| Intrauterine insemination | 10 (5.8) |
| Medications without in vitro fertilization or intrauterine insemination | 11 (6.4) |
| Donor eggs, donor embryos | 13 (7.6) |
| None of the above | 91 (53.2) |
| Medical diseases, n (%) | |
| Hypothyroid | 11 (6.4) |
| Hyperthyroid | 0 |
| Pregestational diabetes mellitus | 3 (1.8) |
| Asthma | 15 (8.8) |
| Chronic hypertension | 10 (5.8) |
| Cardiovascular disease | 1 (0.6) |
| Anemia | 17 (9.9) |
| Kidney disease | 0 |
| Autoimmune disease | 6 (3.5) |
| Epilepsy | 1 (0.6) |
| HIV | 1 (0.6) |
| Eating disorder | 3 (1.8) |
| Mood disorder, psychiatric disorder, anxiety or depression | 17 (9.9) |
| Other medical condition | 27 (15.8) |
| Pregnancy outcome(twin/twin), n (%) | |
| Live birth at ≥20 wk/live birth at ≥20 wk | 152 (88.9) |
| Live birth at ≥20 wk/fetal death at ≥ 20 wk | 3 (1.8) |
| Fetal death at ≥20 wk/fetal death at ≥20 wk | 3 (1.8) |
| Fetal death ≥20 wk/miscarriage <20 wk | 1 (0.6) |
| Fetal death, unknown gestational age/fetal death, unknown gestational age | 1 (0.6) |
| Miscarriage at <20 wk/miscarriage at <20 wk | 1 (0.6) |
| Miscarriage/unknown outcome | 1 (0.6) |
| Voluntary termination or fetal reduction/same | 1 (0.6) |
| Voluntary termination or fetal reduction/unknown outcome | 3 (1.8) |
| Unknown outcome/unknown outcome | 5 (2.9) |
| Neonatal sex, n (%) | |
| Singleton male or twins male/male | 45 (26.3) |
| Singleton female or twins female/female | 41 (24.0) |
| Twins male/female | 70 (40.9) |
| Twins male/unknown b | 1 (0.6) |
| Twins unknown c | 14 (8.2) |
| Zygosity (same-sex twins only), n (%) | |
| Monozygotic | 15 (8.8) |
| Dizygotic d | 133 (77.8) |
| Missing with same sex twins e | 8 (4.7) |
| Missing neonatal sex and zygosity | 15 (8.8) |
a Data are given as mean ± standard deviation
b Twin A was an antepartum fetal death, and twin B was a miscarriage at <20 weeks of gestation
c Included 11 women who deactivated from the study; 2 women with live birth of both twins, but neonatal sex not recorded, and 1 pregnancy with no chart review performed; so neonatal outcome and sex unknown
d Includes 70 male and female twin pairs and 63 same sex pairs that resulted as dizygotic by zygosity testing
e Zygosity testing not performed because of miscarriage/death (n = 4), participant refusal (n = 3), or failed DNA extraction because of inadequate sample (n = 1).
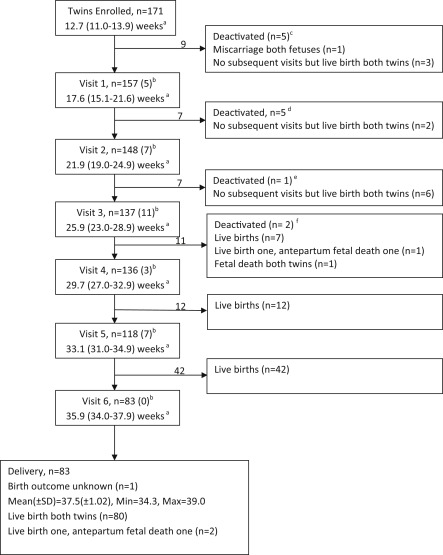
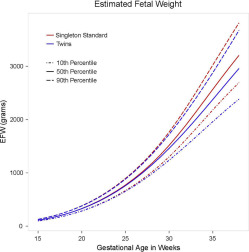
Figure 2 presents the curves for EFW that include the 10th, 50th, and 90th percentiles for dichorionic twins and singletons who were included in the NICHD Fetal Growth Studies: singleton standard. All percentiles for dichorionic twin fetal measurements by gestational age are provided in Table 2 , along with significance testing for pairwise comparisons in Table 3 . Significant differences were observed between the EFW curves for dichorionic twins and singletons ( Figure 2 ; global P < .001). The mean EFW for twins deviated from that of the singletons beginning at 32 weeks of gestation and continued to diverge through 38 weeks of gestation ( Table 3 ). At 32 weeks of gestation, the EFW for the 10th, 50th, and 90th percentiles were 1518, 1807, and 2151 g for dichorionic twins and 1636, 1912, and 2235 g for singletons in the weighted standard, respectively. At 35 weeks of gestation, which is the average age at delivery for twins, the mean EFW for twins was 191 g smaller than singletons ( P < .001), and the 10th percentile was 220 g smaller than singletons (10th, 50th, and 90th percentiles were 1960, 2376, and 2879 g, respectively, for dichorionic twins and 2180, 2567, and 3022 g, respectively, for singletons in the race/ethnicity weighted standard).
| Gestational age, wk | Percentile | ||||
|---|---|---|---|---|---|
| 10th | 25th | 50th | 75th | 90th | |
| Biparietal diameter (mm)–dichorionic twin | |||||
| 11 | 13.6 | 14.2 | 14.9 | 15.6 | 16.3 |
| 12 | 17.2 | 17.9 | 18.8 | 19.7 | 20.5 |
| 13 | 20.9 | 21.7 | 22.7 | 23.8 | 24.7 |
| 14 | 24.5 | 25.5 | 26.6 | 27.8 | 28.9 |
| 15 | 28.0 | 29.1 | 30.4 | 31.6 | 32.9 |
| 16 | 31.4 | 32.6 | 33.9 | 35.3 | 36.6 |
| 17 | 34.6 | 35.8 | 37.3 | 38.8 | 40.2 |
| 18 | 37.8 | 39.1 | 40.6 | 42.2 | 43.7 |
| 19 | 40.9 | 42.3 | 43.9 | 45.6 | 47.1 |
| 20 | 43.9 | 45.4 | 47.1 | 48.8 | 50.5 |
| 21 | 46.9 | 48.5 | 50.2 | 52.1 | 53.8 |
| 22 | 49.8 | 51.4 | 53.3 | 55.2 | 57 |
| 23 | 52.7 | 54.4 | 56.3 | 58.3 | 60.1 |
| 24 | 55.5 | 57.3 | 59.3 | 61.3 | 63.3 |
| 25 | 58.3 | 60.1 | 62.2 | 64.4 | 66.4 |
| 26 | 61.0 | 62.9 | 65.1 | 67.3 | 69.4 |
| 27 | 63.7 | 65.6 | 67.9 | 70.2 | 72.4 |
| 28 | 66.2 | 68.2 | 70.6 | 73.0 | 75.3 |
| 29 | 68.6 | 70.7 | 73.1 | 75.7 | 78.0 |
| 30 | 70.8 | 73.0 | 75.5 | 78.2 | 80.6 |
| 31 | 72.8 | 75.1 | 77.7 | 80.4 | 82.9 |
| 32 | 74.7 | 77.0 | 79.7 | 82.5 | 85.1 |
| 33 | 76.4 | 78.8 | 81.5 | 84.4 | 87.1 |
| 34 | 77.9 | 80.4 | 83.2 | 86.1 | 88.9 |
| 35 | 79.3 | 81.9 | 84.8 | 87.8 | 90.6 |
| 36 | 80.7 | 83.3 | 86.3 | 89.4 | 92.3 |
| 37 | 82.0 | 84.7 | 87.8 | 91 | 93.9 |
| 38 | 83.3 | 86.1 | 89.3 | 92.6 | 95.7 |
| Head circumference (mm) – dichorionic twin | |||||
| 11 | 52.8 | 55.0 | 57.5 | 60.1 | 62.5 |
| 12 | 65.4 | 68.0 | 70.9 | 74.0 | 76.8 |
| 13 | 78.3 | 81.3 | 84.7 | 88.2 | 91.5 |
| 14 | 91.3 | 94.5 | 98.3 | 102.3 | 105.9 |
| 15 | 103.9 | 107.5 | 111.6 | 115.9 | 119.9 |
| 16 | 116.1 | 120.0 | 124.4 | 129.0 | 133.3 |
| 17 | 128.0 | 132.1 | 136.8 | 141.7 | 146.2 |
| 18 | 139.9 | 144.2 | 149.1 | 154.2 | 158.9 |
| 19 | 151.6 | 156 | 161.2 | 166.5 | 171.4 |
| 20 | 163.1 | 167.7 | 173 | 178.5 | 183.6 |
| 21 | 174.4 | 179.2 | 184.7 | 190.3 | 195.5 |
| 22 | 185.5 | 190.4 | 196.0 | 201.8 | 207.2 |
| 23 | 196.3 | 201.4 | 207.2 | 213.2 | 218.7 |
| 24 | 207.1 | 212.3 | 218.2 | 224.3 | 230 |
| 25 | 217.7 | 223.0 | 229.1 | 235.4 | 241.2 |
| 26 | 228.0 | 233.5 | 239.8 | 246.3 | 252.2 |
| 27 | 238.1 | 243.8 | 250.2 | 256.9 | 263 |
| 28 | 247.7 | 253.6 | 260.3 | 267.1 | 273.4 |
| 29 | 256.9 | 262.9 | 269.8 | 276.9 | 283.4 |
| 30 | 265.4 | 271.7 | 278.8 | 286.1 | 292.9 |
| 31 | 273.3 | 279.7 | 287.1 | 294.7 | 301.6 |
| 32 | 280.4 | 287.1 | 294.7 | 302.6 | 309.8 |
| 33 | 286.9 | 293.8 | 301.7 | 309.8 | 317.3 |
| 34 | 292.7 | 299.9 | 308.1 | 316.4 | 324.2 |
| 35 | 298.0 | 305.4 | 313.8 | 322.5 | 330.5 |
| 36 | 302.8 | 310.4 | 319.1 | 328.1 | 336.4 |
| 37 | 307.0 | 315.0 | 324.0 | 333.3 | 341.9 |
| 38 | 310.9 | 319.1 | 328.5 | 338.3 | 347.2 |
| Abdominal circumference (mm)–dichorionic twin | |||||
| 11 | 38.9 | 41.2 | 43.9 | 46.8 | 49.6 |
| 12 | 48.7 | 51.5 | 54.8 | 58.3 | 61.6 |
| 13 | 59.1 | 62.4 | 66.3 | 70.4 | 74.3 |
| 14 | 70.0 | 73.8 | 78.2 | 82.9 | 87.4 |
| 15 | 81.0 | 85.2 | 90.2 | 95.6 | 100.6 |
| 16 | 92.0 | 96.7 | 102.3 | 108.1 | 113.7 |
| 17 | 103.0 | 108.2 | 114.2 | 120.6 | 126.7 |
| 18 | 114.0 | 119.6 | 126.2 | 133.1 | 139.6 |
| 19 | 125.0 | 131.0 | 138 | 145.4 | 152.4 |
| 20 | 135.9 | 142.3 | 149.8 | 157.6 | 165 |
| 21 | 146.5 | 153.3 | 161.2 | 169.6 | 177.4 |
| 22 | 157.0 | 164.1 | 172.5 | 181.2 | 189.5 |
| 23 | 167.2 | 174.7 | 183.5 | 192.7 | 201.4 |
| 24 | 177.2 | 185.1 | 194.3 | 204.0 | 213.1 |
| 25 | 187.2 | 195.4 | 205.1 | 215.2 | 224.7 |
| 26 | 197.0 | 205.6 | 215.7 | 226.2 | 236.2 |
| 27 | 206.6 | 215.6 | 226.1 | 237.1 | 247.5 |
| 28 | 216.0 | 225.4 | 236.4 | 247.9 | 258.7 |
| 29 | 225.2 | 235.0 | 246.5 | 258.4 | 269.7 |
| 30 | 234.3 | 244.5 | 256.4 | 268.8 | 280.6 |
| 31 | 243.1 | 253.8 | 266.1 | 279.1 | 291.3 |
| 32 | 251.8 | 262.9 | 275.7 | 289.2 | 301.9 |
| 33 | 260.4 | 271.8 | 285.2 | 299.2 | 312.3 |
| 34 | 268.7 | 280.6 | 294.4 | 309.0 | 322.6 |
| 35 | 276.9 | 289.2 | 303.6 | 318.6 | 332.8 |
| 36 | 284.9 | 297.7 | 312.5 | 328.2 | 342.9 |
| 37 | 292.7 | 306.0 | 321.4 | 337.6 | 352.9 |
| 38 | 300.2 | 314.0 | 330.1 | 347.0 | 363.0 |
| Femur length (mm) – dichorionic twin | |||||
| 11 | 3.5 | 3.8 | 4.1 | 4.4 | 4.8 |
| 12 | 5.6 | 6.0 | 6.5 | 7.0 | 7.5 |
| 13 | 8.3 | 8.8 | 9.5 | 10.2 | 10.9 |
| 14 | 11.2 | 11.9 | 12.8 | 13.7 | 14.5 |
| 15 | 14.3 | 15.2 | 16.1 | 17.2 | 18.2 |
| 16 | 17.4 | 18.3 | 19.4 | 20.6 | 21.7 |
| 17 | 20.3 | 21.4 | 22.6 | 23.9 | 25.1 |
| 18 | 23.3 | 24.4 | 25.7 | 27.1 | 28.4 |
| 19 | 26.2 | 27.4 | 28.8 | 30.3 | 31.6 |
| 20 | 29.0 | 30.3 | 31.8 | 33.3 | 34.8 |
| 21 | 31.7 | 33.0 | 34.6 | 36.2 | 37.8 |
| 22 | 34.2 | 35.6 | 37.3 | 39.0 | 40.6 |
| 23 | 36.6 | 38.1 | 39.8 | 41.7 | 43.4 |
| 24 | 38.9 | 40.5 | 42.3 | 44.3 | 46.1 |
| 25 | 41.1 | 42.8 | 44.7 | 46.8 | 48.7 |
| 26 | 43.2 | 45.0 | 47.1 | 49.3 | 51.3 |
| 27 | 45.3 | 47.2 | 49.4 | 51.7 | 53.9 |
| 28 | 47.3 | 49.3 | 51.6 | 54 | 56.3 |
| 29 | 49.2 | 51.3 | 53.7 | 56.3 | 58.7 |
| 30 | 51.1 | 53.3 | 55.8 | 58.5 | 61.0 |
| 31 | 52.9 | 55.2 | 57.8 | 60.6 | 63.2 |
| 32 | 54.7 | 57.1 | 59.8 | 62.6 | 65.3 |
| 33 | 56.5 | 58.9 | 61.6 | 64.6 | 67.3 |
| 34 | 58.2 | 60.6 | 63.5 | 66.4 | 69.3 |
| 35 | 59.8 | 62.3 | 65.2 | 68.3 | 71.1 |
| 36 | 61.3 | 63.9 | 66.9 | 70.0 | 73.0 |
| 37 | 62.8 | 65.4 | 68.5 | 71.8 | 74.8 |
| 38 | 64.0 | 66.8 | 70.1 | 73.5 | 76.7 |
| Humerus length (mm) – dichorionic twin | |||||
| 11 | 3.5 | 3.8 | 4.1 | 4.5 | 4.8 |
| 12 | 5.9 | 6.3 | 6.8 | 7.3 | 7.8 |
| 13 | 8.7 | 9.3 | 10.0 | 10.7 | 11.4 |
| 14 | 11.8 | 12.5 | 13.4 | 14.4 | 15.3 |
| 15 | 14.9 | 15.8 | 16.8 | 17.9 | 18.9 |
| 16 | 17.8 | 18.8 | 19.9 | 21.1 | 22.3 |
| 17 | 20.5 | 21.6 | 22.8 | 24.1 | 25.4 |
| 18 | 23.2 | 24.3 | 25.6 | 27.0 | 28.3 |
| 19 | 25.8 | 26.9 | 28.3 | 29.7 | 31.1 |
| 20 | 28.2 | 29.4 | 30.9 | 32.4 | 33.7 |
| 21 | 30.5 | 31.8 | 33.3 | 34.8 | 36.3 |
| 22 | 32.7 | 34.0 | 35.5 | 37.1 | 38.6 |
| 23 | 34.7 | 36.1 | 37.7 | 39.3 | 40.8 |
| 24 | 36.7 | 38.1 | 39.7 | 41.4 | 43.0 |
| 25 | 38.5 | 40.0 | 41.7 | 43.5 | 45.1 |
| 26 | 40.2 | 41.8 | 43.6 | 45.4 | 47.2 |
| 27 | 41.9 | 43.5 | 45.4 | 47.4 | 49.2 |
| 28 | 43.5 | 45.2 | 47.1 | 49.2 | 51.1 |
| 29 | 44.9 | 46.7 | 48.8 | 51.0 | 53.0 |
| 30 | 46.4 | 48.2 | 50.4 | 52.7 | 54.8 |
| 31 | 47.7 | 49.7 | 52.0 | 54.3 | 56.6 |
| 32 | 49.1 | 51.1 | 53.5 | 55.9 | 58.2 |
| 33 | 50.3 | 52.4 | 54.9 | 57.4 | 59.9 |
| 34 | 51.5 | 53.7 | 56.2 | 58.9 | 61.4 |
| 35 | 52.7 | 54.9 | 57.6 | 60.3 | 62.8 |
| 36 | 53.8 | 56.1 | 58.8 | 61.6 | 64.2 |
| 37 | 54.8 | 57.2 | 60.0 | 62.9 | 65.6 |
| 38 | 55.8 | 58.2 | 61.1 | 64.1 | 66.9 |
| Estimated fetal weight (g)– dichorionic twin | |||||
| 15 | 97.0 | 103.7 | 111.7 | 120.3 | 128.6 |
| 16 | 122.6 | 131.1 | 141.2 | 152.1 | 162.6 |
| 17 | 153.7 | 164.4 | 177.1 | 190.7 | 204.0 |
| 18 | 190.6 | 203.9 | 219.7 | 236.7 | 253.2 |
| 19 | 233.8 | 250.2 | 269.7 | 290.7 | 311.0 |
| 20 | 283.9 | 303.8 | 327.6 | 353.2 | 378.0 |
| 21 | 341.2 | 365.4 | 394.1 | 425.2 | 455.2 |
| 22 | 406.4 | 435.4 | 469.9 | 507.3 | 543.4 |
| 23 | 479.8 | 514.3 | 555.6 | 600.1 | 643.3 |
| 24 | 561.9 | 602.8 | 651.7 | 704.5 | 755.8 |
| 25 | 653.0 | 701.1 | 758.7 | 821.1 | 881.6 |
| 26 | 753.0 | 809.3 | 876.9 | 950.1 | 1021.2 |
| 27 | 861.8 | 927.5 | 1006.2 | 1091.7 | 1174.8 |
| 28 | 979.1 | 1055.1 | 1146.6 | 1245.9 | 1342.7 |
| 29 | 1104.2 | 1191.9 | 1297.5 | 1412.4 | 1524.6 |
| 30 | 1236.4 | 1337.0 | 1458.4 | 1590.8 | 1720.2 |
| 31 | 1374.7 | 1489.6 | 1628.5 | 1780.4 | 1929.2 |
| 32 | 1517.8 | 1648.4 | 1806.7 | 1980.2 | 2150.6 |
| 33 | 1664.2 | 1812.0 | 1991.6 | 2189.1 | 2383.5 |
| 34 | 1812.3 | 1978.8 | 2181.8 | 2405.7 | 2626.7 |
| 35 | 1960.3 | 2147.1 | 2375.5 | 2628.3 | 2878.6 |
| 36 | 2106.4 | 2314.9 | 2570.9 | 2855.1 | 3137.8 |
| 37 | 2248.1 | 2480 | 2765.9 | 3084.7 | 3402.9 |
| 38 | 2382.5 | 2639.8 | 2958.4 | 3315.5 | 3673.5 |
| Head circumference/abdominal circumference– dichorionic twin | |||||
| 11 | 1.187 | 1.242 | 1.306 | 1.373 | 1.437 |
| 12 | 1.18 | 1.233 | 1.294 | 1.359 | 1.419 |
| 13 | 1.167 | 1.218 | 1.277 | 1.34 | 1.398 |
| 14 | 1.152 | 1.201 | 1.258 | 1.318 | 1.374 |
| 15 | 1.135 | 1.182 | 1.237 | 1.295 | 1.349 |
| 16 | 1.118 | 1.163 | 1.217 | 1.272 | 1.324 |
| 17 | 1.102 | 1.146 | 1.197 | 1.251 | 1.301 |
| 18 | 1.088 | 1.131 | 1.181 | 1.233 | 1.282 |
| 19 | 1.076 | 1.118 | 1.167 | 1.217 | 1.265 |
| 20 | 1.065 | 1.107 | 1.155 | 1.204 | 1.251 |
| 21 | 1.057 | 1.097 | 1.144 | 1.193 | 1.239 |
| 22 | 1.049 | 1.089 | 1.136 | 1.184 | 1.23 |
| 23 | 1.042 | 1.082 | 1.128 | 1.177 | 1.222 |
| 24 | 1.036 | 1.076 | 1.122 | 1.17 | 1.215 |
| 25 | 1.031 | 1.071 | 1.116 | 1.164 | 1.209 |
| 26 | 1.026 | 1.066 | 1.111 | 1.159 | 1.203 |
| 27 | 1.021 | 1.06 | 1.106 | 1.153 | 1.198 |
| 28 | 1.015 | 1.055 | 1.100 | 1.148 | 1.192 |
| 29 | 1.009 | 1.048 | 1.094 | 1.141 | 1.186 |
| 30 | 1.002 | 1.041 | 1.086 | 1.134 | 1.178 |
| 31 | 0.993 | 1.033 | 1.078 | 1.125 | 1.169 |
| 32 | 0.984 | 1.023 | 1.068 | 1.115 | 1.159 |
| 33 | 0.973 | 1.012 | 1.057 | 1.103 | 1.147 |
| 34 | 0.962 | 1.001 | 1.045 | 1.092 | 1.135 |
| 35 | 0.951 | 0.989 | 1.033 | 1.079 | 1.122 |
| 36 | 0.939 | 0.977 | 1.021 | 1.067 | 1.11 |
| 37 | 0.928 | 0.966 | 1.009 | 1.055 | 1.098 |
| 38 | 0.916 | 0.954 | 0.998 | 1.044 | 1.087 |
| Femoral length/abdominal circumference – dichorionic twin | |||||
| 11 | 0.079 | 0.086 | 0.093 | 0.102 | 0.11 |
| 12 | 0.102 | 0.11 | 0.119 | 0.129 | 0.139 |
| 13 | 0.124 | 0.133 | 0.143 | 0.154 | 0.165 |
| 14 | 0.142 | 0.152 | 0.163 | 0.175 | 0.187 |
| 15 | 0.157 | 0.167 | 0.179 | 0.191 | 0.203 |
| 16 | 0.168 | 0.178 | 0.190 | 0.202 | 0.214 |
| 17 | 0.176 | 0.186 | 0.197 | 0.210 | 0.222 |
| 18 | 0.182 | 0.192 | 0.204 | 0.216 | 0.228 |
| 19 | 0.187 | 0.197 | 0.208 | 0.221 | 0.232 |
| 20 | 0.190 | 0.200 | 0.212 | 0.224 | 0.236 |
| 21 | 0.193 | 0.203 | 0.214 | 0.226 | 0.238 |
| 22 | 0.195 | 0.204 | 0.216 | 0.228 | 0.239 |
| 23 | 0.196 | 0.205 | 0.217 | 0.229 | 0.240 |
| 24 | 0.196 | 0.206 | 0.217 | 0.229 | 0.241 |
| 25 | 0.196 | 0.206 | 0.218 | 0.23 | 0.241 |
| 26 | 0.196 | 0.206 | 0.218 | 0.23 | 0.242 |
| 27 | 0.196 | 0.206 | 0.218 | 0.23 | 0.242 |
| 28 | 0.196 | 0.206 | 0.218 | 0.23 | 0.242 |
| 29 | 0.196 | 0.206 | 0.218 | 0.23 | 0.242 |
| 30 | 0.195 | 0.205 | 0.217 | 0.23 | 0.242 |
| 31 | 0.195 | 0.205 | 0.217 | 0.229 | 0.241 |
| 32 | 0.194 | 0.204 | 0.216 | 0.229 | 0.241 |
| 33 | 0.194 | 0.204 | 0.216 | 0.228 | 0.240 |
| 34 | 0.193 | 0.203 | 0.215 | 0.227 | 0.239 |
| 35 | 0.193 | 0.203 | 0.214 | 0.227 | 0.238 |
| 36 | 0.192 | 0.202 | 0.213 | 0.226 | 0.238 |
| 37 | 0.191 | 0.201 | 0.213 | 0.225 | 0.237 |
| 38 | 0.190 | 0.200 | 0.212 | 0.225 | 0.236 |
Stay updated, free articles. Join our Telegram channel

Full access? Get Clinical Tree


