Female Infertility
 |
Infertility is generally defined as one year of unprotected intercourse without conception.1 Some prefer the term subfertility to describe women or couples who are not sterile but exhibit decreased reproductive efficiency. Approximately 85-90% of healthy young couples conceive within 1 year, most within 6 months.2,3 Infertility therefore affects approximately 10-15% of couples and is an important part of the practice of many clinicians. Cycle fecundability is the probability that a cycle will result in pregnancy and fecundity is the probability that a cycle will result in a live birth.
Contrary to popular perception, the overall incidence of infertility has remained relatively unchanged over the past 3 decades. However, the evaluation and treatment of infertility have changed dramatically during that time. Three major developments have had the greatest impact. First was the introduction of in vitro fertilization (IVF) and other assisted reproductive technologies (ART). ART techniques have provided the means to study reproductive processes in new and more revealing ways and have markedly improved the prognosis for a great many infertile couples, particularly those whose infertility relates to severe tubal damage or male factors. Second, changes in population demographics have resulted in greater numbers of women attempting pregnancy at older ages when they are inherently less biologically fertile. Third, advances in ART and concerns about the age-related decline in fertility have combined to attract greater media attention and to raise public awareness of infertility and modern treatments. Consequently, infertile couples are now more likely to seek medical advice, evaluation, and treatment.
The Epidemiology of Infertility in the U.S.
The first U.S. census was in 1790. At that time, the crude birth rate was 55 per 1,000 total population; in 2007, it was 14.3 per 1,000,4 representing nearly a 75% decline over the past 200-plus years. The crude birth rate in 2007 was 15% lower than in 1990 (16.7 per 1,000 population), but increased from 2002 (13.9 per 1,000), which was a record low for the nation.5 The general fertility rate (births per 1,000 women aged 15-44) in 2007 was 69.5, 2% lower than in 1990 (70.9/1,000), 11% lower than in 1970 (87.9/1,000), and 35% lower than in 1950 (106.2/1,000) during the post-war “baby boom.”4,6,7 The general fertility rate in 2007 was the highest since 1990.
The overall long-term decline in U.S. birth and fertility rates has been attributed to several factors.
Greater interest in advanced education and careers among women.
Later marriage and more frequent divorce.
Improvements in contraception and access to family planning services.
Delayed childbearing.
Decreased family size.
Attitudes towards women and among women in our society have changed dramatically in many ways over the past 30 years. Expanding opportunities have increased interests in advanced education and careers among women. U.S. census data indicate that in 1970, only 8.2% of women age 25 and older had completed 4 or more years of college; by 2001, that proportion had tripled (24.3%).8 Women have represented the majority of college students in the U.S. since 1979. In recent years, the majority of bachelor’s and more advanced degrees have been awarded to women. The proportion of U.S. women with infant children in the work force has steadily increased, from 31% in 1976 to 55% in 2000.8 In 2006, 85% of all women ages 15 to 44 years were in the labor force.9
Greater focus on education and careers among women triggered other trends in modern society. Less frequent and later marriage and more frequent divorce were among the most striking. First marriage rates in the U.S. peaked after World War II, between 1945 and 1947 (143 per 1,000 single women aged 15-44), and declined about 15% every 10 years and approximately 50% overall over the next 5 decades.10 The median age at first marriage for women has risen steadily since 1960 (20.3 years) and reached an all-time high in 2007 (26.0 years). The probability of future marriage for women decreases as age increases: 84% at age 25, 72% at age 30, 52% at age 35, and 41% at age 40.11 If and when women do marry, they also are more likely to divorce than in the past.10,11,12 and 13 Divorce rates among women of reproductive age rose quickly after 1960 to more than double by 1980 (40 per 1,000 married women aged 15-44) and have declined only slightly over the last 30 years. The National Center for Health Statistics estimates that approximately one-third of new marriages among younger people will end in divorce within 10 years and 43% within 15 years. Once-married women also are increasingly less likely to remarry. Remarriage rates peaked in 1968 (166 per 1,000 divorces or widowed women aged 15-44) as divorce rates began to rise, but have since declined steadily by more than one-third, in parallel with first marriage rates.10,11,12 and 13
The post-war “baby boom” generation, those born between 1946 and 1964, was the first to be afforded the means to safely and effectively control their fertility. Expanding contraceptive options and access to family planning and legalized abortion services over the past 5 decades definitely have contributed to declining U.S. birth and fertility rates. Their effects have been direct, by reducing the number of unplanned pregnancies and births, and indirect, by helping women to avoid pregnancy until their education and career goals were met, and marriage and family become a priority.
The net result of all of these societal changes was a trend to delayed childbearing among American women. The mean age at first live birth has risen steadily, from 21.4 years in 1970 to an all-time high 25.2 years in 2004 (3.8 years and 18% higher). The percentage of first births occurring to women aged 30 or older increased more than 6-fold between 1970 and 2002.14 Mean ages for all subsequent live births increased as well; the increase in mean age was greatest (3.6 years) for the second live birth (27.7 years), and lower for the third (2.5 years), fourth (1.6 years), and fifth births (0.4 years).15 Between 1970 and 2007, birth rates fell for women ages 15-19 (68.3 vs. 42.5/1,000), 20-24 (167.8 vs. 106.4/1,000), and those 25-29 (145.1 vs. 117.5/1,000), and increased for women aged 30-34 (73.3 vs. 99.9/1,000), 35-39 (31.7 vs. 47.5/1,000), and those aged 40-44 (8.1 vs. 9.5/1,000).4,7,16 Predictably, increasing age at first birth and declining fertility rates combined to result in fewer births per woman. At the height of the postwar baby boom, the U.S. total fertility rate (births by age 45) reached a modern high of 3.7 births per woman (1957). Thereafter, the total fertility rate declined to a low of 1.8 in 1976, rose slightly to 2.1 in 2001,7 and has remained stable since.4 The total fertility rates in some European countries are significantly lower (Italy, 1.33; Greece, 1.29; Spain, 1.32), and inadequate even to ensure replacement of the population.17
The larger number of women born during the postwar baby boom increased markedly the absolute numbers of women with impaired fertility. Over a 20-year interval, a large population of women was attempting pregnancy, often for the first time, when older and less biologically fertile. Whereas in the past many such women might have chosen to adopt, the availability of legal abortion services and society’s increasing acceptance of single parenthood greatly reduced the number of infants available for adoption. Women were more likely to seek infertility services, and more likely to pursue the most aggressive forms of treatment, because they offered the greatest probability for success. Now, even the youngest “boomers” are over age 45 and have completed childbearing. In 2000, the median age of the U.S. population was 35.3 years and 16% of people were between the ages of 35 and 44, representing the largest 10-year age segment of the entire population. That same year, 14.2% of the population was 25-34 years of age, 13.9% was 15-24 years, and 14.6% was 5-14 years. Even barring any changes in the causes and prevalence of infertility, the absolute numbers of infertile women in the U.S. can be expected to decline in the years ahead.
Trends in the incidence of infertility among U.S. women have been difficult to define confidently, partly due to confusion over the use of two different measures—impaired fecundity, and infertility, which are defined differently, describe different populations, and can yield conflicting data.18,19 However, evidence indicates that the incidence of infertility in the U.S. now is declining.20 The earliest national estimate of infertility, from the 1965 National Survey of Family Growth (NSFG), was 11.2%. In 1982, 8.5% of married American women were infertile, and in 2002, 7.4% were infertile, representing a 10% decrease over the intervening 20 years.20 Although the explanation is not entirely clear, the percentage of women ever treated for pelvic inflammatory disease also decreased steadily, from 17.1% in 1982 to 12.0% in 1988, to 8.2% in 1995, to 5.7% in 2002.20 In a 2007 analysis of data derived from 25 population surveys sampling 172,413 women, the median international prevalence of infertility (12 months) among women ages 20-44 years was 9% (range 3.5% to 16.7%).21
The array of infertility services, and their availability, has increased dramatically over the last 25 years. Clinicians have become more aware of infertility and better trained to evaluate and treat its causes. The public too has a greater awareness of infertility and modern treatments, largely due to the increased media attention, good and bad, surrounding the advances and controversies relating to assisted reproductive technologies (ART). As infertility has become more visible, and more socially acceptable, couples have become less reluctant to seek evaluation and treatment.
According to data derived from the National Survey of Family Growth (NSFG) conducted in 1995, 9.3 million women ages 15-44 (15%) had ever received infertility services, an increase from 6.6 million women (12%) in 1982.22 These data indicated that the demand
for infertility services increased during the 1980s and early 1990s, corresponding to the aging of baby boomers and the time when the availability of ART was rapidly expanding. Compared to the general population, women seeking infertility services were more likely to be older (aged 35-44 years; 43% vs. 36%) nulliparous (36% vs. 16%), married (79% vs. 64%), relatively affluent (61% vs. 51%), and to have health care insurance (83% vs. 74%).22 Among those who received infertility services, 35% had used ovulation-inducing drugs and 1.6 % had undergone some form of ART. In the 2002 NSFG, 7.3 million women ages 15-44 reported ever having used infertility services, representing a significant decrease of approximately 20% since 1995.23 Advice (74%) and testing (59%) were the most common types of services received, and nearly half reported receiving drugs to improve ovulation.24
for infertility services increased during the 1980s and early 1990s, corresponding to the aging of baby boomers and the time when the availability of ART was rapidly expanding. Compared to the general population, women seeking infertility services were more likely to be older (aged 35-44 years; 43% vs. 36%) nulliparous (36% vs. 16%), married (79% vs. 64%), relatively affluent (61% vs. 51%), and to have health care insurance (83% vs. 74%).22 Among those who received infertility services, 35% had used ovulation-inducing drugs and 1.6 % had undergone some form of ART. In the 2002 NSFG, 7.3 million women ages 15-44 reported ever having used infertility services, representing a significant decrease of approximately 20% since 1995.23 Advice (74%) and testing (59%) were the most common types of services received, and nearly half reported receiving drugs to improve ovulation.24
Aging and Fertility
The effects of aging on female fertility are perhaps best revealed by the results of studies in “natural” populations wherein couples reproduce without voluntary restrictions;25 the Hutterites in North America are a classic example. Contraception is condemned in the sect, which emigrated originally from Switzerland in the 16th century and settled ultimately in communal colonies in South Dakota in the late 19th century. Studies of fertility in the Hutterites illustrate how fertility declines with advancing age.26 Whereas only 2.4% of Hutterite women were infertile, 11% bore no children after age 34, 33% were infertile by age 40, and 87% were infertile at age 45. Although revealing, these and other data derived from studies in natural populations may not reflect true biologic reproductive potential, for several reasons:
Women who have children when young may be less inclined to conceive again in later life.
Coital frequency often declines as age increases, reflecting decreasing desire or lack of a partner.
The incidence of subclinical abortion is unknown.
The cumulative impact of other diseases or conditions that can adversely affect fertility (e.g, pelvic infections, leiomyomata, endometriosis) is greater in older women.
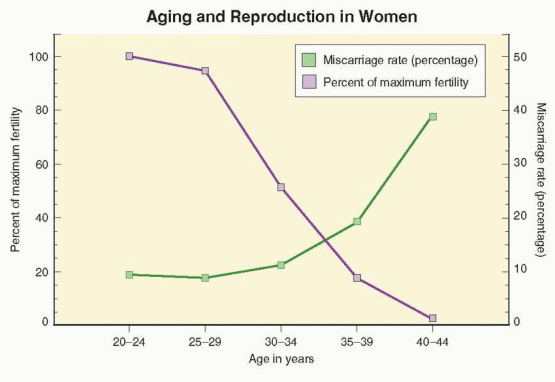
Taken together, data from studies in the Hutterites and other natural populations suggest that fertility in women peaks between the ages of 20 and 24, decreases relatively little until approximately age 30 to 32, and then declines progressively. Overall, fertility rates are 4-8% lower in women aged 25-29 years, 15-19% lower in those aged 30-34, 26-46% lower in women aged 35-39, and as much as 95% lower for women aged 40-45 years.27,28 Variations in fertility rates among natural populations could reflect differences in genetic factors or socio-economic conditions at different times and in different places.
Other evidence for the adverse effect of aging on fertility derives from numerous studies of cumulative conception rates among women attempting pregnancy by artificial insemination with donor sperm. Data from donor insemination studies are informative because the women enrolled are less likely to have other infertility factors, and because carefully timed inseminations eliminate the confounding effects of decreasing coital frequency with increasing age. In a French study involving more than 2,000 women across up to 12 insemination cycles, conception rates were highest in those age 25 or younger (73%) and ages 26-30 (74%), 16% lower (62%) in women aged 31-35, and 27% lower in those over age 35 (54%).29 An American donor insemination study yielded similar results, observing lower overall conception rates and a 2-fold higher number of inseminations per conception in women over age 35.30 A Dutch study observed that the probability of a healthy live birth decreased by approximately 3.5% per year after age 30.28 In a large British study of nearly 3,000 donor insemination cycles from a single center, cumulative conception rates
in women over age 30 were 20-35% lower than in younger women after 3 (17% vs. 21%), 6 (26% vs. 40%), and 12 insemination cycles (44% vs. 62%).31
in women over age 30 were 20-35% lower than in younger women after 3 (17% vs. 21%), 6 (26% vs. 40%), and 12 insemination cycles (44% vs. 62%).31
Success rates achieved with ART also decline as age increases. The numbers of oocytes retrieved and embryos available are lower, embryo fragmentation rates are higher, and implantation rates are lower in older than in younger women.32,33 Although ART pregnancy rates have increased steadily over the past 20 years for women in all age groups, annual reports derived from registry data collected by the Centers for Disease Control and Prevention (CDC) in the U.S. since 1989 demonstrate consistently that age is the single most important factor affecting the probability of success with ART. Pregnancy and live birth rates for ART cycles using fresh, non-donor eggs or embryos vary little for women under age 32, but thereafter decrease steadily in an almost linear fashion as age increases. Regardless whether success rates are calculated per cycle, per oocyte retrieval, or per embryo transfer, the result is the same. In the 2007 U.S. national summary, the live birth rate per embryo transfer was 45.9% for women under age 35, 36.9% for ages 35-37, 27.1% for ages 38-40, 16.0% for ages 41-42, and 8.4% for women aged 43-44 years.34
The age-related decline in ART live birth rates reflects not only decreasing fertility, but also increasing pregnancy wastage. Just as fertility decreases with increasing age, the incidence of clinically recognized miscarriage rises as age advances. Miscarriage rates in natural conception cycles are generally low before age 30 (7-15%) and rise with age, only slightly for ages 30-34 (8-21%), but to a greater extent for ages 35-39 (17-28%) and ages 40 and older (34-52%).27,35,36 and 37 The same pattern is observed in pregnancies resulting from ART. In the 2007 U.S. national summary of IVF outcomes, miscarriage rates were below 15% for women under age 35, almost 30% at age 40, and over 50% for women age 44 and older.34 Longitudinal studies of healthy young women wherein daily urine samples were monitored for the appearance of human chorionic gonadotropin (hCG) have revealed that true spontaneous miscarriage rates (also including clinically unrecognized “biochemical” pregnancies) are substantially higher.38,39 and 40 Up to 60% of all conceptions miscarry within the first 12 weeks of gestation and 20-40% of all early pregnancy losses go unrecognized. Whether the incidence of occult early pregnancy loss also is higher in older women than young women has not been determined. If so, the relationship between true spontaneous miscarriage rates and age may be even more dramatic. Even if not, the overall miscarriage risk (recognized and unrecognized) in women over age 40 approaches or exceeds 75%.39,41
 |
Physiology of Reproductive Aging
Established societal trends toward delayed childbearing and the age-related decrease in female fertility have focused a great deal of attention on the physiology of reproductive aging. Consequently, our understanding of the mechanisms that govern the pace of follicular depletion, the endocrinology of reproductive aging, and age-related changes in follicular dynamics and oocyte quality has advanced greatly over the past 20 years. We long ago recognized the changes in menstrual cycle characteristics that accompany advancing age, but now much better understand the mechanisms responsible for those changes. We long ago recognized that fertility declines as age increases, but now have measures of reproductive aging that help to guide our efforts to overcome its limitations. We know that we cannot prevent aging, but now can better help women to set and to realize their reproductive goals.
Follicular Depletion
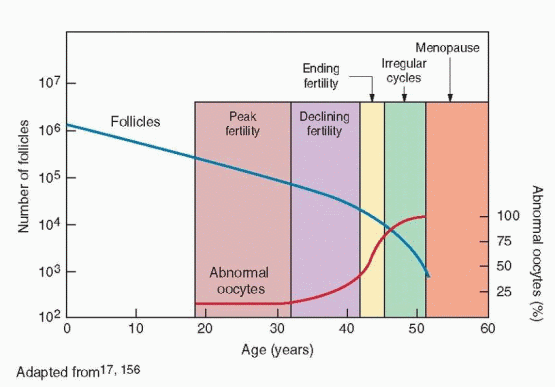
During fetal life, germ cells rapidly proliferate by mitosis to yield approximately 6-7 million oogonia by 16-20 weeks of pregnancy.42,43 and 44 From that point on, the germ cell population begins an inexorable decline mediated primary by gene-regulated apoptosis.45 After entering the first meiotic division and becoming oocytes, the number of germ cells falls to between 1 and 2 million at birth,46 and to about 300,000 by the onset of puberty.43,47 Over the next 35-40 years of reproductive life, only about 400 oocytes will ovulate, the rest being lost through atresia. By age 40, the size of the follicular pool declines to approximately 25,000, and at menopause, less than 1,000 follicles remain.48,49,50 and 51
Accurate modeling of the pattern of follicle depletion in the human ovary is important because the ability to measure reproductive aging or to predict the number of remaining follicles—to tell time on the biological clock—would help women make informed decisions about their reproductive plans.52 However, for obvious reasons, accurate measures of the numbers of primordial follicles across a human female reproductive life span are difficult to obtain. The first attempt to define the age-related pattern of follicular depletion was based on an analysis of combined data from older morphometric studies and yielded a bi-exponential model of ovarian aging, describing a biphasic pattern of oocyte depletion, with a distinct increase in the rate of decline beginning at approximately age 37.5 years.42,48,53,54 The biphasic model was widely accepted, despite the biological implausibility of an abrupt, population-wide, physiologic shift in the rate of follicular depletion.55,56 The model still is cited frequently,57,58 but subsequent work has demonstrated that a simpler, more biologically plausible, exponential49,59 or power function60 conforms best with available human data and current concepts regarding the mechanisms that govern the rate of follicular depletion.52,61 The current working model describes a gradually increasing rate of follicular depletion in which the pace of decline increases as the number of follicles remaining decreases, supported by evidence that paracrine factors secreted by primordial follicles inhibit recruitment and regulate the size of the resting follicular pool.52,61,62 and 63 The model describes the mean trajectory of follicular depletion, but leaves a great deal of population variation unexplained. Some of the variation among individuals doubtless relates to differences in the size of the initial follicular pool, which could be random but likely is genetically determined, and on lifestyle factors. The current model of reproductive aging still is evolving and does not yet have any real clinical utility because it cannot predict the reproductive lifespan for an individual woman.52,60
Endocrinology of Reproductive Aging
As the pace of follicular depletion increases during the latter reproductive years, but before any discernible change in menstrual regularity, serum follicle-stimulating hormone (FSH) levels begin to rise; luteinizing hormone (LH) concentrations remain unchanged. The subtle “monotropic” rise in circulating FSH concentrations is most apparent during the intercycle transition, when the corpus luteum regresses and menses begins, and could result from agerelated changes in the pattern of pulsatile gonadotropin-releasing hormone (GnRH) secretion, or from progressive follicular depletion and lower levels of feedback inhibition from ovarian hormones. The weight of available evidence supports the second explanation.64,65
A variety of studies in animals and women have identified changes in the patterns of hypothalamic-pituitary hormone secretion across the menopausal transition. In rodents, an age-related decrease in pulsatile GnRH and LH secretion and a loss of positive estrogen feedback have been observed, before the follicular pool is exhausted.66,67,68 and 69 In nonhuman primates, pulsatile GnRH release increases during the perimenopause and the positive feedback response remains intact.70 Studies in perimenopausal and postmenopausal women have yielded conflicting results. Whereas some have observed changes in sensitivity to estrogen feedback signals71,72 or in LH pulse amplitude or frequency,73,74,75,76,77 and 78 others have not.79,80 and 81 The response to exogenous GnRH stimulation also is inconsistent.77,82,83 On balance, these data suggest strongly that age-related changes in pulsatile LH secretion and gonadotropin concentrations merely reflect changes in ovarian feedback signals and do not result from aging of the hypothalamic-pituitary axis.
The bulk of available evidence indicates that the progressive increase in FSH concentrations associated with reproductive aging results from a progressive decrease in the levels of feedback inhibition from the smaller cohorts of follicles recruited from a shrinking follicular pool. Circulating follicular phase inhibin B levels (derived primarily from smaller antral follicles) decrease as or even before FSH concentrations begin to increase.64,84,85,86,87,88,89,90 and 91 Inhibin A levels also decline, but only in the later stages of reproductive aging, after the onset of menstrual irregularity.88,92,93,94 and 95 Both inhibins selectively inhibit pituitary FSH secretion. Consequently, FSH levels rise progressively as inhibin production from smaller cohorts of aging follicles decreases, most noticeably in the early follicular phase. Whereas declining inhibin production also could reflect a decrease in the functional capacity of older follicles,96 the observation that preovulatory follicular fluid inhibin concentrations are similar in young and older cycling women suggests that the number of remaining follicles is more important.84 Ovarian steroid hormones do not play a major role. The initial rise in FSH levels precedes any measurable decrease in estradiol levels, by several years.65,97 Follicular phase estradiol levels in older cycling women generally are similar to those in younger women, and often even higher.84,98 Luteal phase estrogen and progesterone levels also do not seem to change consistently with advancing age.64,86,88,99,100,101 and 102 Moreover, in sporadic ovulatory cycles in aging women, serum concentrations of estradiol and progesterone are comparable to those observed in younger women.103
As age and FSH levels increase, the follicular phase becomes shorter;104,105 and 106 LH levels and luteal phase duration remain unchanged. As the follicular phase shortens, estradiol levels rise earlier, suggesting that higher FSH levels stimulate more rapid follicular development.64 However, careful studies have shown that the earlier rise in estradiol levels results not from accelerated follicle growth, but from advanced follicular development at the beginning of the cycle and earlier selection of the dominant follicle.99,105,107 The earlier increase in follicular phase FSH level also frequently results in more than one dominant follicle,108,109 and 110 explaining the higher prevalence of dizygotic twinning in older cycling women.99, 108, 111
Reproductive aging already is quite advanced when the first clinical sign appears. Cycles remain regular, but overall cycle length and variability decrease gradually, reaching a nadir at an average age of 42 years,104,112 when fertility is at or near an end. However, women generally take notice only when cycles become irregular, marking the beginning of the menopausal transition.113 The menopausal transition begins at an average age of 46 years, but can arrive as early as age 34 and as late as age 54 years.104,112,114,115 and 116 Thereafter, average cycle length and variability increase steadily as ovulations become less regular and frequent.112 Regardless of age, the interval from loss of menstrual regularity to menopause is relative fixed, spanning approximately 5-6 years.47,117,118 The age of menopause, recognized only in retrospect, averages 51 years, but ranges widely, between ages 40 and 60 years.116,119,120,121,122,123 and 124 The variation in menopausal age is very similar across populations and generally follows a normal distribution that is slightly skewed to younger ages.124,125 and 126
Genetics of Reproductive Aging
Barring any disease that destroys or causes the removal of ovarian tissue and any important environmental insults, the total number of follicles at birth, and the age when the supply is exhausted, are genetically determined.47,127,128,129,130,131,132,133,134 and 135
There is good correlation between menopausal age in mothers and daughters and between sisters, suggesting that genetic factors play an important role in determining menopausal age.136,137 and 138 Approximately 10% of women become menopausal by the age of 45,116,128 probably because they were endowed with a smaller than average ovarian follicular pool that is functionally depleted at an earlier age. Pedigree analysis has revealed that the genetic features of early menopause (age 40-45) and premature ovarian failure (POF) are similar, suggesting a dominant pattern of inheritance through maternal or paternal relatives.139,140 The same genetic factors that determine the age at menopause also likely determine the age of reproductive milestones preceding the menopause.141 In natural populations, age at last birth varies as widely as the age at menopause, but occurs on average 10 years earlier.47 Moreover, women who repeatedly respond poorly to exogenous gonadotropin stimulation also tend to have an earlier menopausal transition,141,142,143 and 144 suggesting their poor response reflects an advanced stage of follicular depletion, beginning years sooner than would be anticipated normally.141 Conversely, fertility in women destined for a later than average menopause may not decrease significantly until after age 40.
Genes affecting reproductive hormones (FSH, FSHR, LH, LHR, CYP17, CYP19) or involved in the initial growth of primordial follicles (BMP15, GDF9, GPR3) impact follicular function; mutations are rare in humans, but polymorphisms could influence the rate of follicular recruitment and depletion and thereby affect the length of reproductive life.145 Variations in other genes encoding DNA binding proteins and transcription factors (NOBOX, LHX8) and RNA binding proteins (NANOS) expressed during oogenesis could affect germ cell formation; mutations causing POF have been identified in a few women.146 Variations in other genes with links to POF also might affect the rate of follicular depletion in normal women (ADAMts9, FOXL2).147,148 In a Dutch cohort study, common polymorphisms in the gene encoding the receptor for antimüllerian hormone (AMHR2) were associated with menopausal age,149 implicating a decrease in AMH signaling that would weaken its paracrine inhibition of primordial follicle recruitment, leading to more rapid follicular depletion. Careful examinations of these and other candidate genes identified in genome-wide association studies likely will yield new insights and further our understanding of the mechanisms that govern reproductive aging.
The Aging Follicle and Oocyte
Whereas the number of remaining ovarian follicles steadily declines with increasing age, observations in stimulated cycles suggest that aging follicles also become progressively less sensitive to gonadotropin stimulation. As age increases, the total dose and duration of treatment required to stimulate multiple follicular development increase. The rate of rise and the peak in estradiol levels decrease, reflecting the smaller cohorts of follicles that can be recruited. However, the amount of estradiol secreted by the follicles that do emerge and grow to maturity appears comparable to that in younger women.150 Although a decrease in exogenous hCG-induced ovarian androgen production can be demonstrated before the age of 30, circulating estradiol levels remain normal throughout and beyond the reproductive years, probably because rising FSH levels are able to compensate.151 Studies of ovarian follicular development and preovulatory follicular fluid hormones in older and younger cycling women do not suggest any age-related decline in follicular function, once growth and development begins. Preovulatory follicles in older and younger women are similar in size and inhibin content, and follicular fluid progesterone levels and estrogen/androgen ratios are even higher in older than in younger women.84
Older cycling women ovulate as regularly and more frequently than younger women. Their rising FSH levels apparently compensate quite effectively for any decrease in follicular sensitivity to gonadotropin stimulation. Preovulatory follicles in older cycling women get an earlier start, but grow at a normal pace and reach a normal size; their follicular fluid characteristics suggest they also are quite healthy. Why then does fertility in women decline progressively with age? The available evidence indicates that both the age-related decline in female fertility and the increase in risk of miscarriage can be attributed to an increase in the proportion of abnormal oocytes in an aging and shrinking follicular pool.
As the number of follicles decreases, oocyte quality also declines (at least by age 31-32 years), primarily because of an increase in meiotic nondisjunction, resulting in an increasing rate of oocyte and embryo aneuploidy in aging women.50,152,153 and 154 A wide variety of techniques has been used to study the chromosomal composition of human oocytes. The best available evidence, derived from detailed cytogenetic analysis of oocytes retrieved for IVF that failed to fertilize, suggests that the global rate of oocyte aneuploidy increases with advancing maternal age.155,156 Oocyte aneuploidy results primarily from premature separation of sister chromatids during meiosis I (resulting in a single chromatid in place of or in addition to one or more whole chromosomes), or from whole chromosome nondisjunction during meiosis II.156 The prevalence of both types of meiotic segregation errors increases progressively with age, but single chromatid events make the greatest contribution to the age-dependent increase in the prevalence of oocyte aneuploidy.155,156,157,158 and 159
The age-related decrease in the proportion of normal oocytes (23,X) and the corresponding increase in the proportion of aneuploid oocytes bear striking similarity to the age-related decrease in fertility and increase in the incidence of spontaneous miscarriage in women. Fertility and the prevalence of euploid oocytes decrease progressively with age. Miscarriage risk and the prevalence of aneuploid oocytes are relatively low and change little until approximately age 35 (about 10%), then increase progressively, reaching nearly 30% at age 40, 50% by age 43, and virtually 100% after age 45.155 These observations offer a logical explanation for the age-related increase in the prevalence of aneuploidy in spontaneous abortuses. Whereas at least half of all clinically recognized miscarriages exhibit an abnormal karyotype and the frequency of both euploid (normal) and aneuploid (abnormal) abortuses increases with maternal age, the probability that an abortus will be chromosomally abnormal increases with age, from less than 35% at age 20 to nearly 80% over age 42.36 Trisomies are by far the most common abnormality observed, followed by polyploidies and monosomy X (45,X).
Studies of meiotic segregation have revealed that factors predisposing to nondisjunction relate to the disruption of chromosomal pairing and recombination.160,161 Various mechanisms have been implicated, but all involve an age-dependent deterioration in cellular factors required for proper spindle formation and function.162 Molecular investigations of chromatid cohesion and separation have implicated cohesins, a specific class of proteins that maintain cohesion between sister chromatids and oppose the splitting forces mediated by the microtubules of the meiotic spindle.163,164,165 and 166 An age-related premature degradation or deficiency of cohesins may result in unstable bivalent chromatid structures and predispose to premature separation of sister chromatids before they align on the meiotic spindle. The smaller chromosomes appear more prone to premature chromatid separation, possibly because they have fewer of the chiasma that help to prevent such dissociation.157,167,168 Other studies using high-resolution confocal microscopy to examine the meiotic spindle in human oocytes have revealed that abnormalities of the cleavage spindle microtubular matrix or chromosome alignment during meiosis II are four to five times more common in older cycling women (age 40-45) than in younger women (age 20-25).50 These and other observations of cultured human oocytes collected from unstimulated ovaries further indicate that the meiotic competence of oocytes declines with age.169 In sum, accumulated evidence strongly suggests that the primary cause of the age-dependent decrease in fecundability and increase in the incidence of miscarriage is an increasing prevalence of aneuploidy in aging oocytes resulting from disordered regulatory mechanisms governing meiotic spindle formation and function.
 |
Aging and the Uterus
Aging does not appear to have any significant adverse effect on the uterus. Although the prevalence of benign uterine pathology (leiomyomata, endometrial polyps, adenomyosis) increases with age,170,171 and 172 little evidence exists to indicate it has much overall impact on fertility in women.173,174,175 and 176 Age also does not appear to adversely affect endometrial development or function in response to steroid stimulation.177 The strongest evidence comes from comparing outcomes in nondonor and donor oocyte IVF cycles. Whereas early studies suggested that donor oocyte IVF pregnancy and delivery rates decreased modestly with the age of the recipient,178,179 and 180 the bulk of more recent experience refutes those conclusions.34,181,182
In the national summary of ART success rates for the year 2007, live birth rates declined progressively with increasing age for nondonor egg cycles, as expected. In contrast, the overall live birth per transfer rate in donor egg IVF cycles was 55% and did not vary significantly with age of the recipient.34 Live birth rates in donor egg IVF cycles relate to the age of the donor, not the age of the recipient. In one large series, miscarriage rates increased from 14% in women matched with egg donors ages 20-24 to 44% for women whose donors were over age 35.183
In the national summary of ART success rates for the year 2007, live birth rates declined progressively with increasing age for nondonor egg cycles, as expected. In contrast, the overall live birth per transfer rate in donor egg IVF cycles was 55% and did not vary significantly with age of the recipient.34 Live birth rates in donor egg IVF cycles relate to the age of the donor, not the age of the recipient. In one large series, miscarriage rates increased from 14% in women matched with egg donors ages 20-24 to 44% for women whose donors were over age 35.183
Aging and Male Fertility
The relationship between age and fertility in men is discussed in detail in Chapter 30 and summarized here. Modest age-related decreases in semen volume, sperm motility, and morphologically normal sperm, but not sperm density, have been observed.184 Semen characteristics generally do not accurately predict fertilizing capacity;185,186,187 and 188 neither do endocrine parameters.189,190 In studies of the effect of male partner age on pregnancy rates, female partner age and declining coital frequency with increasing age are obvious and important confounding factors. Among the few studies that have controlled for female age, pregnancy rates for men over 50 have been 23-38% lower than for men under age 30.184 A British study that examined the effect of men’s age on the time to conception (adjusting for the confounding effects of both partner’s age and coital frequency) found that increasing men’s age was associated with increasing time to conception and declining overall pregnancy rates; time to conception was 5-fold greater for men over age 45 than for men under age 25, and restricting the analysis to men with young partners yielded similar results.191 Results of two studies that controlled for female partner age have suggested that male fertility may start to decline earlier, beginning in the late 30s.192,193
There are several possible biological mechanisms that might explain an age-related decline in male fertility. Sperm chromosomal abnormalities may increase in frequency with age and adversely affect early embryonic development.194 There is at least some evidence to suggest that increasing male age may raise the risk of miscarriage in young women.195 Average FSH levels in men increase during their 30s,196 suggesting that age-related changes in the hypothalamic-pituitary-gonadal axis may begin during midlife.197 The testes and prostate also exhibit morphological changes with aging that might adversely affect both sperm production and the biochemical properties of semen.198 Whatever the mechanism, decreasing fertility with increasing male age in healthy couples suggests that normal sperm overproduction may not fully buffer the effects of increasing age.
On balance, the available evidence indicates that pregnancy rates decrease and time to conception increases as male age increases. However, because there is little or no overall vmeasurable decline in male fertility before age 45-50, male factors generally contribute relatively little to the overall age-related decline in fertility.
Ovarian Reserve Tests
Over the past 20 years, studies of the mechanisms involved in reproductive aging and its clinical consequences have stimulated efforts to measure “ovarian reserve,” generally describing the size and quality of the remaining ovarian follicular pool. A number of methods have now been described, all intended to predict fertility or to provide prognostic information regarding the likelihood of successful treatment in infertile women, recognizing that although the number and quality of oocytes decline with age, fertility varies significantly among women of similar age.
Like all screening tests, ovarian reserve tests are aimed at identifying individuals at risk for a disease, in this case a “diminished ovarian reserve” (DOR). It is important to emphasize that such tests cannot and do not establish a diagnosis of DOR; they only identify women more likely to exhibit a poor response to gonadotropin stimulation and to have a lower likelihood of achieving pregnancy with treatment. The value of a screening test depends on its validity, describing its ability to correctly categorize individuals as affected (sensitivity) or unaffected (specificity). The sensitivity and specificity of a screening test will vary with the chosen threshold value. A choice intended to maximize sensitivity minimizes the number of false-negative results (patients with DOR categorized as normal), but increases the number of false-positive results (patients with a normal ovarian reserve categorized as having DOR). Conversely, a threshold value that maximizes specificity minimizes false-positives, but increases false-negative results.
For measures of ovarian reserve, test threshold values should have high specificity for DOR, so as to decrease false-positive results (incorrectly categorizing a patient with a normal ovarian reserve as having DOR), thereby avoiding overly aggressive treatment or inappropriate recommendations to abandon treatment or pursue adoption or oocyte donation in women with a normal ovarian reserve. Treating women with unrecognized DOR (the consequence of maximizing specificity) is undesirable, but a less serious error.
The most important test characteristics of a screening test are its positive predictive value (PPV) and negative predictive value (NPV), which vary with the prevalence of the disease of interest (DOR) in the test population. PPV describes the probability that a woman with a positive test truly has DOR, and NPV is the probability that a woman with a negative test truly has a normal ovarian reserve. If the prevalence of DOR is low, as in young women, the PPV will be low, even if sensitivity and specificity are high. Conversely, if the prevalence of DOR is high, as in older women, the PPV will be high if a highly specific threshold value is chosen. If the purpose of ovarian reserve testing is to correctly identify women with DOR, it will be most useful in women at high risk for DOR. When applied in a low prevalence population, many women with a normal ovarian reserve will have a false-positive result and be categorized as having DOR.
Ovarian reserve tests include both biochemical and ultrasonographic measures of the size and (by inference) the quality of the ovarian follicular pool. Biochemical tests include both basal measurements, such as FSH, estradiol, inhibin B, and antimüllerian hormone (AMH), and provocative tests, such as the clomiphene citrate challenge test. Ultrasonographic measures of ovarian reserve include the antral follicle count and ovarian volume. The clinical utility of any test of ovarian reserve is most easily and efficiently evaluated by examining the relationship between test results and IVF cycle characteristics and outcomes. Considering the costs, logistics, and risks involved with IVF, and the importance of accurate prognostication in counseling candidate couples, correlation with IVF outcome is arguably also the most clinically relevant measure.
Basal FSH and Estradiol Concentrations
Given that rising FSH levels are one of the earliest indications of reproductive aging in women, it was logical to think that the serum FSH concentration might serve as a useful ovarian reserve test. The basal FSH concentration is the simplest and still most widely applied measure of ovarian reserve.
Because serum FSH concentrations vary significantly across the cycle, the serum FSH concentration is best obtained during the early follicular phase (cycle day 2-4). FSH values
vary with the assay method; although values obtained with different assays correlate very well, absolute values can differ significantly. Values also vary with the reference standard, previously an international reference preparation of human menopausal gondotropin (IRPHMG), and now the World Health Organization Second International Reference Preparation (IRP 78/549).
vary with the assay method; although values obtained with different assays correlate very well, absolute values can differ significantly. Values also vary with the reference standard, previously an international reference preparation of human menopausal gondotropin (IRPHMG), and now the World Health Organization Second International Reference Preparation (IRP 78/549).
Numerous studies have investigated the relationship between cycle day 3 FSH concentrations or FSH/LH ratios and IVF cycle outcomes, all observing that these measures correlate with the ovarian response to exogenous gonadotropin stimulation and, to a lesser extent, with the likelihood for success. As values increase, peak estradiol levels, the number of oocytes retrieved, and the probability for pregnancy or live birth steadily decline.199,200,201,202,203,204 and 205 With current assays (using IRP 78/549), FSH levels greater than 10 IU/L (10-20 IU/L) have high specificity (80-100%) for predicting poor response to stimulation, but their sensitivity for identifying such women is generally low (10-30%) and decreases with the threshold value.206 Although most women who are tested (including those with DOR) will have a normal result, the test is still useful because those with abnormal results are very likely to have DOR. In a 2008 study, an FSH concentration above 18 IU/L had 100% specificity for failure to achieve a live birth.207
Because FSH levels can vary significantly, many clinicians prefer to repeat the test. Not surprisingly, consistently high values are associated with a poor prognosis, but a single elevated FSH concentration (>10 IU/L) does not have high specificity for predicting poor response to stimulation or failure to achieve pregnancy.208 Serial testing in efforts to select the ideal cycle for treatment does not improve outcomes in women with fluctuating FSH concentrations.209,210
The basal serum estradiol concentration, by itself, has little value as an ovarian reserve test,211,212,213 and 214 but can provide additional information that helps in the interpretation of the basal FSH level. An early elevation in serum estradiol reflects advanced follicular development and early selection of a dominant follicle (as classically observed in women with advanced reproductive aging), and will suppress FSH concentrations, thereby possibly masking an otherwise obviously high FSH level indicating DOR. When the basal FSH is normal and the estradiol concentration is elevated (>60-80 pg/mL), the likelihood of poor response to stimulation is increased and the chance for pregnancy is decreased.215,216,217 and 218 When both FSH and estradiol are elevated, ovarian response to stimulation is likely to be very poor.
Clomiphene Citrate Challenge Test
The clomiphene citrate challenge test (CCCT) is a provocative and possibly more sensitive test of ovarian reserve that probes the endocrine dynamics of the cycle under both basal and stimulated conditions, before (cycle day 3 FSH and estradiol) and after (cycle day 10 FSH) treatment with clomiphene citrate (100 mg/d, cycle days 5-9).219
The smaller follicular cohorts in aging women produce less inhibin B and estradiol, resulting in less negative feedback inhibition on clomiphene-induced pituitary FSH release, causing an exaggerated increase in FSH concentrations.85,220 Consequently, a frankly elevated cycle day 10 FSH concentration can identify women with DOR who might otherwise go unrecognized if evaluated with basal cycle day 3 FSH and estradiol levels alone.221,222
In studies evaluating CCCT results, stimulated concentrations of FSH, estradiol, and inhibin B have varied widely, limiting the value of the test.223,224 and 225 A 2006 systematic review
of the predictive value of the CCCT over a range of day 10 FSH concentrations (10-22 IU/L) in women at low, average, and high probability of DOR concluded the test had 47-98% specificity and 35-93% sensitivity for predicting poor response to stimulation, and 67-100% specificity and 13-66% sensitivity for predicting treatment failure.226 Overall, stimulated FSH levels have higher sensitivity but lower specificity than the basal FSH concentration.226
of the predictive value of the CCCT over a range of day 10 FSH concentrations (10-22 IU/L) in women at low, average, and high probability of DOR concluded the test had 47-98% specificity and 35-93% sensitivity for predicting poor response to stimulation, and 67-100% specificity and 13-66% sensitivity for predicting treatment failure.226 Overall, stimulated FSH levels have higher sensitivity but lower specificity than the basal FSH concentration.226
Inhibin B
Inhibin B is secreted primarily during the follicular phase by the granulosa cells of smaller antral follicles, and might therefore be expected to have some value as an ovarian reserve test.227 However, serum inhibin B concentrations increase in response to exogenous GnRH or FSH stimulation and vary widely across and between menstrual cycles.213,228 Inhibin B is generally not regarded as a reliable measure of ovarian reserve.
Although inhibin B levels are generally lower in women who respond poorly to exogenous gonadotropin stimulation than in those who respond normally,229,230 even low threshold values (40-45 pg/mL) have only 64-90% specificity and 40-80% sensitivity for predicting poor response. Inhibin B has a relatively low PPV (19-22%) but a relatively high NPV for detecting DOR in a general IVF population;228,231 in a high prevalence population, the PPV of inhibin B can exceed 80%.213 In most studies, inhibin B has had poor PPV for failed treatment.212, 213, 227, 232, 233
Antimüllerian Hormone
Antimüllerian hormone (AMH) is produced by the granulosa cells of preantal and small antral follicles, beginning when primordial follicles start development and ending when they reach a diameter of 2-6 mm.234,235,236 and 237 Small antral follicles are likely the primary source because they contain larger numbers of granulosa cells and a more developed microvasculature.238,239 Although it functions primarily as an autocrine and paracrine regulator of follicle development, AMH appears in measurable amounts in the serum.240 The number of small antral follicles correlates with the size of the residual follicular pool and AMH levels decline progressively, becoming undetectable near the menopause.241,242,243 and 244
Because AMH derives from preantral and small antral follicles, levels are gonadotropin-independent and exhibit little variation within and between cycles.245,246 and 247 In clinical studies, AMH has been assayed using two different commercial assay kits, and although the results they yield are highly correlated, their standard curves are not parallel and there is no applicable conversion factor; one comparative study observed that concentrations measured with one kit were more than 4-fold lower than those measured with the other.248 Consequently, when applying results in clinical practice, it is important to know which assay method was used to measure AMH. Commercial assay kits yield consistent results with low interassay variation (<10%).249
The performance of AMH as a screening test of ovarian reserve has been examined in the general IVF population and in populations of women at low or high risk for DOR. Overall, lower AMH levels have been associated with poor response to ovarian stimulation and low oocyte yield, embryo quality, and pregnancy rates,228,229,250,251 and 252 but studies correlating mean AMH levels with IVF outcomes have not yielded threshold values that can be applied confidently in clinical care.211,229,231,250 In the general IVF population, low AMH threshold values (0.2-0.7 ng/mL) have had 40-97% sensitivity, 78-92% specificity,
22-88% PPV and 97-100% NPV for predicting poor response to stimulation (<3 follicles, or <2-4 oocytes), but have proven neither sensitive nor specific for predicting pregnancy.228,253,254 and 255 In women at low risk for DOR, values of 2.5-2.7 ng/mL have had 83% sensitivity, 82% specificity, 67-77% PPV, and 61-87% NPV for clinical pregnancy.212,256 The higher threshold values decrease specificity, resulting in lower PPV because the prevalence of DOR was low. A study in women at high risk for DOR (involving older women, those with an elevated FSH, or history of poor response to stimulation) observed that an undetectable AMH had 76% sensitivity, 88% specificity, 68% PPV, and 92% NPV for three or fewer follicles.229 A higher threshold value (1.25 ng/mL) had 85% sensitivity, 63% specificity, 41% PPV, and 57% NPV for cycle cancellation.213
22-88% PPV and 97-100% NPV for predicting poor response to stimulation (<3 follicles, or <2-4 oocytes), but have proven neither sensitive nor specific for predicting pregnancy.228,253,254 and 255 In women at low risk for DOR, values of 2.5-2.7 ng/mL have had 83% sensitivity, 82% specificity, 67-77% PPV, and 61-87% NPV for clinical pregnancy.212,256 The higher threshold values decrease specificity, resulting in lower PPV because the prevalence of DOR was low. A study in women at high risk for DOR (involving older women, those with an elevated FSH, or history of poor response to stimulation) observed that an undetectable AMH had 76% sensitivity, 88% specificity, 68% PPV, and 92% NPV for three or fewer follicles.229 A higher threshold value (1.25 ng/mL) had 85% sensitivity, 63% specificity, 41% PPV, and 57% NPV for cycle cancellation.213
AMH is a very promising screening test for DOR, but is likely to be more useful in a general IVF population or in women at high risk for DOR than in women at low risk for DOR. Low threshold values have good specificity for poor response to ovarian stimulation, but not for predicting pregnancy.
Antral Follicle Count
Reproductive aged women have an estimated 20-150 growing follicles in the ovaries at any one time, although only a few are large enough to be imaged (≥2 mm) by transvaginal ultrasonography.257,258 and 259 Follicles of that size have reached a stage of development where they are responsive to FSH, which stimulates and supports more advanced stages of development. Histologic studies have revealed that the number of small antral follicles in the ovaries is proportional to the number of primordial follicles remaining.260 Therefore, as the supply of primordial follicles decreases, the number of visible small antral follicles also declines. The antral follicle count (AFC; total number of antral follicles measuring 2-10 mm in both ovaries) thus provides an indirect but useful measure of ovarian reserve.258,261,262,263 and 264
AFC correlates with onset of the menopausal transition, indicating that it relates to the number of follicles remaining.242 Some, perhaps as much as half, of the antral follicles that can be imaged are probably in the process of atresia, but there is no way other than observing their response to FSH stimulation to distinguish them from viable growing follicles.17 However, AFC correlates well with oocyte yield in IVF cycles,265 suggesting that gonadotroin stimulation can still rescue follicles that may be in the early stages of atresia.266 Several studies have observed a relationship between the AFC and response to ovarian stimulation in IVF cycles. In the general IVF population, including women at low and high risk for DOR, an AFC threshold value of three to four follicles has high specificity (73-100%) for predicting poor response to ovarian stimulation and failure to conceive (64-100%), but relatively low sensitivity for both endpoints (9-73% for poor response, 8-33% for failure to conceive).213,265,267,268,269,270,271 and 272 The PPV and NPV of AFC have varied widely in studies.
A low AFC has high specificity for predicting poor response to ovarian stimulation and treatment failure, making it a useful test, but low sensitivity limits its overall clinical utility.
Ovarian Volume
Not surprisingly, ovarian volume decreases with progressive follicular depletion.273,274 However, the measure has high inter-cycle and inter-observer variability,213,275,276 and 277 and because most studies of ovarian volume have excluded women with ovarian pathology such as endometriomas and polycystic ovary syndrome, results have limited generalizability.274,278
Ovarian volume (length × width × depth × 0.52=volume) generally correlates with the number of oocytes retrieved, but poorly with pregnancy.267,272,279,280 and 281 A low ovarian volume (< 3mL) has high specificity (80-90%) and widely ranging sensitivity (11-80%) for predicting poor response to ovarian stimulation.206 The PPV for poor response can be as low as 17% among women at low risk for DOR, and as high as 53% in women at high risk.213 Overall, ovarian volume has very limited clinical utility as an ovarian reserve test.
Ovarian volume (length × width × depth × 0.52=volume) generally correlates with the number of oocytes retrieved, but poorly with pregnancy.267,272,279,280 and 281 A low ovarian volume (< 3mL) has high specificity (80-90%) and widely ranging sensitivity (11-80%) for predicting poor response to ovarian stimulation.206 The PPV for poor response can be as low as 17% among women at low risk for DOR, and as high as 53% in women at high risk.213 Overall, ovarian volume has very limited clinical utility as an ovarian reserve test.
Other Tests of Ovarian Reserve
Numerous other provocative tests of ovarian reserve have been investigated, including exogenous FSH-stimulated estradiol, inhibin B or AMH levels250,282,283,284,285 and 286 and GnRH agoniststimulated FSH, estradiol, inhibin B, or AMH concentrations.250,282,287,288 and 289 In theory, the ovarian and endocrine response to FSH or GnRH agonist stimulation should provide the best estimate of the number of responsive follicles. However, a 2006 systematic review found no evidence that these more complex and costly tests predict response to ovarian stimulation or pregnancy any better than basal FSH, AMH, and AFC.206
Combined Tests of Ovarian Reserve
Recognizing that no one test of ovarian reserve has 100% sensitivity and specificity, a number of investigators have examined the performance of varying combinations of ovarian reserve tests. Analysis is difficult, primarily because of differences in chosen threshold values for specific tests. Moreover, because the different tests are highly correlated, using more than one measure in a prediction model does not necessarily improve its performance.213,230,267 Complicated formulas also are generally not useful in clinical practice. One analysis combining AMH, inhbin B, AFC, and ovarian volume found that only AFC and AMH predicted response to stimulation and that the combination predicted outcome no better than the individual tests.275 A meta-analysis of cohort studies investigating the performance of various combinations of tests concluded that models combining tests do not perform significantly better than individual tests such as the AFC.290
SUMMARY
Currently, there is no uniformly accepted definition of diminished ovarian reserve. A number of different measures have been developed, primarily for use in predicting success with IVF. The ideal ovarian reserve test should yield consistent results and be highly specific, to minimize the risk for incorrectly categorizing normal women as having a diminished ovarian reserve. Basal FSH is the most commonly used ovarian reserve test, but antral follicle count and antimüllerian hormone are promising predictors with significant potential advantages.
Ovarian reserve tests predict response to exogenous gonadotropin stimulation reasonably well, but whether the information gained truly affects outcomes is less certain. Although the planned amount of gonadotropin stimulation often is increased in predicted poor responders, those adjustments do not improve response predictably, probably because the small cohort of responsive antral follicles is the limiting factor and no amount of stimulation can increase that number appreciably.291,292 and 293 Even in women
who previously exhibited a poor response to stimulation, changes in treatment regimens generally have not improved response or pregnancy rates in subsequent cycles.292,294,295 and 296
who previously exhibited a poor response to stimulation, changes in treatment regimens generally have not improved response or pregnancy rates in subsequent cycles.292,294,295 and 296
None of the ovarian reserve tests currently in use is an accurate predictor of pregnancy in IVF cycles, unless extreme abnormal threshold values are applied, which results in very low sensitivity for identifying women having a poor prognosis.207 The tests are adequate for predicting poor response, which does have prognostic value, although not as much in young women as in older women.297,298 and 299 Although ovarian reserve tests have become a routine element of pre-treatment evaluation for couples planning IVF, it can be argued that routine testing has limited clinical utility in the large majority of patients and can be misleading, especially in women at low risk for having a diminished ovarian reserve.17
Ovarian reserve tests also have become a routine element of the diagnostic evaluation for infertility. Advocates for the liberal application of ovarian reserve tests argue that abnormal tests can help to persuade older women to abandon plans to pursue aggressive, costly, and likely futile treatment, and can help to convince young women to do just the opposite, to take fullest advantage of a rapidly closing window of opportunity. Others more circumspect emphasize correctly that few young women will have an abnormal test, and some of those who do inevitably will be categorized incorrectly, leading to inappropriate counseling and treatment. The best overall strategy would seem to limit ovarian reserve testing to women at increased risk for having a diminished ovarian reserve and to apply highly specific threshold values to minimize the risk for a falsepositive result. In this context, ovarian reserve testing can best be justified for women with any of the following characteristics:141,300,301,302 and 303
Age over 35.
Unexplained infertility.
Family history of early menopause.
Previous ovarian surgery (ovarian cystectomy or drilling, unilateral oophorectomy), chemotherapy, or radiation.
Smoking.
Demonstrated poor response to exogenous gonadotropin stimulation.
Ovarian reserve tests always should be interpreted with caution. Rigid application of test results risks inappropriate recommendations for treatment, or for no treatment, and both must be avoided. An abnormal test result does not preclude the possibility of pregnancy. Except perhaps when grossly abnormal, test results should not be used to deny treatment, but only to obtain prognostic information that may help to guide the choice of treatment and best use of available resources. Although the probability of pregnancy may be low, many with abnormal test results will achieve pregnancy if afforded the chance. Ultimately, regardless of the prognosis, the success rate for any individual woman will be 0% or 100%.
Guiding Principles for Evaluation and Treatment of Infertility
From the beginning, the evaluation of infertility should focus on the couple and not on one or the other partner, regardless of past reproductive performance. Both partners should be encouraged to attend each visit during evaluation, whenever possible. Each can provide
information and perspective the other may not have or remember. Joint visits also help to ensure that both partners understand any information, options, and recommendations that may be offered and that each has the opportunity to have their questions addressed directly.
information and perspective the other may not have or remember. Joint visits also help to ensure that both partners understand any information, options, and recommendations that may be offered and that each has the opportunity to have their questions addressed directly.
Clinicians caring for infertile couples should keep four basic goals in mind:
To identify and to correct specific causes of infertility, when possible. With proper evaluation and treatment, the majority of women will achieve pregnancy.
To provide accurate information and to dispel the misinformation commonly gained from friends and mass media.
To provide emotional support during a trying time. In many couples, the inability to conceive results in feelings they have lost control over an important and very personal part of their lives, and the process of evaluation adds to that burden. Infertile couples often need the opportunity to express their concerns, frustrations, and fears, and support groups can help to meet that need. Group meetings can help couples to realize that their problem is not unique and to learn how others cope with similar problems. Whereas severe anxieties can have adverse effects on ovulatory function and coital frequency, there is no substantial evidence that the usual anxieties of couples trying to conceive cause or contribute to their infertility.
To guide couples failing to conceive with other forms of treatment to alternatives, including IVF, the use of donor gametes (oocytes or sperm), and adoption, and to help those who reject or fail treatment to come to closure.
Counseling must be an ongoing process during both evaluation and treatment. Regular visits to review and critique results and to outline recommendations for further evaluation and treatment help to ensure that all of the couple’s medical, emotional, and financial needs and concerns are addressed effectively in a timely fashion.
Lifestyle and Environmental Factors
Understandably, all infertile couples are very interested in learning anything they might do to maximize the likelihood of achieving a successful pregnancy. Lifestyle choices and environmental factors influence fertility and deserve consideration and discussion when they are relevant. Over 35% of American women are obese and another 30% are overweight.304 Obesity is defined as a body mass index (BMI) greater than 30 kg/m2 and overweight is defined as a BMI between 25 kg/m2 and 30 kg/m2. In women, obesity is associated with menstrual dysfunction, decreased fertility, and increased risks of miscarriage and obstetric and neonatal complications. In men, obesity is associated with abnormal semen parameters and can adversely affect fertility.305
Substance abuse is one of the few things over which the couple may have specific control, smoking being the most important. Many are not aware of the adverse effects smoking has on fertility and pregnancy outcome.306 The couple’s motivation to maximize their fertility presents a golden opportunity to educate those who smoke and to establish a smoking cessation strategy. Smoking has well-known adverse impact on pregnancy outcome, and evidence strongly suggests that fertility is lower in both men and women who smoke.307,308,309,310 and 311 The prevalence of infertility is higher, fecundability is lower, and the time to conception is longer in smoking than in non-smoking women, and the effects of passive smoke exposure are only slightly less than those of active smoking by either partner.312 The available data suggest that the adverse effects of smoking on fertility are dosedependent.308,313,314 and 315 The mechanisms involved ay include accelerated follicular
depletion,316,317 and 318 menstrual cycle abnormalities,319 or gamete or embryo mutagenesis induced by toxins in cigarette smoke.320,321,322,323 and 324 A causal relationship between cigarette smoking and female infertility has not been established. However, based on the results of a meta-analysis including 12 studies (overall OR for risk of infertility in women smokers versus non-smokers 1.60), and assuming a 25% prevalence of smoking in women of reproductive age, up to 13% of female infertility may relate to smoking.310 Consequently, an active approach to prevention of infertility is justified, discouraging smoking and helping those who smoke to quit.325
depletion,316,317 and 318 menstrual cycle abnormalities,319 or gamete or embryo mutagenesis induced by toxins in cigarette smoke.320,321,322,323 and 324 A causal relationship between cigarette smoking and female infertility has not been established. However, based on the results of a meta-analysis including 12 studies (overall OR for risk of infertility in women smokers versus non-smokers 1.60), and assuming a 25% prevalence of smoking in women of reproductive age, up to 13% of female infertility may relate to smoking.310 Consequently, an active approach to prevention of infertility is justified, discouraging smoking and helping those who smoke to quit.325
Other forms of substance abuse also can adversely affect fertility. Marijuana inhibits the secretion of GnRH and can suppress reproductive function in both women and men.326 In women, marijuana use can interfere with ovulatory function.327 Cocaine use can impair spermatogenesis in men326,328 and has been associated with a greatly increased risk of tubal disease in women.327 Heavy alcohol consumption in women may decrease fertility;329,330 and 331 in men, it has been associated with decreased semen quality and impotence.332 Conflicting evidence suggests that moderate alcohol intake can reduce fecundability.333,334 In both women and men, even modest amounts of alcohol consumption have been associated with lower pregnancy rates in IVF cycles.335 Although moderate caffeine ingestion (≤250 mg daily; two standard beverages) appears not to have any adverse effects on fertility, higher levels of consumption may delay conception311,336,337 or increase the risk of pregnancy loss.338
Other potentially harmful occupational and environmental exposures, although uncommon, may be identified. Exposures to perchlorethylene in the dry cleaning industry, toluene in the printing business, ethylene oxide, and mixed solvents have been associated with decreased fecundity. Semen abnormalities have been described in men exposed to radiant heat or heavy metals. Environmental exposure to herbicides or fungicides has been associated with decreased fertility in women,331 and exposure to pesticides and other chlorinated hydrocarbons with an increased risk of miscarriage.339
For couples attempting to conceive, there is fair evidence to support recommendations for smoking cessation and efforts to achieve a BMI between 20 and 25 kg/m2. Recommendations to limit alcohol consumption to four or fewer drinks per week and to limit caffeine intake to less than 250 mg/d also are reasonable and consistent with available evidence. However, there have been no randomized controlled trials demonstrating that such lifestyle modifications improve fertility.
Normal Reproductive efficiency
As evaluation begins, and again before treatment starts, education on normal human reproductive efficiency can help to provide important perspective for infertile couples. Few realize that, compared to other mammals and even nonhuman primates, humans are not highly fertile. In captive baboons, cycle fecundity ranges as high as 80% when conditions and timing are optimized.340 In normally fertile couples, cycle fecundity averages 20% and does not exceed approximately 35% even when coitus is carefully timed.40,341,193 That perspective is particularly helpful when discussing and comparing the efficacy of different treatment options, typically viewed in terms of cycle fecundability. When doing so, it is important for couples to realize that the benchmark for comparison is 20-30%, and not 100%.
Given the average 20% cycle fecundability, the cumulative pregnancy rates observed over time in normal fertile couples are easy to understand. The data in the table below have been a standard since 1956, and have been confirmed by more recent studies.3,342,343
Time Required for Conception Among Couples Who Will Attain Pregnancy342 | ||||||||||
|---|---|---|---|---|---|---|---|---|---|---|
|
Normal sperm can survive in the female reproductive tract and retain the ability to fertilize an egg for at least 3 and up to 5 days, but an oocyte can be fertilized successfully for only approximately 12-24 hours after ovulation.344 Consequently, virtually all pregnancies result from intercourse occurring sometime within the 6-day interval ending on the day of ovulation.193,341,345 Estimates of when fertility peaks vary with the method used to determine the time of ovulation. When ovulation is assumed to occur on the day before the midcycle rise in basal body temperature (BBT), the day of peak fertility falls 2 days prior to ovulation193; ovulation generally occurs within 1 day of that predicted.345 When the time of ovulation is based on daily urine estrogen concentrations, the probability of conception increases steadily as ovulation nears and peaks on the day before and day of ovulation,341,345 ranging from about 10% at its low to approximately 33% at its peak. When daily urinary LH excretion is monitored to detect the midcycle surge that triggers ovulation, follicular collapse (as determined by serial transvaginal ultrasonography) and, presumably, ovum release generally follows within 14-26 hours, and almost always within 48 hours.346,347 Regardless of the method used, all studies indicate that fertility plummets almost immediately thereafter, declining to near zero within 24 hours after ovulation.
Timed coitus is frequently recommended to infertile couples as a means to increase the likelihood of pregnancy, even though there are few data to support the recommendation. Although BBT and ovulation predictor kits can help define the time of ovulation, they should be used only when necessary. Scheduled intercourse clearly adds to the already significant stress of infertility. Moreover, much of the interval of peak fertility during the menstrual cycle may be inadvertently excluded while awaiting the appropriate “signal.” For most couples, the simple recommendation for intercourse approximately twice per week can avoid an unnecessary source of stress while also helping to ensure that coitus occurs during the interval of highest fertility.348 However, timed coitus may be a reasonable recommendation for couples having infrequent intercourse, by preference or because of circumstance.
Causes of Infertility
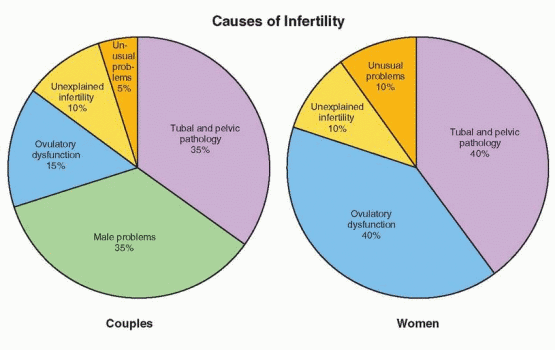
Before any formal investigation begins, the major causes of infertility and the basic components of the infertility evaluation should be outlined for the couple. The major causes of infertility include ovulatory dysfunction (20-40%), tubal and peritoneal pathology (30-40%), and male factors (30-40%); uterine pathology is relatively uncommon, and the remainder is largely unexplained. To some extent, the prevalence of each cause of infertility varies with age. Ovulatory dysfunction is more common in younger than in older couples, tubal and peritoneal factors have a similar prevalence, and male factors and unexplained infertility are observed somewhat more often in older couples.349,350 The distribution of causes also varies with the duration of infertility and the level of care.351,352 and 353
 |
Most couples seeking evaluation have been trying to conceive for 2 or more years, so few will be normally fertile. Those with longer durations of infertility generally have more severe or multiple problems and tend to congregate in tertiary care centers. The average duration of infertility for couples seen in tertiary care centers (42 months)353 is twice that for couples seen in the primary care setting (21 months).351 Predictably, the proportion of couples with easily treatable ovulatory dysfunction decreases from primary to tertiary care, and that with more severe tubal/peritoneal or male factors increases.
The human reproductive process is complex, but for purposes of evaluation, it can be dissected into its most important and basic components.
Sperm must be deposited at or near the cervix at or near the time of ovulation, ascend into the fallopian tubes, and have the capacity to fertilize the oocyte (male factor).
Ovulation of a mature oocyte must occur, ideally on a regular and predictable basis (ovarian factor).
The cervix must capture, filter, nurture, and release sperm into the uterus and fallopian tubes (cervical factor).
The uterus must be receptive to embryo implantation and capable of supporting subsequent normal growth and development (uterine factor).
The fallopian tubes must capture ovulated ova and effectively transport sperm and embryos (tubal factor).
The infertility evaluation is designed to isolate and test the integrity of each component, insofar as that is possible, and to identify any abnormalities that might impair or prevent conception. The pace and extent of evaluation should be based on the couple’s age, duration of infertility, medical history, physical examination, and preferences.
Some infertility problems once considered insurmountable are now amenable to modern treatments. IVF can effectively bypass irreparable tubal occlusive disease, and intracytoplasmic sperm injection (ICSI) can overcome even severe abnormalities of semen quality.
Treatments aimed at increasing gamete density—bringing together more than the usual numbers of oocytes and sperm in the right place at the right time—can increase cycle fecundability for couples with age-related or otherwise unexplained infertility, and include ovarian stimulation with intrauterine insemination (IUI) or IVF. In women with premature ovarian failure, women beyond normal reproductive age, and women without ovaries, IVF using donor oocytes is highly successful.
Treatments aimed at increasing gamete density—bringing together more than the usual numbers of oocytes and sperm in the right place at the right time—can increase cycle fecundability for couples with age-related or otherwise unexplained infertility, and include ovarian stimulation with intrauterine insemination (IUI) or IVF. In women with premature ovarian failure, women beyond normal reproductive age, and women without ovaries, IVF using donor oocytes is highly successful.
The advent of evidence-based medical practice has had significant impact on the diagnosis and treatment of infertility. Critical analyses of standard diagnostic tests and common therapies have questioned and, in some cases, proven invalid some of the most time-honored methods of evaluation and treatment.354 The scope and sequence of the modern infertility evaluation have shifted focus, from making a specific diagnosis to using the most efficient and cost-effective tests. The focus of treatment for infertility also has shifted, from systematic correction of each identified factor to applying the most efficient and cost-effective therapy, which often is assisted reproductive technology (ART).
Indications for Evaluation
When should a formal evaluation for infertility begin? After all, most infertile couples are only subfertile, not truly sterile, and many will conceive, eventually, without treatment. Infertility has a significant spontaneous cure rate that varies with female partner age, duration, past conception history, and the cause(s). The probability for achieving a live birth without treatment decreases with increasing age and duration of infertility.351,352 and 353,355,356 and 357 Overall, the likelihood of pregnancy without treatment declines by about 5% for each additional year of female partner age and by 15-25% for each added year of infertility.353 The largest majority of spontaneous pregnancies occur within 3 years; thereafter, the prognosis for success without treatment is relatively poor. Couples that have conceived before generally have a better prognosis than those who have never achieved pregnancy. The cause of infertility also affects the prognosis for success without treatment but, of course, cannot be determined without evaluation. Predictably, the diagnoses of anovulation and unexplained infertility have the best prognosis. The likelihood for success without treatment for couples with male factors, tubal disease, and endometriosis varies widely with the severity of disease; the prognosis is reasonably good for mild oligospermia, tubal adhesions, and mild endometriosis, and quite poor for severe male factors, tubal obstruction, and severe endometriosis.
Evaluation should be offered to all couples who have failed to conceive after a year or more of regular unprotected intercourse, but a year of infertility is not a prerequisite for evaluation. Earlier evaluation is justified for women with irregular or infrequent menses, history of pelvic infection or endometriosis, or having a male partner with known or suspected poor semen quality, and also is warranted after 6 months of unsuccessful effort for women over the age of 35 years.358
Education should be offered to any couple who seeks it, regardless whether they have made any active effort to conceive. It is always helpful to explain the reproductive process, to inform couples that normal cycle fecundability is approximately 20% (far lower than most realize), and to discuss the relationship between age and fertility, when it is relevant. In concerned couples who have not yet truly tested their fertility and have no obvious problems, some basic preliminary evaluation is reasonable to perform, if requested. Tests to confirm ovulation and semen quality are easy to perform, relatively inexpensive, minimally
invasive, and quickly can identify some of the most common reproductive problems. In women at high risk for diminished ovarian reserve, an ovarian reserve test is also reasonable, because results may help to determine when and how further evaluation and treatment should be recommended.
invasive, and quickly can identify some of the most common reproductive problems. In women at high risk for diminished ovarian reserve, an ovarian reserve test is also reasonable, because results may help to determine when and how further evaluation and treatment should be recommended.
Preliminary Evaluation of the Infertile Couple
Any evaluation of infertility must begin with a careful history and physical examination, which often will identify symptoms or signs that suggest a specific cause and help to focus evaluation on the factor(s) most likely responsible. In the female partner, relevant medical history and physical findings include the following359:
History
Gravidity, parity, pregnancy outcomes and associated complications.
Cycle length and characteristics, and onset and severity of dysmenorrhea.
Coital frequency and sexual dysfunction.
Duration of infertility and results of any previous evaluation and treatment.
Past surgery, its indications and outcome, and past or current medical illnesses, including episodes of pelvic inflammatory disease or exposure to sexually- transmitted infections.
Previous abnormal pap smears and subsequent treatment.
Current medications and allergies.
Occupation and use of tobacco, alcohol, and other drugs.
Family history of birth defects, mental retardation, early menopause or reproductive failure.
Symptoms of thyroid disease, pelvic or abdominal pain, galactorrhea, hirsutism, or dyspareunia.
Physical Examination
Weight and BMI.
Thyroid enlargement, nodule, or tenderness.
Breast secretions and their character.
Signs of androgen excess.
Pelvic or abdominal tenderness, organ enlargement, or mass.
Vaginal or cervical abnormality, secretions, or discharge.
Mass, tenderness, or nodularity in the adnexa or cul-de-sac.
Irregular or infrequent menses indicate ovulatory dysfunction. Previous treatment for cervical intraepithelial neoplasia or observations of a mucopurulent cervicitis or cervical stenosis helps to identify unusual women in whom the cervix may present an obstacle. A history of previous hysteroscopic or reconstructive uterine surgery or recently developing symptoms of menorrhagia suggest an abnormality of the uterine cavity; previous uncomplicated first- and second-trimester pregnancy terminations generally do not adversely affect subsequent fertility.360,361 Worsening dysmenorrhea, new onset of dyspareunia, or physical findings of focal tenderness or cul-de-sac nodularity suggest endometriosis. A history of pelvic infection, septic abortion, ruptured appendix, ectopic pregnancy, abdominal myomectomy, or adnexal surgery should raise suspicion for tubal or peritoneal disease.
Screening Tests
Pap smear screening is recommended for all sexually-active women of reproductive age who have a cervix. The date and results of the most recent pap smear should be documented and a pap smear performed, if needed. A blood type, Rh factor, and antibody screening (in Rh-negative women) also are recommended, if not already known.
The American College of Obstetricians and Gynecologists and the American College of Medical Genetics recommend that screening for cystic fibrosis (CF) be offered to individuals with a family history of CF, reproductive partners of individuals with CF, and couples planning a pregnancy or seeking prenatal care wherein one or both partners are Caucasian or of Ashkenazi Jewish descent, and that the test be made available to all patients on request.362 Sequential screening (testing one partner, and the second only if the first partner is identified as a carrier) is most cost effective. Interestingly, a 2007 study found that only 22/1,006 (2%) infertile non-Hispanic Caucasian couples offered counseling and screening (carrier frequency 1/25, detection rate 88%) chose to be tested, most citing the cost of screening.363
All women attempting pregnancy with undocumented previous rubella infection or vaccination should be tested for immunity, and vaccinated if seronegative. As there has never been a documented case of congenital rubella syndrome attributed to vaccine, the Centers for Disease Control and Prevention (CDC) has determined that women need not avoid pregnancy for more than 1 month after vaccination.364 The CDC also recommends that all women without history of previous infection or evidence of immunity or vaccination against varicella (chicken pox) receive two doses of vaccine and avoid pregnancy for 1 month after each dose.365
Screening for sexually-transmitted infections (STI) is recommended for all women at moderate to high risk for infection. Decisions regarding STI screening should consider that current recommendations from the CDC include screening all pregnant women for chlamydia and gonorrhea (nucleic acid-based tests), syphilis (rapid plasma reagin; RPR), hepatitis B (hepatitis B surface antigen; HBSAg), and voluntary screening for human immunodeficiency virus type 1 (HIV-1) at the first prenatal visit.366 For women receiving inseminations of donor sperm, the American Society for Reproductive Medicine (ASRM) considers HIV-1 screening mandatory, recommends screening for syphilis, hepatitis B and C, cytomegalovirus (CMV), HIV-2, and human T-cell lymphocyte virus (HTLV) types I and II, and suggests screening for chlamydia and gonorrhea at the discretion of the physician.367 For male partners of women receiving inseminations of donor sperm, the ASRM strongly recommends HIV-1 and recommends other STI screening. For recipients of donor oocytes or embryos and their male partners, the ASRM recommends screening for syphilis, hepatitis B and C, CMV, and HIV-1.367 Any additional screening laboratory tests should be directed by the medical history and clinical judgment.
Male Factor: Abnormalities of Semen Quality
The evaluation and treatment of male infertility is the focus of Chapter 30, but must be addressed briefly here because male factors explain or contribute significantly to infertility in up to 35% of couples. Semen analysis is therefore always an appropriate and important initial step in the evaluation of the infertile couple. In the absence of any known genital abnormality, trauma, surgery, or sexual dysfunction, physical examination of the male partner can be deferred pending the results of the initial semen analysis.
When semen analysis yields equivocal results, additional analyses are required to better define a suspected abnormality. A frankly abnormal semen analysis is indication for additional evaluation that may be conducted by a gynecologist having the necessary training and experience, but most often is performed by a urologist or other specialist in male reproduction.368 Invasive diagnostic procedures in the female partner generally are best deferred until evaluation of the male is completed. The range of effective treatment options for couples with severe male factor infertility is limited, and often will direct or even dictate what additional evaluation may be relevant in the female partner. When semen quality is normal, attention naturally turns to the female partner.
Ovarian Factor: Ovulatory Dysfunction
Overall, disorders of ovulation account for approximately 20% of the problems identified in infertile couples. Ovulatory dysfunction can be severe enough to prevent conception (anovulation), or only a contributing factor (oligoovulation). However, because cycle fecundability averages only approximately 20% even in normally fertile couples, the distinction is moot.
A number of methods can be used to determine if and when ovulation occurs. Directly or indirectly, all are based on one or another of the hormonal events that characterize the normal ovulatory cycle (Chapter 6). Each of the available tests is useful and no one test is necessarily best. Some are simple, noninvasive, and inexpensive, and others are more complicated, invasive, and costly. A few can predict when ovulation is likely, with varying accuracy. However, no test, regardless how sophisticated, can prove that ovulation has actually occurred; the only positive proof of ovulation is pregnancy. The most appropriate test to use varies with the information required. The same tests used to diagnose anovulation can be used to assess the effectiveness of treatment.
Menstrual History
Menstrual history alone often is significaent to establish a diagnosis of anovulation. Menses in normally ovulating women generally are regular, predictable, consistent in volume and duration, and typically accompanied by a recognizable pattern of premenstrual and menstrual symptoms. Conversely, those in anovulatory women generally are irregular, unpredictable or infrequent, vary in flow characteristics, and exhibit no consistent pattern of molimina. Women with regular menses are almost always ovulatory. Women with irregular or infrequent menses may ovulate, but not consistently, and do not require specific diagnostic tests to prove what is already obvious.
Basal Body Temperature (BBT)
Basal body temperature is body temperature under basal conditions, at rest. For practical purposes, BBT is measured each morning, upon awakening and before arising. Traditionally, BBT is measured with an oral glass-mercury thermometer having an expanded scale, typically ranging from 96.0 to 100.0 degrees Fahrenheit and marked in tenths of one degree; modern electronic thermometers are a suitable alternative, but only if they have the necessary accuracy
and precision. As a test of ovulation, daily BBT recordings are based on the thermogenic properties of progesterone; as levels rise after ovulation, BBT also increases. The effects are more qualitative than quantitative, are subtle but nonetheless distinct, and generally easy to detect when daily BBT recordings are plotted on graph paper.369 Synthetic progestins commonly used to induce menses in amenorrheic women (medroxyprogesterone acetate, norethindrone acetate) have similar thermogenic properties and also raise BBT.
and precision. As a test of ovulation, daily BBT recordings are based on the thermogenic properties of progesterone; as levels rise after ovulation, BBT also increases. The effects are more qualitative than quantitative, are subtle but nonetheless distinct, and generally easy to detect when daily BBT recordings are plotted on graph paper.369 Synthetic progestins commonly used to induce menses in amenorrheic women (medroxyprogesterone acetate, norethindrone acetate) have similar thermogenic properties and also raise BBT.
BBT is typically low and fluctuates between 97.0 and 98.0 degrees during the follicular phase of the cycle, modestly but distinctly higher (0.4-0.8 degrees) during the luteal phase, and falls again to baseline levels just before or after the onset of menses. In ovulatory women, a “biphasic” pattern usually is readily evident. The ideal BBT recording is distinctly biphasic and reveals a cycle between 25 and 35 days in length, with menses beginning 12 days or more after the rise in temperature. When pregnancy occurs in a monitored cycle, onset of menses is delayed and BBT remains elevated, reflecting the sustained production of progesterone by the corpus luteum stimulated by human chorionic gonadotropin (hCG).
BBT recordings provide objective evidence of ovulation and also reveal the approximate time of ovulation. Unfortunately, the temporal relationship between the thermogenic shift in BBT and ovulation frequently is misunderstood. BBT generally falls to its lowest level on the day before or day of ovulation, but the nadir in BBT cannot be reliably identified until after the temperature rises and remains elevated.370 The shift in BBT occurs when progesterone concentrations rise above approximately 3-5 ng/mL, 1 to 5 days after the midcycle LH surge and up to 4 days after ovulation.371 The temperature rise usually is somewhat abrupt, but may be gradual and difficult to define, and once apparent (2 or more days of temperature elevation), the most fertile interval has passed. In cycles monitored with BBT, the interval of highest fertility spans the 7-day interval immediately before the midcycle rise in BBT. Much of the uncertainty in predicting the time of ovulation can be avoided by reviewing a series of recordings, noting the earliest and latest days of the cycle on which the temperature shift occurred. Coital timing can be optimized by suggesting intercourse on alternate days beginning 7 days before the earliest observed rise in BBT and ending on the latest day it has been observed.
The principal advantage that BBT has over other tests of ovulation is low cost. BBT recordings also can reveal an abnormally long follicular phase and grossly short luteal phase that otherwise might go unrecognized, for which treatment is warranted. BBT monitoring is easy and non-invasive, but can become tedious over time. For some it also increases stress, serving as a daily reminder of unsuccessful efforts to conceive, each day beginning with thoughts of a family not yet realized. In the few women who menstruate regularly but do not exhibit a biphasic BBT, an alternative method should be used to document ovulation before assuming that treatment is required. Although there are more reliable methods to evaluate ovulatory function, BBT is still useful and may be the best method for couples who are reluctant or unable to pursue more formal and costly evaluations.
Serum Progesterone Concentration
A serum progesterone measurement is the simplest, most common, objective and reliable test of ovulatory function, as long as it is appropriately timed. Progesterone levels generally remain below 1 ng/mL during the follicular phase, rise slightly on the day of the LH surge (1-2 ng/mL) and steadily thereafter, peak 7-8 days after ovulation, and decline again over the days preceding menses. A progesterone concentration less than 3 ng/mL implies anovulation, except when drawn immediately after ovulation or just before the onset of menses, when lower levels naturally might be expected.372,373
When is the best time to measure the serum progesterone concentration to document ovulation? Ideally, the serum progesterone level should be drawn approximately one week
before the expected onset of menses, when the concentration is at or near its peak. Contrary to popular belief and practice, cycle day 21 is not always the best time to measure the serum progesterone concentration. Cycle day 21 is a good choice for women with cycles lasting approximately 28 days, but a poor choice for women with 35 day cycles. The normal ovulatory cycle is 25-35 days long and exhibits a 13-15 day luteal phase. At the extremes of normal, ovulation may occur as early as cycle day 10 (in a 25-day cycle) and as late as day 22 (in a 35-day cycle). If ovulation occurs on cycle day 10, day 21 falls 11 days after ovulation, well after progesterone concentrations peak and when they are again nearing basal levels. If ovulation occurs on cycle day 22, day 21 falls 1 day before ovulation, when progesterone levels have not yet started to rise. The best time to test will vary with the overall length of the menstrual cycle, aiming for approximately 1 week before the expected menses.
before the expected onset of menses, when the concentration is at or near its peak. Contrary to popular belief and practice, cycle day 21 is not always the best time to measure the serum progesterone concentration. Cycle day 21 is a good choice for women with cycles lasting approximately 28 days, but a poor choice for women with 35 day cycles. The normal ovulatory cycle is 25-35 days long and exhibits a 13-15 day luteal phase. At the extremes of normal, ovulation may occur as early as cycle day 10 (in a 25-day cycle) and as late as day 22 (in a 35-day cycle). If ovulation occurs on cycle day 10, day 21 falls 11 days after ovulation, well after progesterone concentrations peak and when they are again nearing basal levels. If ovulation occurs on cycle day 22, day 21 falls 1 day before ovulation, when progesterone levels have not yet started to rise. The best time to test will vary with the overall length of the menstrual cycle, aiming for approximately 1 week before the expected menses.
Serum progesterone levels also have been used to evaluate the quality of luteal function. Whereas the amount and duration of progesterone production certainly does reflect the functional capacity of the corpus luteum, a truly accurate measure requires daily serum progesterone determinations that are costly, and impractical.374,375 and 376 Judgments based on limited sampling, regardless how well timed, have numerous pitfalls and cannot define the quality of luteal function reliably.374,377,378,379,380 and 381 There is no consensus minimum serum progesterone concentration that defines normal luteal function. A midluteal serum progesterone level greater than 10 ng/mL is a popular standard,382 but the concentrations observed in normal and abnormal cycles and in conception and non-conception cycles in both fertile and infertile women vary widely and overlap greatly.383 One reason is that progesterone is secreted by the corpus luteum in distinct pulses, temporally linked to pulsatile luteinizing hormone (LH) secretion384,385; levels ranging from as low as 4 ng/mL to as high as 40 ng/mL can be observed within brief intervals of time.385 A midluteal serum progesterone concentration cannot define the quality of luteal function and has little value beyond documenting ovulation.
Urinary LH Excretion
A wide variety of different commercial products allow women to determine not only if they ovulate, but when, in advance of the actual event. Generally known as “ovulation prediction kits” or “LH kits,” the products are all designed to detect the midcycle LH surge in urine. Ovulation predictor kits take advantage of advances in hormone measurement technology, reducing what was once a very labor-intensive process in the hospital laboratory to one or two simple steps requiring only a few minutes time in the home.
The midcycle LH surge is a relatively brief event, typically lasting between 48 and 50 hours from start to finish. LH has a short half-life and is rapidly cleared via the urine. Ovulation predictor kits turn positive when the urinary LH concentration exceeds a threshold level normally seen only during the LH surge. In most cycles, the test is positive on a single day, occasionally on 2 consecutive days. To detect the LH surge reliably, testing must be done on a daily basis, generally beginning 2 or 3 days before the surge is expected, based on the overall length of the cycle. The first positive test provides all relevant information; there is no value in continued testing.
Test results are sensitive to both the volume of fluid intake and time of day. There is no need to restrict fluid intake, but patients should be advised to avoid drinking large volumes of fluid a short time before they plan to test. Logically, the first morning void would seem an ideal specimen to test because it is usually the most concentrated. However, results correlate best with the serum LH peak when testing is performed in the late afternoon or early evening hours (4:00-10:00 PM),371 probably because LH surges often begin in the early morning hours and are not detected in urine for several hours. Twice daily testing decreases
the frequency of false-negative results (failure to detect the LH surge in an ovulatory cycle), but generally is unnecessary. When performed daily and properly timed, testing will detect the LH surge in most ovulatory cycles. True false-positive tests (detection of an LH surge in an anovulatory cycle) occur in approximately 7% of cycles;386 equivocal or “borderline” results also are common and can be both confusing and frustrating.
the frequency of false-negative results (failure to detect the LH surge in an ovulatory cycle), but generally is unnecessary. When performed daily and properly timed, testing will detect the LH surge in most ovulatory cycles. True false-positive tests (detection of an LH surge in an anovulatory cycle) occur in approximately 7% of cycles;386 equivocal or “borderline” results also are common and can be both confusing and frustrating.
The accuracy of ovulation predictor kits varies. All are useful and reasonably reliable, but some are better and easier to use than others.347,387 The best products predict ovulation within the subsequent 24 to 48 hours, with greater than 90% probability.346,347 Ovulation generally occurs 14-26 hours after detection of the LH surge and almost always within 48 hours.346 Consequently, the interval of greatest fertility includes the day the surge is detected and the following 2 days. The day after the first positive test generally is the one best day for timed intercourse or insemination.346,388,389 Ovulation predictor kits are non-invasive, widely available, require relatively little time and effort, and invite women to become actively involved in their care. Their greatest advantage over other methods is their ability to predict when ovulation will occur. Accurate identification of the midcycle LH surge also defines the length of the follicular and luteal phases, which may reveal subtle and otherwise unrecognized cycle abnormalities warranting treatment. Urinary LH monitoring is perhaps best reserved for women who ovulate (based on menstrual history, BBT recordings, or an appropriately timed serum progesterone concentration), but have infrequent intercourse or require insemination.
Stay updated, free articles. Join our Telegram channel

Full access? Get Clinical Tree


