Background
Female urinary microbiota are associated with urgency urinary incontinence and response to medication. The urinary microbiota of women with stress urinary incontinence has not been described.
Objective
We sought to study the cross-sectional relationships between urinary microbiota features and demographic and clinical characteristics of women undergoing stress urinary incontinence surgery.
Study Design
Preoperative urine specimens were collected from women without urinary tract infection and were available from 197 women (174 voided, 23 catheterized) enrolled in a multicenter prospective randomized trial, the Value of Urodynamic Evaluation study. Demographic and clinical variables were obtained including stress and urgency urinary incontinence symptoms, menopausal status, and hormone use. The bacterial composition of the urine was qualitatively assessed by sequencing the bacterial 16S ribosomal RNA gene. Phylogenetic relatedness and microbial alpha diversity were compared to demographics and symptoms using generalized estimating equation models.
Results
The majority of 197 urine samples (86%) had detectable bacterial DNA. Bacterial diversity was significantly associated with higher body mass index ( P = .02); increased Medical, Epidemiologic, and Social Aspects of Aging urge index score ( P = .04); and hormonal status ( P < .001). No associations were detected with stress urinary incontinence symptoms. Increased diversity was also associated with a concomitant lower frequency of Lactobacillus in hormone-negative women.
Conclusion
Women undergoing stress urinary incontinence surgery have detectable urinary microbiota. This cross-sectional analysis revealed that increased diversity of the microbiota was associated with urgency urinary incontinence symptoms, hormonal status, and body mass index. In contrast, the female urinary microbiota were not associated with stress urinary incontinence symptoms.
Introduction
The influence of the human microbiota on health and disease is increasingly appreciated in a variety of medical fields. These microbial communities are often described by their predominant organism, the diversity of organisms within the community, and the amount of those organisms.
Female urinary microbiota (FUM), composed of resident bladder bacteria, were recently recognized when bacterial DNA and low levels of live bacteria were detected in catheterized urine specimens considered “sterile” by standard urine culture. Enhanced urine culture techniques have provided clear evidence that FUM microbes are alive; unlike standard urine culture protocols, these enhanced culture techniques provide the appropriate conditions for growth for a wide range of microbes. The living microbial community within the female bladder may provide insight into a variety of common urinary disorders, including urinary incontinence and urinary tract infections (UTI). The presence and response to urgency urinary incontinence (UUI) treatment appears related to FUM diversity and/or composition in adult women with UUI. There is also an association between the FUM and risk of UTI following urinary tract surgery or instrumentation. However, there is a lack of information regarding the FUM of adult women with stress urinary incontinence (SUI). The 2 most common forms of bothersome urinary incontinence (UUI and SUI) often coexist in adult women, especially those seeking surgical treatment for SUI. Information concerning the FUM has the potential to further develop the phenotype of adult women affected by urinary incontinence, with the hope of improving the targeting of treatment to improve overall outcomes.
The National Institutes of Health sponsored a large, multicenter, clinical trial of women with uncomplicated SUI planning surgery and previously established a biorepository of urine samples collected for various scientific purposes. In this substudy, we describe the FUM analysis using 16S ribosomal RNA (rRNA) gene sequencing to characterize the cross-sectional relationships between FUM parameters and demographic and clinical characteristics of adult women undergoing surgery for SUI.
Materials and Methods
Subject recruitment and urine collection
The Value of Urodynamic Evaluation study was an institutional review board–approved, multicenter prospective randomized trial comparing surgical outcomes using 2 strategies for presurgical testing: multichannel urodynamic testing vs standardized basic office evaluation. Briefly, adult women were eligible if they had reported symptoms of SUI ≥3 months; a postvoid residual <150 mL; a negative urinalysis/standard urine culture; clinical assessment of urethral mobility; desire for SUI surgery; a positive provocative stress urinary test; and a qualifying Medical, Epidemiologic, and Social Aspects of Aging (MESA) questionnaire subscale score (stress > urge). Demographic and clinical characteristics were obtained by self-report including hormonal status, which was categorized by the study team into the hormone group that most appropriately described the patient’s hormone use: premenopausal, postmenopausal (with or without self-reported, current exogenous hormone use), or uncertain about status.
Participants in the main study provided written consent to contribute a single baseline urine specimen to the biorepository. Urine specimens were collected prior to surgery by a standard protocol and tested by dipstick to exclude UTI at study entry. Specimens were centrifuged at 500–1500 g for 10 minutes and the supernatant dispensed into ten 2-mL microfuge tubes, which were frozen at –80°C until shipped on dry ice to the National Institute of Diabetes and Digestive and Kidney diseases biorepository. Available baseline urine specimens with sufficient volume for the planned studies were shipped to Loyola University Chicago, (Maywood, IL) on dry ice, and stored at –80°C until processed for sequence analysis. Samples from 197 of the 630 (31%) Value of Urodynamic Evaluation study participants were used in this analysis; most (174) samples had been obtained by clean catch, with the remaining 23 by catheterization. Analyses for this report were approved by the Loyola University Chicago Institutional Review Board.
16S rRNA gene sequencing
Microbial composition was determined by sequencing the variable 4 (V4) region of the bacterial 16S rRNA gene, as described. The V4 region is ∼250 base pair (bp), ideal for MiSeq sequence technology (Illumina, San Diego, CA), and sufficient to classify most bacteria to the family or genus level. DNA isolation was performed in a laminar flow hood to avoid contamination. Genomic DNA was extracted from 1 mL of urine, using validated protocols. The V4 region was amplified by 2-step polymerase chain reaction (PCR), using modified universal primers 515F and 806R, as described. Extraction negative controls (no urine) and PCR negative controls (no template) were included to assess contribution of extraneous DNA from reagents. Final PCR products were purified from unincorporated nucleotides and primers using Qiaquick PCR purification kit (Qiagen, Valencia, CA) and Agencourt AMPure XP-PCR magnetic beads (Beckman Coulter, Brea, CA). Purified samples were normalized to equal DNA concentration, as determined by Nanodrop spectroscopy (Thermo Scientific, Waltham, MA). The sample library and PhiX sequencing control library (Illumina) were denatured and added to the 2 × 250 bp sequencing reagent cartridge, according to manufacturer’s instructions (Illumina).
Sequence processing
Each specimen was sequenced in duplicate and classified by phylogenetic diversity as measured by Bray-Curtis dissimilarity. A phylogenetic tree was generated and compared to percent total classified reads (relative abundance) at each taxonomic level (phyla, class, order, family, genus). For a genus level example, see Figure 1 .
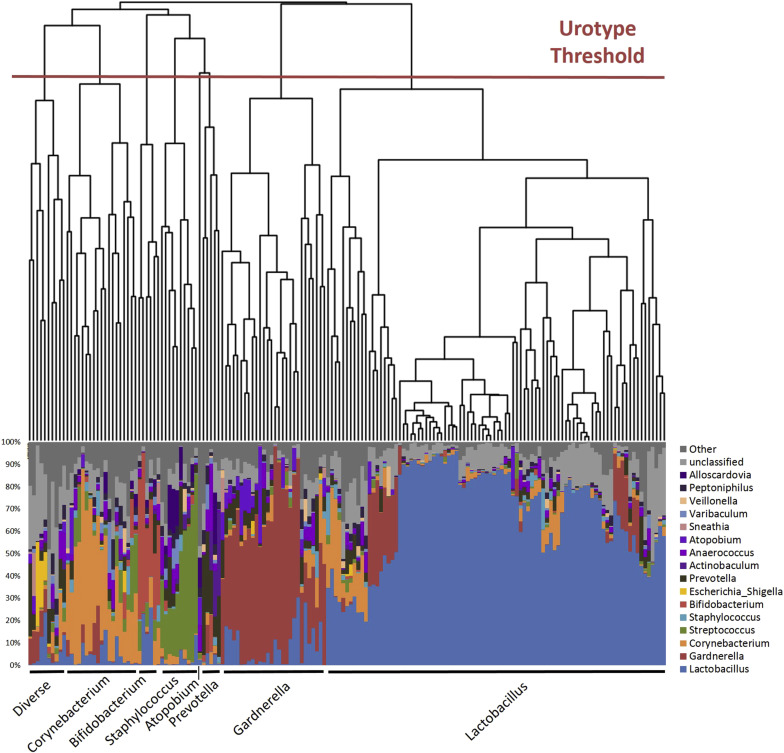
Each major branch or clade (termed urotype) in the phylogenetic tree was named for the predominant classified taxon (eg, Lactobacillus ). When there was no predominant taxon, we used the term “nonpredominant” to describe the urotype. MiSeq sequence reads were processed following mothur MiSeq standard operating procedure at http://www.mothur.org/wiki/MiSeq_SOP , with minor modifications. Mothur software (version 1.34.4) was used to process raw reads and, using default mothur parameters, to remove low-quality and chimeric sequences. Taxonomic classification from phylum to genus level of sequence reads was performed by the RDP classifier (version 2.5) using the default 0.8 confidence threshold. The sampling depth for this analytic set was set at 2000 reads; the Kolmogorov-Smirnov test confirmed that when subsampling depth exceeded 2000 reads, the distribution of subsampled and original reads distribution had >95.9% similarity among all samples.
Most (171/197) samples had detectable DNA with 338,000 and 340,000 reads subsampled for replicates 1 and 2, respectively. The 26 samples without detectable DNA following PCR amplification were classified as below the detection threshold. Due to read depths <2000, 2 samples from replica 1 and 1 sample from replica 2 were also classified as below the detection threshold, for a total of 28 in replica 1 and 27 in replica 2. Using mothur’s built-in average-linkage clustering algorithm, the cleaned high-quality sequences were clustered into species-level operational taxonomic units (OTUs) based on the commonly used 97% similarity cutoff, resulting in 2579 and 3082 OTUs for replicas 1 and 2, respectively. We used the resultant OTU count table and the R package vegan to determine the Chao1 richness estimate, Pielou evenness index, and Shannon diversity index, which accounts for both richness and evenness, 2 measures of microbial diversity. Richness is a measure of the total number of unique taxa within a given individual, but does not take into account the distribution of those taxa. In contrast, evenness is a measure of distribution, or equality of representation, of taxa within an environment. Samples below the detection threshold lack diversity measurements; these were excluded from subsequent diversity comparisons.
Statistical analysis
Generalized estimating equations (GEE), extensions of generalized linear models that account for correlation between replicas, were used to describe associations between demographic and clinical factors with diversity measurements after adjusting for genus urotype. A gamma distribution with a log link was assumed for Shannon, Chao, and Pielou diversity measurements, due to their skewed nature. To be inclusive, we did not make adjustments for type I error in the GEE analyses when determining potential clinical and demographic associations with microbiota characteristics. Only results from the lowest detected resolution level (ie, genus) are reported. There was insufficient sample size and power to compare urotypes between catheterized and voided samples. All statistical analyses were conducted using software (SAS, v9.4; SAS Software Cary, NC) and statistical significance was assessed at the α=0.05 level.
Results
The demographic and clinical characteristics of the 197 participants we studied ( Table 1 ) were similar to those of the overall trial population. Most of these participants were non-Hispanic Caucasian (79%) and currently married (74%). The mean age of the subset was 51 (SD 9.7) years. Of women, 42% were premenopausal, 31% postmenopausal without current exogenous hormone use, and 18% were using exogenous hormones; the remaining 10% were unsure of their status. Consistent with the entrance requirements for the trial, women reported stress-predominant urinary incontinence with a median MESA stress index score of 78 (interquartile range 59–89) and 76% reporting urinary leakage every day and/or night. Concomitant urinary symptoms were common at time of trial enrollment; the median MESA UUI index score was 33 (interquartile range 17–50). As only 21 participants had an urgency index of 0, dichotomous group comparisons by urgency index were not performed.
| Demographics | N = 197 |
|---|---|
| Age, y, mean (SD) | 51 (9.7) |
| Body mass index, mean (SD), kg/m 2 | 29 (5) |
| Race/ethnicity a | |
| Hispanic | 23 (12%) |
| Non-Hispanic Caucasian | 156 (79%) |
| African American | 9 (5%) |
| Other | 9 (5%) |
| Education | |
| Less than high school | 6 (3%) |
| High school/GED | 39 (20%) |
| Some college | 58 (29%) |
| Completed 4 y of college | 53 (27%) |
| Graduate/professional degrees | 41 (21%) |
| Self-reported hormonal status a | |
| Premenopausal | 82 (42%) |
| Postmenopausal lacking exogenous hormones | 61 (31%) |
| Postmenopausal or uncertain about status on exogenous hormones | 35 (18%) |
| Uncertain about status lacking exogenous hormones | 19 (10%) |
| Ever pregnant | 190 (96%) |
| No. of pregnancies, median (range) | 3 (0–10) |
| Vaginal parity, median (range) | 2 (0–7) |
| History of smoking | 66 (33%) |
| Currently smoking | 20 (10%) |
| Currently married | 145 (74%) |
| Prior pelvic surgeries | 151 (77%) |
| Prior nonsurgical treatment | 122 (62%) |
| Symptom severity | |
| MESA score, median (IQR) | |
| Stress index b | 78 (59–89) |
| Urge index b | 33 (17–50) |
| Frequency of urine leakage | |
| Less than once/mo | 0 |
| Few times/mo | 11 (6%) |
| Few times/wk | 36 (18%) |
| Every day and/or night | 150 (76%) |
| Voiding phase dysfunction | 7 (4%) |
| Suspected intrinsic sphincter deficiency | 39 (20%) |
| Urine measures | N = 167 |
|---|---|
| Specific gravity, median (IQR) | 1 (1.01–1.02) |
| Urine pH, median (IQR) | 6 (5–7) |
| Glucose positive | 6 (4%) |
| Blood | |
| Negative | 110 (70%) |
| Trace, nonhemolyzed | 11 (7%) |
| Moderate, nonhemolyzed | 5 (3%) |
| Trace | 11 (7%) |
| Small + | 6 (4%) |
| Moderate ++ | 6 (4%) |
| Large +++ | 9 (6%) |
| Protein | 25 (16%) |
| Diversity outcome measures, mean (SD) c | |
| Shannon | 1.86 (0.97) |
| Chao | 124.08 (59.35) |
| Pielou | 0.43 (0.19) |
Stay updated, free articles. Join our Telegram channel

Full access? Get Clinical Tree


