Background
With rising health care expenditures, hospitals must contain costs in ways that maintain high-quality patient care. A significant portion of perioperative costs are associated with materials and supplies; many reusable instruments on surgical trays go unused, which may account for significant annual excess processing costs. Reorganizing gynecologic trays to contain fewer instruments can result in significant cost savings. In the field of operative gynecology, there has been considerable attention to the various costs and surgical outcomes that are associated with hysterectomy performed in the abdominal, vaginal, and laparoscopic approaches; however, little research has been done on the cost differences that are associated with the reusable instruments that are used in these approaches.
Objectives
This study aimed to identify the percent usage of instruments within gynecologic surgery and to identify differences by surgical approach. We further aimed to estimate the costs of sterilizing surgical instruments and estimate the excess costs that are associated with processing unused instruments.
Study Design
This was a single site observational study. Specific instruments that were used from incision to closure were recorded on operating room count sheets via direct observation of surgeries that were performed in the gynecologic operating rooms by a trained investigator. Cost data on instrument transportation, employee wages, and instrument replacement was obtained from institutional supply chain management.
Results
In total, 28 surgical cases (5 abdominal, 11 laparoscopic, and 12 vaginal) were analyzed, with an average of 2 hours 37 minutes operating room time and 5.4 instrument trays for each case. One hundred fifty trays were observed. Trays had an average of 38 instruments per tray (range, 1–141). Surgeons used an average of 36.7 instruments of 184 available instruments per case, for a usage rate of 20.5±2.8%. A significant difference was noted between usage rates in abdominal cases (26.3±6.5%) and vaginal cases (13.6±3.3%) but not between laparoscopic (19.4±4.2%) vs other approaches. Instrument use was correlated inversely with the number of instruments, with an average usage rate of 18.7% for trays that contained ≥10 instruments. Total annual institutional cost associated with instrument processing was estimated at $3.19 per instrument.
Conclusion
Instrument usage in the gynecologic operating room is low, and the cost of processing instruments is significant. Availability of certain instruments is necessary for patient safety in the event of rare unexpected events. However, given that less than one quarter of the instruments pulled for surgery are used and that total processing cost per instrument exceeds $3.00, careful review of what instruments are included in each tray is warranted. Clearly, significant cost-savings are possible while concurrently balancing safety concerns.
The United States has experienced unprecedented growth in per capita health care costs, which are higher than any other nation. With the rising cost of health care, hospitals have considerable pressure to limit expenditures without sacrificing high-quality patient care, and surgeons can and should contribute to the effort to contain costs.
Within the operating room (OR) in particular, 1 institution estimated that 56% of perioperative costs are associated with materials and supplies. Previous research has shown that as many as 87% of reusable instruments on surgical trays go unused in specialty surgical cases and that eliminating unneeded instruments could yield thousands of dollars in cost-savings for a single tray type. Reorganizing gynecologic laparoscopic trays to contain fewer, more essential instruments resulted in a cost-saving that was estimated at $13,889 for a single tray type within 1 institution. In the field of operative gynecology, there has also been considerable attention to the various costs and surgical outcomes that are associated with hysterectomy performed in the abdominal, vaginal, and laparoscopic approaches. Intraoperative costs for laparoscopic hysterectomy have been shown to be significantly higher than vaginal and abdominal hysterectomy because of the use of disposable instruments ; no studies have been identified that reported on the cost differences that are associated with reusable instruments in these approaches or in gynecologic surgery in general.
This study aimed to identify the percent usage of instruments in common trays that are used for non-emergent gynecologic surgery and to identify differences by surgical approach. We further aimed to estimate the costs of sterilizing surgical instruments and thus estimate the excess costs that are associated with processing unused instruments.
Materials and Methods
OR
This study was conducted over a 6-week period in the gynecologic ORs at Vanderbilt University Medical Center. Cases were limited to non-emergent gynecologic procedures. Surgeries were classified as “abdominal,” “vaginal,” or “laparoscopic” and were distinguished by surgeon, type of surgery, and length of procedure from incision to closure, which was timed by a trained investigator (M.M.V.M.). Cases were observed from OR set up until closing of skin. Count sheets for each surgical tray were obtained from the institution’s Department of Supply Chain Management and were used to tally “instruments used,” which was defined as touching any operating surgeon’s hand. Total OR time was obtained from the anesthetic care record.
Sterilization
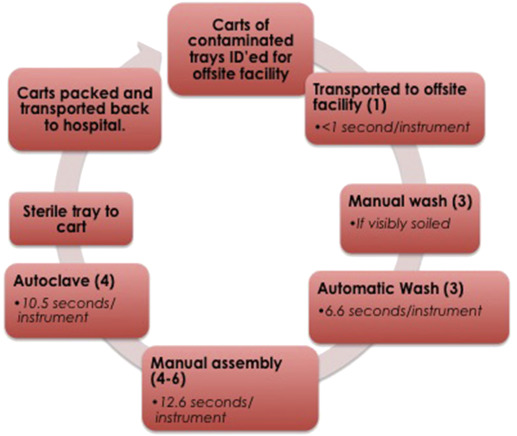
The sterilization process was observed at the institution’s off-site facility from arrival of case carts through the autoclaving of instruments. Tray assembly that was performed by 3 separate employees was timed with a a calibrated stopwatch and included time away from the workspace only if related to the current tray being processed, such as recleaning or obtaining a missing instrument. System lead time and bottlenecks were determined by process analysis and observed throughput times (the time to complete 1 tray at each station). Throughput times were defined as the seconds per instrument for each step when all stations for a given step were taken into account ( Figure 1 ). For example, if a step in the process takes 1 hour to process 1 tray and there are 3 stations within that step, throughput time is 1 hour per 3 stations, which equals 20 minutes. The bottleneck was defined as the step with the lowest total capacity (defined as maximum instruments per hour). We calculated throughput times estimating 4 trays per case cart (range, 1–8) and 50 instruments per tray, as well as 30 minutes from institution to sterile processing center, although both actual number of instruments and transportation time can vary significantly. Despite the fact that gynecology averaged 38.5 instruments per tray, this facility processes instruments from multiple specialties with significantly larger trays and does not distinguish by specialty while processing the trays. Therefore, we believed that 50 instruments was a better estimate.

Cost
Cost and wage data were obtained from Vanderbilt’s Department of Supply Chain Management.
Statistics
All statistical analysis was calculated with Microsoft Excel (Microsoft Corporation, Redmond, WA). Correlation between assembly time and number of instruments per tray was determined with simple linear regression; basic statistical analysis was used to determine confidence intervals. Significance between surgical approach data was determined with a 2-proportion z test.
Results
OR
Twenty-eight surgical cases were observed over a 6-week period with 15 different surgeons. These 28 cases were comprised of 12 vaginal, 11 laparoscopic, and 5 abdominal cases. Mean OR time was 167 minutes (determined from anesthetic care records); incision to closing time was 100 minutes (vaginal, 70; laparoscopic, 111; abdominal, 167 [timed by M.M.V.M.]). The hour of OR time that was not spent in surgery was attributed to the inducing and terminating of anesthesia and draping, sterilizing, and postoperatively cleaning and dressing the patient. A total of 150 trays of 24 different types were observed in the OR, at an average of 5.4 trays per case (range, 2–10), with no significant difference among approaches (vaginal, 4.8; laparoscopic, 5.7; abdominal, 5.8).
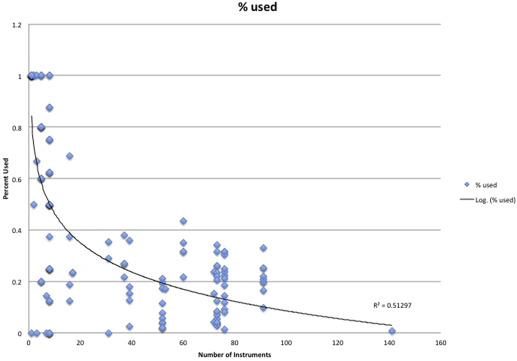
There was an average of 184 instruments on the field (range, 54–380) and an average of 37 instruments used by surgeons per case (range, 10–67). Overall usage of instruments was 20.5% (95% confidence interval, 17.7–23.4%). Instrument usage per tray decreased logarithmically with increasing number of instruments on the tray ( Figure 2 ). Subgroup analysis of the 80 trays with ≥10 instruments demonstrated a usage rate of 18.7% (95% confidence interval, 16.0–21.4).

Across surgical approaches, we found no significant difference in usage rates when considering all trays (vaginal, 34.5%; laparoscopic, 40.8%; abdominal, 37.3%). Subgroup analysis of trays with ≥10 instruments showed a significant difference between vaginal (13.6±3.3%) and abdominal (26.3±6.5%) approaches, but not between either of the aforementioned approaches and laparoscopy (19.4±4.2%; Table 1 ). Some trays had consistently lower usage than others ( Table 2 ).
| Approach | Cases, n | Total trays observed, n | Trays with ≥10 instruments, n | Trays/case, n | Tray usage, % a , b | Tray usage, % b , c |
|---|---|---|---|---|---|---|
| Vaginal | 12 | 58 | 34 | 4.8 | 34.5±12.5 | 13.6±3.3 d |
| Laparoscopic | 11 | 63 | 24 | 5.2 | 40.8±12.8 | 19.4±4.2 |
| Abdominal | 5 | 29 | 22 | 5.8 | 37.2±10.7 | 26.3±6.6 d |
| Total | 28 | 150 | 80 | 5.4 | 37.7±5.3 | 18.7±2.7 |
Stay updated, free articles. Join our Telegram channel

Full access? Get Clinical Tree


