Cardiopulmonary Critical Care and Shock
Ronald B. Hirschl
Kurt Heiss
Department of Surgery, University of Michigan Health System, C.S. Mott Children’s Hospital, Ann Arbor, Michigan 48109-0245.
Departments of Surgery and Pediatrics, Emory University School of Medicine, Emory Children’s Center, Atlanta, Georgia 30322.
Support of oxygen delivery is essential to the care of the critically ill. Whether through interventions designed to correct deviations in cardiac output, oxygenation, or hemoglobin content, the overall therapeutic goal is to maintain perfusion and oxygen delivery to the tissues. Lactic acidosis, impairment of organ function, and eventual death of the organism are the sequelae of inadequate oxygen delivery. This chapter discusses the hemodynamic evaluation and management of critically ill patients, with particular emphasis on the assessment and maintenance of optimal oxygen delivery (DO2) and oxygen consumption (VO2) relations.
OXYGEN KINETICS
Oxygen Consumption
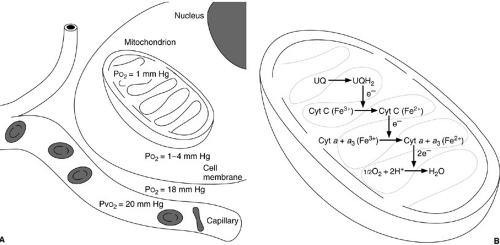
Oxygen-based metabolism is necessary to maintain cell life. The cellular milieu typically requires an oxygen tension of about 1 to 4 mm Hg to sustain baseline VO2 levels (1). Intravascular venous oxygen tensions of at least 20 mm Hg are required to maintain an appropriate oxygen gradient to achieve these minimal levels of intracellular oxygen tension (2). Oxygen is necessary to provide reduction of cytochromes A and A3 to allow oxidative phosphorylation to occur (Fig. 10-1) (3). Hypoxemia results in a decrease in the availability of oxygen to mitochondria. The consequence is inhibition of Krebs cycle activity with reduction in adenosine triphosphate (ATP) production. With a decrease in perfusion, metabolism of other substrates such as glucose by the glycolytic pathway is necessary to maintain cellular metabolic processes. As ATP stores diminish, cellular synthetic and transport functions become impaired and eventually stop. With continued hypoxia, mitochondrial and endoplasmic reticulum swelling is observed, and lysosomal rupture and intracellular proteolysis follow.
The oxygen consumption of the organism is the sum of the metabolic needs of the individual cells. In adults, VO2 is typically 3 mL per kg per minute (120 mL per m2 per minute) under basal conditions (4). It can range as high as 8 mL per kg per minute, depending on the size of the patient. The VO2 levels are greater in smaller patients, in whom the surface area/body mass ratio is high. The basal metabolic rate is regulated by the hypothalamus with control by thyroid hormone and catecholamine availability. The VO2 levels decrease in the settings of hypothermia, hypothyroidism, and paralysis. In contrast, muscular activity, hyperthermia, hyperthyroidism, catecholamine production or administration, and cytokine expression all increase VO2. Examination of total body oxygen consumption, however, fails to reflect the variation found in individual organs. Especially high VO2 levels are observed in the heart (30 to 80 mL per kg per minute), the liver (25 to 50 mL per kg per minute), and the alimentary tract (25 mL per kg per minute). Oxygen consumption can vary even within an individual organ; for example, an increase in heart rate or afterload can result in up to a threefold increase in VO2 in the heart (5). A similar increase may be observed in the gastrointestinal tract after consumption of food, in the musculoskeletal system with exercise, and in the musculoskeletal system with labored breathing (Table 10-1).
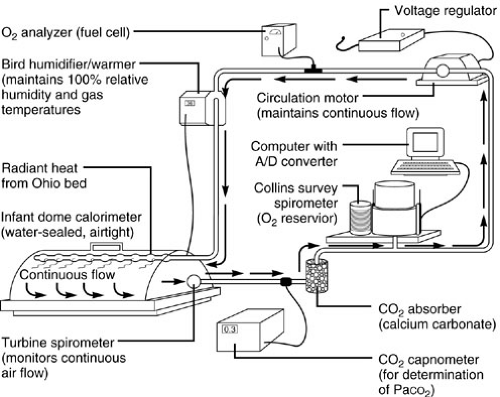
Precise measurement of oxygen consumption in the intensive care unit is often difficult. Three methods are in reasonably frequent use: (1) closed-circuit rebreathing volumetric analysis, (2) mixed expired gas analysis, and (3) calculations based on the Fick equation (6). Closed-circuit breathing volumetric spirometry is the gold standard because it directly measures the actual volume of oxygen; the
circuit contains a spirometer and a carbon dioxide scrubber (7,8) (Fig. 10-2). Any leak in the system has a large effect on the volumetric measurement and, therefore, introduces substantial error into oxygen consumption assessment. This technique is most easily applied, therefore, to mechanically ventilated patients with endotracheal tubes because concerns regarding nose and mouth closure during analysis are obviated.
circuit contains a spirometer and a carbon dioxide scrubber (7,8) (Fig. 10-2). Any leak in the system has a large effect on the volumetric measurement and, therefore, introduces substantial error into oxygen consumption assessment. This technique is most easily applied, therefore, to mechanically ventilated patients with endotracheal tubes because concerns regarding nose and mouth closure during analysis are obviated.
The second method of measuring oxygen consumption is by inspired and expired gas analysis (9,10) (Fig. 10-3). Precise measurement of the oxygen concentration in both the inspired (FIO2) and the expired (FEO2) gas is performed. The difference is multiplied by the minute volume ventilation to yield VO2. Three potentially imprecise measurements are required: FIO2, FEO2, and minute volume ventilation. This technique is most suitable for the patient breathing air because the inspired gas oxygen concentration may be assumed rather than measured. Unfortunately, most critically ill patients require an increase in inspired gas and large minute volumes for effective ventilation, both of which increase the potential for error associated with oxygen consumption assessment by mixed expiratory gas analysis.
TABLE 10-1 Factors Contributing to Alterations in Oxygen Consumption. | |
|---|---|
|
The third technique for oxygen consumption measurement applies Fick’s axiom, which states that the VO2 is exactly equal to the amount of oxygen taken up in the pulmonary capillaries from the airway (11). This may be expressed by the equation:
VO2 = Q × (CaO2 – CVO2)
where Q = cardiac output, CaO2 = oxygen content of arterial blood, and CvO2 = oxygen content of venous blood.
Because mixed venous blood must be analyzed, this technique is only applicable to the patient with a pulmonary artery catheter in place. Because of the error introduced by both cardiac output measurements and blood gas analysis, this technique is the least accurate and should only be used to provide a rough estimate of oxygen consumption or in situations in which the two previously discussed techniques cannot be used.
Oxygen consumption measurements must be converted from atmospheric temperature–pressure–saturated to standard temperature–pressure–dry units. The conversion adjusts the VO2 measurement by 15% to 20%.
OXYGEN DELIVERY
Three clinical factors are manipulated in an attempt to improve oxygen delivery: cardiac output, hemoglobin concentration, and arterial blood oxygen saturation (SaO2). Although we tend to address each individually, it is the product of the three that allows one to achieve sufficient oxygen delivery. The following calculation reveals the relation of these three factors to one another and to the DO2 (12) (Fig. 10-4):
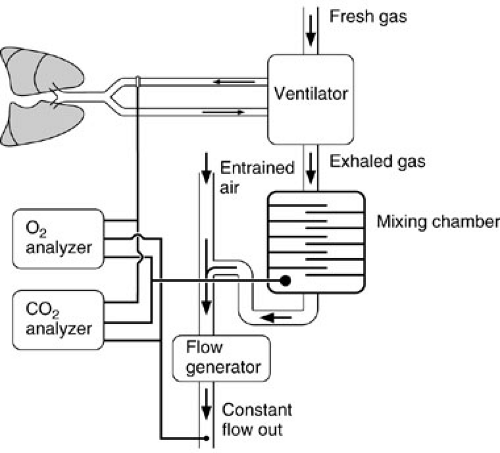 FIGURE 10-3. Determination of oxygen consumption by expired gas analysis. Both inspired and expired gas are assessed by the O2 and CO2 analyzers. |
DO2 = Q × [(1.36 × serum hemoglobin concentration × SaO2 + (0.003 × PaO2
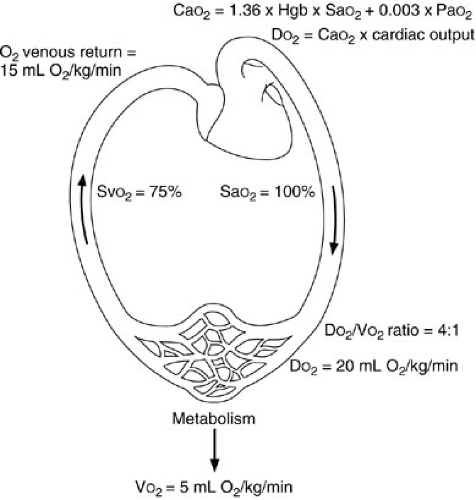 FIGURE 10-4. This schematic illustration of oxygen kinetics demonstrates the relation of oxygen consumption (VO2), oxygen delivery (DO2), and the mixed venous oxygen saturation (SvO2). |
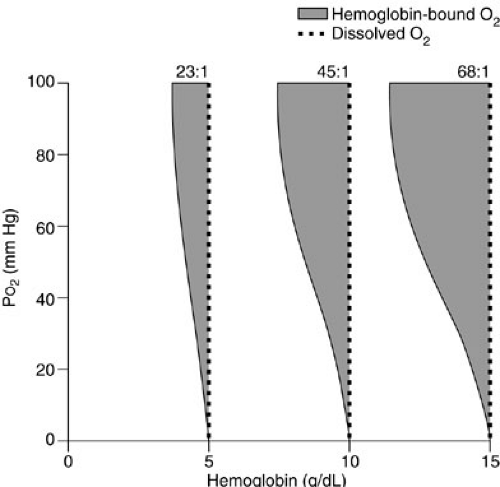
Note that the contribution of the partial pressure of arterial oxygen (PaO2) to oxygen delivery is minimal and, therefore, may be disregarded in many circumstances. Each gram of hemoglobin combines with up to 1.36 mL of oxygen. If the hemoglobin concentration of the blood is normal (15 g per dL) and the hemoglobin is 100% saturated, the amount of oxygen bound to hemoglobin is 20.4 mL per dL. In addition, about 0.3 mL of oxygen is physically dissolved in each deciliter of plasma, which makes the oxygen content of normal arterial blood equal to about 20.7 mL per dL. Similar calculations reveal that normal venous blood oxygen content is about 15 mL per dL. Typically, DO2 is 12 to 15 mL per kg per minute or 500 to 600 mL per kg per minute, which is four to five times greater than the associated oxygen consumption (4) (Fig. 10-5). Note that the product of the cardiac output and arterial oxygen content must be multiplied by a factor of 10 dL per L because cardiac output is measured in liters per minute, but arterial oxygen content is measured in milliliters per deciliter. Oxygen kinetic measurements are normalized to either body surface area (mL per m2 per minute) or weight (mL per kg per minute).
Oxygen content is the most important measure of oxygen in blood, although partial pressure of oxygen (PO2) and oxyhemoglobin saturation are more commonly assessed in the intensive care unit (Fig. 10-6). The partial pressure of oxygen is measured in a blood gas machine using a silver wire anode and platinum cathode. These are encased in glass, surrounded by silver chloride electrolyte, and covered with a polyethylene membrane that is permeable to oxygen (13). When oxygen-containing gases or fluids are exposed to the membrane, current flow is generated within the electrode, and this is used to determine oxygen concentration.
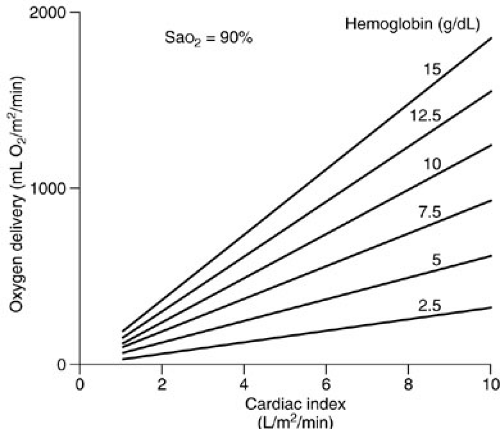 FIGURE 10-5. Oxygen delivery can be calculated if hemoglobin concentration and cardiac output data are available. |
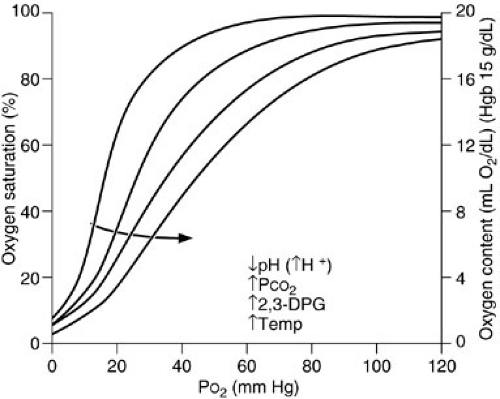
The amount of oxygen carried in plasma is minimal at one atmosphere pressure, although supersaturated oxygen solutions capable of carrying up to 16 times as much oxygen are being investigated (14). The most efficient way to increase oxygen content in a patient is to increase the oxygen-carrying capacity of the blood by increasing red blood cell mass. Normal hemoglobin contains two α and two β chains, with four associated iron heme groups. Oxygen forms a reversible covalent bond with the ferrous ion within the heme molecule. Arterial hemoglobin saturation is a function of the PaO2 and the affinity of oxygen for hemoglobin. This is described by the oxyhemoglobin dissociation curve (15) (Fig. 10-7). At the normal physiologic arterial PaO2 of 100 mm Hg, arterial oxygen saturation is 100%, whereas at a normal venous PO2 of 40 mm Hg, the mixed venous oxygen saturation (SvO2) is 75%. The normal PO2 that achieves a hemoglobin saturation of 50% (P50) is 27 mm Hg. Hemoglobin–oxygen affinity may be altered by a number of factors: increases in H+ ion (decreased pH), PaCO2, temperature, and erythrocyte 2,3-diphosphogycerate (2,3-DPG) concentration all induce a shift of the oxyhemoglobin dissociation curve to the right, which means that the hemoglobin oxygen saturation is decreased if free PaO2 remains constant (15). In contrast, decreases in these variables increase hemoglobin affinity for oxygen. During normal metabolism at the tissue
level, pH is low, PCO2 has accumulated, and temperature is elevated. These conditions favor the release of oxygen from the hemoglobin molecule at the relatively low oxygen level found at the tissues. At the lung, however, conditions favor oxygen pickup rather than release: PCO2 is lower and pH is higher. Thus, the factors affecting hemoglobin oxygen saturation tend to increase oxygen content and delivery at the lung and oxygen off-loading at the tissue level. The 2,3-DPG has a profound effect on oxygen affinity. It binds to hemoglobin, decreasing hemoglobin affinity for oxygen, making less hemoglobin available for oxygen binding. Although 2,3-DPG binds rapidly and effectively to adult hemoglobin, it interacts poorly with fetal hemoglobin. As a result, oxygen affinity of fetal hemoglobin is high and the curve shifts to the left. This provides the fetus with an effective method of extracting and releasing oxygen in the face of low umbilical vein PO2 levels.
level, pH is low, PCO2 has accumulated, and temperature is elevated. These conditions favor the release of oxygen from the hemoglobin molecule at the relatively low oxygen level found at the tissues. At the lung, however, conditions favor oxygen pickup rather than release: PCO2 is lower and pH is higher. Thus, the factors affecting hemoglobin oxygen saturation tend to increase oxygen content and delivery at the lung and oxygen off-loading at the tissue level. The 2,3-DPG has a profound effect on oxygen affinity. It binds to hemoglobin, decreasing hemoglobin affinity for oxygen, making less hemoglobin available for oxygen binding. Although 2,3-DPG binds rapidly and effectively to adult hemoglobin, it interacts poorly with fetal hemoglobin. As a result, oxygen affinity of fetal hemoglobin is high and the curve shifts to the left. This provides the fetus with an effective method of extracting and releasing oxygen in the face of low umbilical vein PO2 levels.
Based on the measured PaO2, temperature, and pH, blood gas machines often provide an estimate of the hemoglobin saturation. These calculated values often contain substantial error. Therefore, the hemoglobin saturation is best measured directly with a spectrophotometer known as an oximeter. During standard oximetry, a small sample of whole blood is aspirated into a cuvette, where the hemoglobin is hemolyzed (16). Light is then passed through the cuvette, and the absorption spectrum is assessed at each of four wavelengths, allowing determination of the concentration of oxyhemoglobin, reduced hemoglobin, methemoglobin, and carboxyhemoglobin. Simultaneously, measurement of reflected light intensity also allows measurement of hemoglobin content. When total hemoglobin content, hemoglobin oxygen saturation, PO2 of oxygen dissolved in plasma, and cardiac output are known, oxygen content and oxygen delivery can both be calculated.
Autoregulation of Oxygen Delivery
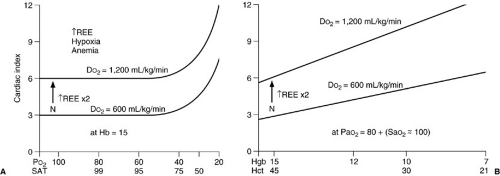
Acute changes in oxygen delivery are the result of alterations in cardiac output (or cardiac index; Fig. 10-8). The stimulus for an increase in cardiac output in response to reduced oxygen delivery is unclear, although there is evidence that cells similar to those of the carotid body may reside at the bifurcation of the main pulmonary artery
(glomus pulmonale) and regulate cardiac output in response to changes in venous oxygen or carbon dioxide levels (17). The cardiac output response to reductions in PaO2 or hemoglobin content results in an increase only to the level necessary to reestablish normal oxygen delivery. If the cardiac output response is inadequate to normalize DO2 on a chronic basis, red cell mass can be increased through erythropoietin production. When cardiac output does not respond adequately to normalize DO2, total body oxygen extraction may increase from a normal of 25% up to a maximum of 50% to 60%. Further reductions in DO2 are met with pathologic reductions in oxygen consumption.
(glomus pulmonale) and regulate cardiac output in response to changes in venous oxygen or carbon dioxide levels (17). The cardiac output response to reductions in PaO2 or hemoglobin content results in an increase only to the level necessary to reestablish normal oxygen delivery. If the cardiac output response is inadequate to normalize DO2 on a chronic basis, red cell mass can be increased through erythropoietin production. When cardiac output does not respond adequately to normalize DO2, total body oxygen extraction may increase from a normal of 25% up to a maximum of 50% to 60%. Further reductions in DO2 are met with pathologic reductions in oxygen consumption.
Oxygen Consumption and Delivery Relations in Normal Metabolic States
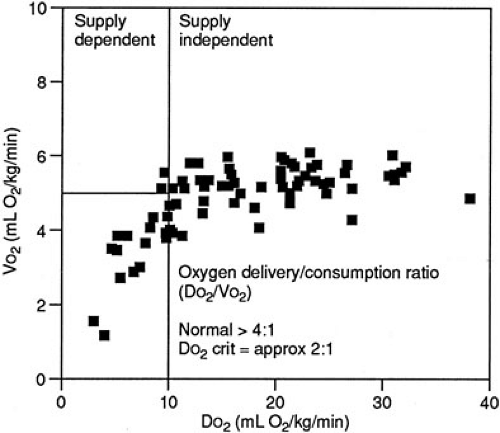
The relation of oxygen consumption and oxygen delivery in normal humans follows a biphasic distribution. Specifically, a given rate of oxygen consumption is constant and independent of oxygen delivery as long as an excess of oxygen is delivered. This area of the VO2 and DO2 relation is characterized by a stable VO2 plateau at which the VO2 is supply independent (Fig. 10-9). As oxygen delivery falls, however, a critical level is attained at which the rate of oxygen consumption becomes dependent on delivery. VO2 then becomes supply dependent. It is below this critical point of oxygen delivery (DO2 crit) that onset of metabolic acidosis with increasing lactate production occurs. This DO2 crit has been estimated in adult patients undergoing cardiac operations to be 8.2 mL per kg per minute or 330 mL per m2 per minute (18). The DO2 crit appears to be the same whether the reduction in DO2 is secondary to a decrease in hemoglobin, SaO2, or cardiac output (19).
Oxygen Consumption and Delivery Relations in Altered Metabolic States
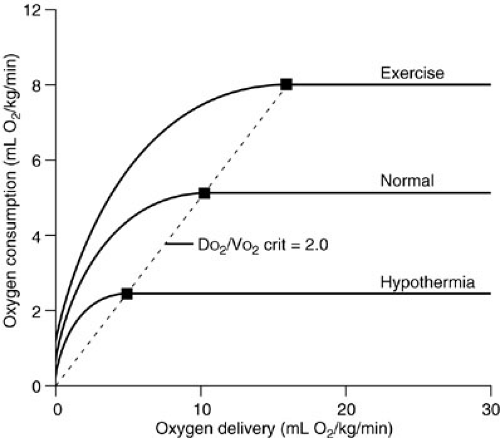
Animal studies have documented that the VO2 plateau is lower in hypometabolic states, such as hypothermia, and is associated with a lower DO2 crit (20). In contrast, hypermetabolic, exercising dogs have a higher plateau VO2 and a higher DO2 crit (Fig. 10-10). The ratio of the DO2 crit to the plateau VO2 is a constant factor that determines the shift from supply-dependent to supply-independent oxygen consumption. Some researchers have suggested that this relation follows a Michaelis-Mentin equation (21). As DO2 decreases and VO2 remains stable, the ratio of oxygen delivery to oxygen consumption falls until the critical DO2/VO2 ratio is reached. At this point, supply-dependent oxygen consumption begins. This DO2/VO2 crit marks the onset of supply-dependent oxygen consumption at all levels of metabolism. Most studies suggest that the DO2/VO2 crit in the laboratory setting is about 2, whereas clinical studies suggest that humans have a critical DO2/VO2 ratio of about 3 (18,20,22,23,24,25).
Controversy exists about whether these DO2/VO2 ratios are similar in patients with the acute respiratory distress syndrome and sepsis (26,27,28). Some studies suggest that
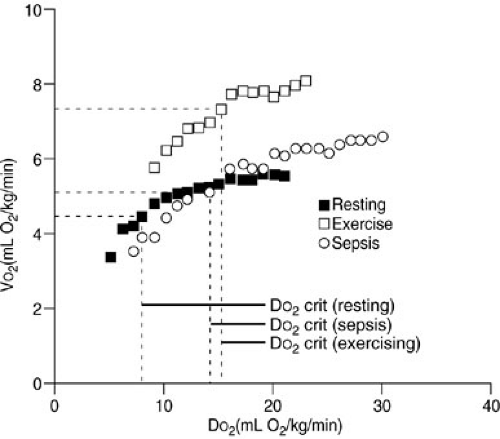
VO2 is uniformly and continuously dependent on DO2, regardless of the delivery rate in such patients. This has been termed pathologic supply dependency. Other studies dispute such findings. Further data are required to resolve this controversy, but it is likely that the critical DO2/VO2 ratio is higher in patients with sepsis or acute respiratory distress syndrome, and this would result in VO2 remaining supply dependent at higher levels of DO2 (Fig. 10-11).
VO2 is uniformly and continuously dependent on DO2, regardless of the delivery rate in such patients. This has been termed pathologic supply dependency. Other studies dispute such findings. Further data are required to resolve this controversy, but it is likely that the critical DO2/VO2 ratio is higher in patients with sepsis or acute respiratory distress syndrome, and this would result in VO2 remaining supply dependent at higher levels of DO2 (Fig. 10-11).
Relation of Mixed Venous Oxygen Saturation to Oxygen Kinetics
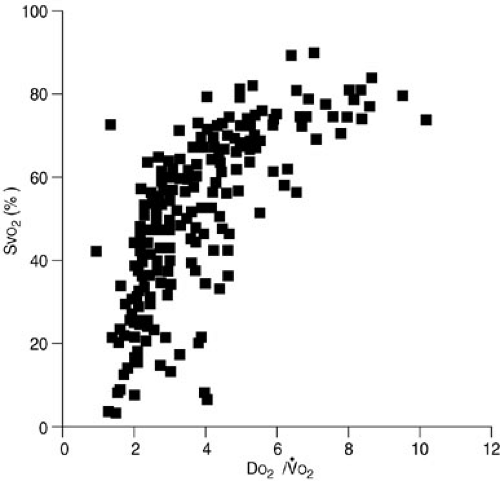
The hemoglobin saturation by oxygen in mixed venous blood obtained from the pulmonary artery is referred to as the SvO2. This directly reflects the DO2/VO2 ratio. As oxygen delivery increases or oxygen consumption decreases, more oxygen remains in the venous blood. The result is an increase in SvO2. In contrast, if delivery decreases or consumption increases, relatively more oxygen is extracted from the blood, and therefore, less oxygen remains in the venous blood. A decrease in SvO2 is the result. The SvO2 serves as an excellent monitor of oxygen kinetics because it specifically assesses the adequacy of oxygen delivery in relation to oxygen consumption (29) (Fig. 10-12). Clinical studies suggest that the critical SvO2 is in the 35% to 50% range, which correlates with a critical DO2/VO2 ratio of about 2 (30,31). Simply put, at this point, one-half of the oxygen available is consumed. Technological advances have allowed development of a fiberoptic, continuous SvO2 monitor that accurately reflects the measured pulmonary artery SvO2. Continuous SvO2 monitoring provides early identification of cardiopulmonary instability, rapid assessment of the response to therapy, and cost savings in critically ill patients because of a diminished need for other data such as sequential blood gas monitoring (29,32). The accuracy of SvO2 monitoring may be diminished under certain circumstances in which arteriovenous shunting occurs, such as in some patients with cirrhosis or sepsis. Importantly, this means that in situations in which vasoregulation is altered the SvO2 may be normal, even though the oxygen delivery at the tissue level is inadequate.
HEMODYNAMIC MONITORING IN THE INTENSIVE CARE UNIT
Noninvasive Monitoring
Noninvasive cardiopulmonary monitoring is an important aspect in the care of all critically ill patients. It is especially important in critically ill newborns and infants because invasive monitoring may be more difficult and is at times less reliable. The physical examination is an integral part of the assessment of cardiopulmonary status. For instance, warmth and color of extremities and capillary refill allow assessment of perfusion. Pink extremities
and central color should make one suspicious of the validity of a low pulse oximeter value. Intravascular volume status can be evaluated by (1) assessment of oral and ocular mucous membranes and axillary moistness, (2) urinary output measurement in the patient without renal insufficiency, (3) warmth of peripheral extremities, and (4) the fullness of the anterior fontanelle in newborns and infants. Information gained from the physical examination should be integrated with data gained by invasive and noninvasive monitoring to assess the cardiopulmonary status. Although monitors are an essential part of modern critical care, they are designed to supplement rather than replace clinical judgment.
and central color should make one suspicious of the validity of a low pulse oximeter value. Intravascular volume status can be evaluated by (1) assessment of oral and ocular mucous membranes and axillary moistness, (2) urinary output measurement in the patient without renal insufficiency, (3) warmth of peripheral extremities, and (4) the fullness of the anterior fontanelle in newborns and infants. Information gained from the physical examination should be integrated with data gained by invasive and noninvasive monitoring to assess the cardiopulmonary status. Although monitors are an essential part of modern critical care, they are designed to supplement rather than replace clinical judgment.
Electrocardiographic Monitoring
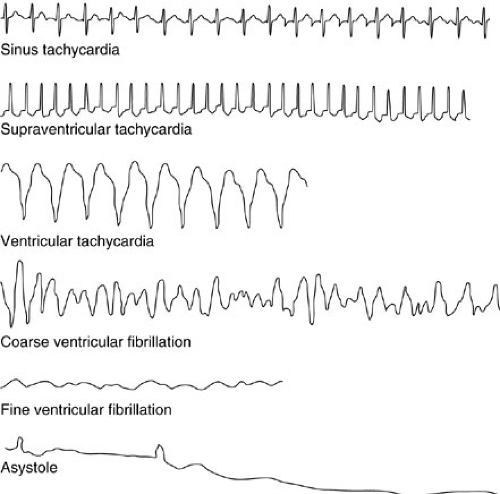
Electrocardiographic (ECG) monitoring is among the most basic of noninvasive monitoring procedures and should be used routinely in all critically ill patients. In addition to accurate heart rate assessment, ECG monitoring provides evidence of dysrhythmias, metabolic abnormalities, and myocardial ischemia (33) (Fig. 10-13). Most intensive care unit ECG systems use adhesive chest leads onto which clip adapters are placed. These leads are typically located on the right upper chest, the left upper chest, and the left lower chest, potentially providing data from leads I, II, and V1, although lead II is most commonly used for monitoring.
ECG monitoring systems are subject to failure. Movement of the patient, incomplete electrode contact, or separation of the electrode from the patient can result in artifacts that simulate arrhythmias, including ventricular tachycardia and asystole. For this reason, the 12-lead ECG is a much more specific and complete means of evaluation and should be used when monitoring raises suspicion for cardiac abnormalities in the critically ill patient. The various ECG intervals and segments can be evaluated, as can trends throughout all leads of the heart.
Most dysrhythmias can be classified into those that are too fast, too slow, or disorganized or absent, and those that are atrial or ventricular. Any arrhythmia that results in cardiovascular instability should be managed with synchronized cardioversion or defibrillation at a dose of 0.5 to 4 J per kg (34).
The heart rate of the newborn normally varies considerably to adapt to the body’s constantly changing metabolic needs and stresses. At 1 week, a term infant’s heart rate can rise as high as 230 beats per minute (bpm) when active and awake and as low as 75 bpm during quiet, deep sleep (35). Brief periods of slow rates, as low as 93 bpm, are normal. Term infants have an average rate of 145 bpm by 3 months and 134 bpm at 6 months.
Temperature Monitoring
Critically ill children are at substantial risk for hypothermia if body temperature is not monitored and appropriate warming techniques used. In neonates, skin temperature probes reflect core body temperature accurately, whereas in infants and children beyond the neonatal period, rectal, bladder, or esophageal probes are effective for continuous temperature monitoring. In neonates and young infants,
these temperature probes may be used to servoregulate overbed warmers to maintain stable body temperature. Additional ways of warming, such as underbody and overbody warming blankets, warming of the ventilating gas, warming of administered fluids and blood products, and warming of ambient temperature, should all be considered in children at risk for hypothermia (36).
these temperature probes may be used to servoregulate overbed warmers to maintain stable body temperature. Additional ways of warming, such as underbody and overbody warming blankets, warming of the ventilating gas, warming of administered fluids and blood products, and warming of ambient temperature, should all be considered in children at risk for hypothermia (36).
Sphygmomanometry
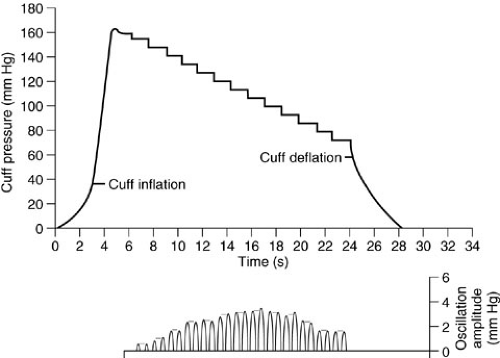
Blood pressure determination using sphygmomanometry should be done in all patients even when more invasive means of blood pressure monitoring are in use. In children, it is critical that the cuff be of appropriate size. The bladder in the cuff should be placed over an appropriate artery. The width of the bladder should be 40% of the extremity circumference at the midpoint of the limb, and the length should be twice the recommended width (37,38). The cuff is inflated to a level well above the expected systolic blood pressure and then deflated rapidly as the approximate systolic blood pressure is identified by either an aneroid or mercury manometer. The cuff should then be reinflated to a point just above this level with subsequent slow deflation as the systolic pressure is identified at the point at which the first of the five phases of Korotkoff sounds are audible (38). The diastolic pressure is noted as the point at which those sounds disappear or are abruptly muffled (phase IV or V). The blood pressure may be difficult to obtain by this technique in the settings of hypotension, elevated peripheral vascular resistance, and poor perfusion. In such situations, a Doppler probe may be used to ascertain systolic blood pressure by identifying return of pulsatile arterial flow distal to a deflating proximal extremity blood pressure cuff. Automatic blood pressure devices are frequently used in a variety of hospital settings (39). These devices can be programmed to measure blood pressure accurately and automatically at various intervals (40,41). The inflated cuff determines blood pressure and simultaneously identifies the presence of minute alterations in cuff pressure that are associated with the appearance and disappearance of the Korotkoff sounds (42). These automated devices determine the systolic pressure on first identification of changes in cuff pressure, mean blood pressure at the point of maximum amplitude of such changes, and diastolic blood pressure on disappearance or the abrupt decrease in the amplitude of the cuff pressure changes (43) (Fig. 10-14).
Pulse Oximetry
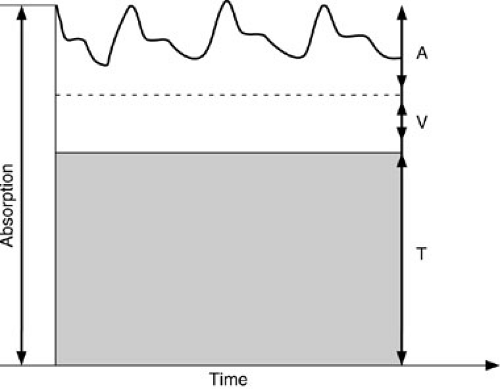
The pulse oximeter is one of the most important advances in noninvasive cardiopulmonary monitoring in critically ill children (Fig. 10-15). Information about oxygenation, heart rate, and perfusion is provided in a noninvasive fashion (44,45,46). The measurements are continuous so clinical changes can be rapidly detected, unlike the information obtained from intermittent arterial blood sampling. Pulse oximeters emit light at two wavelengths, usually 660 nm (red) and 940 nm (near infrared), and this is transmitted through tissue to a photodetector (47). The intensity of the transmitted light remains constant, except for alterations in absorbency due to the pulsatile nature of arterial flow. The pulsatile components are then subtracted from the nonpulsatile component, which allows determination of the pulse rate. In addition, because light is differentially absorbed by reduced hemoglobin and oxyhemoglobin, variable absorbency at the two wavelengths allows estimation of hemoglobin saturation (SpO2). In the setting of poor peripheral perfusion, patient motion, or methemoglobinemia, the default saturation reading of the pulse oximetry device is 85% (47). This is often seen in states of low
cardiac output, hypothermia, and increased vascular resistance. Therefore, if hemoglobin saturation abruptly decreases to 85%, the patient and device should be assessed for pulse oximeter artifact by noting whether a valid heart rate is displayed by the pulse oximeter. Other sources of error in pulse oximeter analysis include the presence of venous blood pulsation (arteriovenous fistula), the presence of nail polish or similar materials on the skin, ambient room light affecting the photodetector, and high levels of carbon monoxide whereby the oximeter cannot differentiate carboxyhemoglobin from oxyhemoglobin and therefore overestimates the true hemoglobin oxygen saturation (48). The accuracy of the pulse oximeter-derived oxygen saturation may be limited at levels less than 70% to 80% (49). Intravascular administration of methylene blue or fluorescein induces a falsely low reading because of absorption of light at the particular wavelengths used.
cardiac output, hypothermia, and increased vascular resistance. Therefore, if hemoglobin saturation abruptly decreases to 85%, the patient and device should be assessed for pulse oximeter artifact by noting whether a valid heart rate is displayed by the pulse oximeter. Other sources of error in pulse oximeter analysis include the presence of venous blood pulsation (arteriovenous fistula), the presence of nail polish or similar materials on the skin, ambient room light affecting the photodetector, and high levels of carbon monoxide whereby the oximeter cannot differentiate carboxyhemoglobin from oxyhemoglobin and therefore overestimates the true hemoglobin oxygen saturation (48). The accuracy of the pulse oximeter-derived oxygen saturation may be limited at levels less than 70% to 80% (49). Intravascular administration of methylene blue or fluorescein induces a falsely low reading because of absorption of light at the particular wavelengths used.
The absorbency levels of fetal hemoglobin are similar to those of hemoglobin A at the two wavelengths used in the pulse oximeter. Therefore, the presence of hemoglobin F does not have a significant effect on the hemoglobin saturation measurements (47,50). The pulse oximeter probe is usually placed on the fingers or toes. If the probes fail to function appropriately at those sites, more central locations, such as the ears, lips, and nose, can be used. Pulse oximeters can also be placed on extremities with questionable arterial perfusion to provide continuous localized monitoring when necessary.
Carbon Dioxide Monitoring
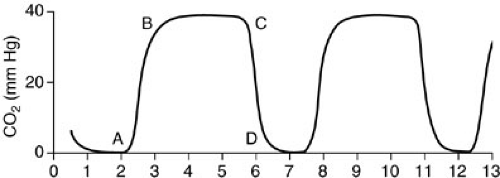
End-tidal carbon dioxide (ETCO2) monitors assess the absorption of infrared light as it passes through expired gas (Fig. 10-16). Two techniques are used: sidestream monitoring, in which a sample of expired gas is continuously aspirated and assessed; or mainstream monitoring, which evaluates gas as it is exhaled (51). A disadvantage of the sidestream technique is that tidal volume and minute ventilation measurements may be inaccurate. A disadvantage of the mainstream method is that it requires additional dead space in the ventilating circuit. The techniques are equivalent with regard to accuracy.
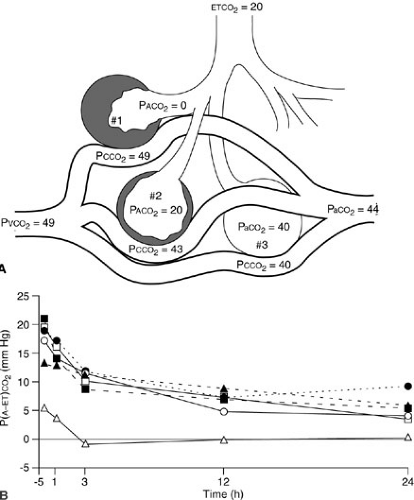
Airway PCO2 monitoring is helpful to document effective ventilation of the airway after endotracheal tube placement and to evaluate trends in PaCO2 during ventilator manipulation (52). Colorimetric carbon dioxide detectors containing a pH-sensitive indicator may be placed in line during endotracheal intubation to establish that the airway has been accessed in nonarrested patients (53). In healthy patients without respiratory insufficiency, the maximal airway CO2 value assessed over a few minutes provides a relatively good approximation of the true PaCO2. Unfortunately, ventilation–perfusion mismatch in the setting of respiratory insufficiency often results in a decrease in ETCO2 relative to PaCO2 (54,55). In these patients, the difference between the etCO2 and PaCO2 may be variable and significant, and therefore, it is useful only for trend analysis. The arterial PCO2–ETCO2 gradient and the arterial PCO2/ETCO2 ratio, however, reflect the degree of ventilation–perfusion mismatch and are useful in monitoring therapy (56) (Fig. 10-17).
Measurement of Cardiac Output
Noninvasive estimations of cardiac output include thoracic electrical bioimpedance measurement, suprasternal Doppler ultrasound assessment, and transesophageal or transtracheal Doppler ultrasound evaluation. Transthoracic electrical bioimpedance requires placement of electrodes on the neck and lower chest (57,58) (Fig. 10-18). Low-amplitude current is passed between pairs of
electrodes. The measured change in thoracic resistance is a function of the pulsatile change in the fluid volume of the thoracic cavity with each cardiac cycle. An equation based on the patient’s height, weight, sex, and deviation from ideal body weight can be used to convert measured changes in impedance to cardiac output. Although problems of reliability tempered interest in the past, technical advances have substantially improved reproducibility and accuracy of cardiac output estimation (59,60,61). The validity of this technique in children has been demonstrated, and it may offer one practical means of measuring cardiac output in neonates (62).
electrodes. The measured change in thoracic resistance is a function of the pulsatile change in the fluid volume of the thoracic cavity with each cardiac cycle. An equation based on the patient’s height, weight, sex, and deviation from ideal body weight can be used to convert measured changes in impedance to cardiac output. Although problems of reliability tempered interest in the past, technical advances have substantially improved reproducibility and accuracy of cardiac output estimation (59,60,61). The validity of this technique in children has been demonstrated, and it may offer one practical means of measuring cardiac output in neonates (62).
Continuous Doppler ultrasound can be used to assess the velocity of blood flow within the aorta through probes placed at the suprasternal notch, esophagus, or trachea (63,64,65,66) (Fig. 10-19). The cross-sectional area of the aorta is determined either by ultrasound measurement or through a nomogram based on age, gender, height, and weight (67). Once velocity of blood flow and aortic cross-sectional area are known, cardiac output can be calculated. Although studies regarding accuracy and reliability of Doppler-determined cardiac output vary, validity is improved when transesophageal or transtracheal ultrasound is used and may only require measurement of aortic blood flow velocity (67,68). The Doppler technique cannot be used in patients with anatomic abnormalities that disturb aortic blood flow, such as aortic stenosis or insufficiency (69). Also, this technique is highly dependent on the ultrasound operator. Experience using cardiac output measurements with this technique is limited, but encouraging, in children and neonates (70,71,72,73).
Invasive Monitoring
Systemic Arterial Catheters
Indications for arterial access include the need for continuous monitoring of blood pressure or the need for frequent arterial blood gas samples. Blood pressure monitoring is frequently required in patients with hemodynamic instability, sepsis, vasoactive drug therapy, mechanical ventilation, and other critical care needs. Although noninvasive monitoring has partially replaced the need for frequent blood gas assessment, the requirement for more than two or three blood gas samples per day is an indication for intraarterial access.
The most common arterial access site used in nonneonates is the radial artery (70%), followed by the posterior tibial and femoral arteries (74). Peripheral arteries are best used because of the low complication rate should thrombosis occur (75). The femoral artery, however, is frequently cannulated in children with few
complications (76). The superficial temporal artery is easily identified and cannulated in neonates, but concern regarding retrograde flow of air or debris into the carotid artery circulation makes this site less then optimum. If used, extreme care must be taken during flushing of the catheter.
complications (76). The superficial temporal artery is easily identified and cannulated in neonates, but concern regarding retrograde flow of air or debris into the carotid artery circulation makes this site less then optimum. If used, extreme care must be taken during flushing of the catheter.
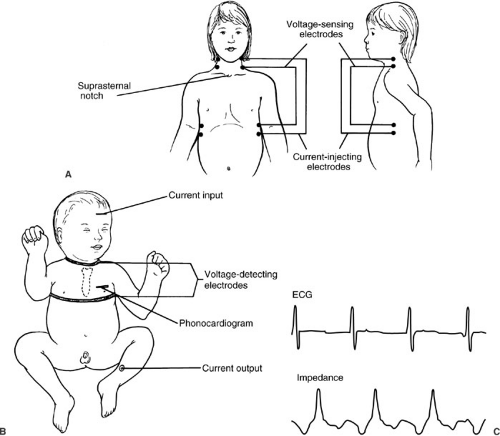 FIGURE 10-18. Chest lead placement for thoracic impedance cardiac output assessment in older children (A) and neonates (B). (C) The relation of impedance (hence, cardiac output) to the cardiac cycle. |
Cannulation in children can be performed using either percutaneous or open methods. Percutaneous insertion is attempted in most circumstances (77) (Fig. 10-20). Typical catheters for arterial cannulation in neonates and small children are 24- or 22-gauge polyethylene cannulas. Two methods of cannulation are commonly used: the direct cannulation method and the transfixion technique (78). For radial artery cannulation, the authors prefer the transfixion technique, in which the catheter and needle are advanced through the artery to the head of the radius as the pulse is palpated. A flash of blood from the needle is observed on withdrawal of the catheter, at which point the needle and catheter are advanced once again. The needle is then removed, the catheter is withdrawn until blood return is visualized, and the catheter is advanced down the lumen of the artery. The catheter is sutured in place and secured. A flexible guide wire can be used to guide the catheter into the artery when difficulties are encountered. An arterial cutdown to the radial or dorsalis pedis arteries may be necessary in neonates and infants (Fig. 10-21). It is rare that artery ligation is required.
The umbilical artery provides an excellent site for arterial access in neonates who are younger than 10 days of age. Umbilical artery catheters are placed in up to 30% of neonates admitted to the neonatal intensive care unit (79). An incision on the inferior aspect of the umbilicus about 1 to 2 cm above skin level should allow identification of one of the two ventrally located umbilical arteries (Fig. 10-22). If the artery cannot be located or cannulated in the umbilical stump, another option is to perform an infraumbilical curvilinear incision with identification of the umbilical artery posterior to the linea alba and anterior to
the peritoneum. The catheter is advanced gently because resistance is often met at a point about 5 to 6 cm from the umbilicus as the catheter passes from the umbilical artery into the iliac artery. Final catheter position should be either above the mesenteric vessels (T-6 to T-11) or below the renal vessels (L-4) (80). The data from Fig. 10-23 may be used to estimate the insertion length of the umbilical artery catheter (81). Otherwise, one can advance the catheter either a length equivalent to the distance between the umbilicus and the shoulder plus the weight of the patient in kilograms plus the length of the umbilical stump, which will place the catheter in the T-6 to T-11 region, or twice the distance between the symphysis pubis and the umbilicus plus the length of the umbilical stump, which will place the tip in the L-4 vertebral region.
the peritoneum. The catheter is advanced gently because resistance is often met at a point about 5 to 6 cm from the umbilicus as the catheter passes from the umbilical artery into the iliac artery. Final catheter position should be either above the mesenteric vessels (T-6 to T-11) or below the renal vessels (L-4) (80). The data from Fig. 10-23 may be used to estimate the insertion length of the umbilical artery catheter (81). Otherwise, one can advance the catheter either a length equivalent to the distance between the umbilicus and the shoulder plus the weight of the patient in kilograms plus the length of the umbilical stump, which will place the catheter in the T-6 to T-11 region, or twice the distance between the symphysis pubis and the umbilicus plus the length of the umbilical stump, which will place the tip in the L-4 vertebral region.
Stay updated, free articles. Join our Telegram channel

Full access? Get Clinical Tree


