Cardiology Laboratory
Timothy M. Hoffman
BLOOD PRESSURE MEASUREMENT
Accurate measurement of the blood pressure depends on selection of an appropriate cuff size of a sphygmomanometer. By convention, an appropriate cuff size is a cuff with an inflatable bladder width that is at least 40% of the arm circumference at a point midway between the olecranon and the acromion. For a cuff to be optimal for an arm, the cuff bladder length should cover 80% to 100% of the circumference of the arm. Such a requirement demands that the bladder widthtolength ratio be at least 1:2. If the cuff size is too small, the blood pressure will be overestimated, and if it is too large, the blood pressure will be underestimated.
Auscultation of the diastolic component of the blood pressure exhibits two end points, Korotkoff phases IV and V, respectively. In children, Korotkoff phase IV (i.e., the point of diminution or muffling of the Korotkoff sound) is generally considered a more accurate representation of the diastolic pressure. Korotkoff phase V (i.e., the disappearance of the Korotkoff sounds) should be considered the diastolic end point if it falls within 6 mm Hg of Korotkoff phase IV.
Pulsus Paradoxus
Pulsus paradoxus, a decrease of > 10 mm Hg in the systolic blood pressure during inspiration, may be associated with cardiac tamponade (e.g., as a result
of pericardial effusion), constrictive pericarditis, or severe respiratory compromise (e.g., reactive airway disease exacerbation).
of pericardial effusion), constrictive pericarditis, or severe respiratory compromise (e.g., reactive airway disease exacerbation).
 HINT: Pulsus paradoxus must not be confused with pulsus alternans (i.e., a decrease in the systolic pressure on alternate contractions that indicates left ventricular failure).
Using a sphygmomanometer, the cuff is inflated until the pressure is 20 mm Hg above the systolic pressure. The bladder is then slowly deflated until the Korotkoff phase I sound is heard independent of the respiratory cycle—this is the first data point. The slow deflation of the bladder is continued until the Korotkoff phase I sound is noted throughout the respiratory cycle (during inspiration and expiration)—the second data point. The difference in systolic blood pressure between the points is considered the reduction in systolic pressure during inspiration and is abnormal (pulsus paradoxus) if it is >10 mm Hg. Figure 84-1 depicts pulsus paradoxus schematically.
HYPEROXIA TEST
The hyperoxia test can be useful for differentiating cardiac and pulmonary causes of cyanosis, and it is one of the first evaluations performed when confronted with a cyanotic newborn. Cyanosis usually becomes apparent at a mean capillary concentration of at least 3.0 g/dL of deoxygenated hemoglobin, a concentration that corresponds to an oxygen saturation of 70% to 80% in the child with a normal hemoglobin level.
In infants with cyanotic congenital heart disease (CHD) (transposition of the great arteries [TGA] or a lesion with restrictive pulmonary blood flow [tricuspid
atresia with pulmonary stenosis or atresia, pulmonary atresia or critical pulmonary stenosis with intact ventricular septum, or tetralogy of Fallot]) and hypoxemia, the arterial oxygen tension (PaO2) is generally <50 mm Hg on 100% oxygen. In an infant with cyanotic CHD and a complete mixing lesion without restrictive pulmonary blood flow (truncus arteriosus, total anomalous pulmonary venous return, TGA with ventricular septal defect, single ventricle, hypoplastic left heart syndrome, and tricuspid atresia without pulmonary stenosis or atresia), the PaO2 is generally <150 mm Hg in response to the administration of 100% oxygen. In an infant with a pulmonary cause for the cyanosis, administration of 100% oxygen increases the PaO2 to a level significantly >150 mm Hg. In patients with CHD, this phenomenon is attributable to right-to-left shunting (i.e., the mixing of deoxygenated blood and oxygenated blood within the circulatory system). Right-to-left shunting may be either intracardiac or extracardiac (intrapulmonary shunting from ventilation-perfusion mismatch) (see section on “Agitated Saline Contrast Echocardiography”).
atresia with pulmonary stenosis or atresia, pulmonary atresia or critical pulmonary stenosis with intact ventricular septum, or tetralogy of Fallot]) and hypoxemia, the arterial oxygen tension (PaO2) is generally <50 mm Hg on 100% oxygen. In an infant with cyanotic CHD and a complete mixing lesion without restrictive pulmonary blood flow (truncus arteriosus, total anomalous pulmonary venous return, TGA with ventricular septal defect, single ventricle, hypoplastic left heart syndrome, and tricuspid atresia without pulmonary stenosis or atresia), the PaO2 is generally <150 mm Hg in response to the administration of 100% oxygen. In an infant with a pulmonary cause for the cyanosis, administration of 100% oxygen increases the PaO2 to a level significantly >150 mm Hg. In patients with CHD, this phenomenon is attributable to right-to-left shunting (i.e., the mixing of deoxygenated blood and oxygenated blood within the circulatory system). Right-to-left shunting may be either intracardiac or extracardiac (intrapulmonary shunting from ventilation-perfusion mismatch) (see section on “Agitated Saline Contrast Echocardiography”).
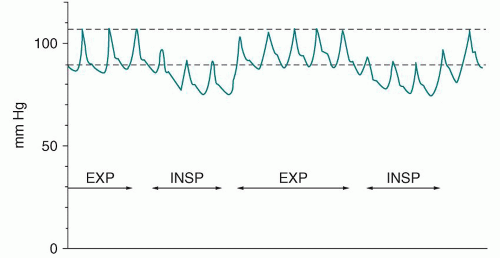 FIGURE 84-1 Pulsus paradoxus. EXP, expiration; INSP, inspiration. Modified with permission from Park MK. Pediatric Cardiology for Practitioners. 3rd ed. St. Louis: Mosby-Year Book; 1996:15. |
BIOMARKERS
Brain natriuretic peptide (BNP) and N-terminal pro-brain natriuretic peptide (NT-proBNP) assays are used in algorithms for the diagnosis and management of acute and chronic heart failure in adults. BNP is biologically active with a half-life of 20 minutes, yet NT-proBNP is inactive with a half-life of 60 to 120 minutes. These assays should always be interpreted with caution as the results are method-dependent and comparisons amongst different laboratories may not be possible. In the pediatric age group and in patients with varying forms of CHD, there are no absolute standards to date concerning levels of BNP or NT-proBNP. Heterogeneous etiologies for heart failure in children as compared to adults have lead to studies that attempt to define the clinical relevance of BNP and NT-proBNP levels. In pediatrics, cardiac disease enhances natriuretic peptide expression due to hemodynamic stress and neurohormonal activation. Reference ranges are difficult to establish and are based on age, gender, and underlying pathophysiology (especially those with univentricular physiology). In light of this background, studies have suggested that BNP and NT-proBNP may be increased in concert with clinical severity amongst the following conditions: (1) hemodynamic load on either the right or the left ventricle in those with dilated cardiomyopathy, (2) excessive shunt with a patent ductus arteriosus (PDA), (3) right ventricular volume overload (e.g., s/p tetralogy of Fallot repair with resultant pulmonary regurgitation), (4) right ventricular pressure overload, and (5) with cardiac involvement in Kawasaki disease. Some studies suggest an adjunct utility of these assays in those rejecting post heart transplant, although absolute values have not been established. Similar to adult uses, longitudinal assessment may be helpful in an individual patient to monitor disease process or response to heart failure treatment. Finally, elevation of these markers may be noted in those postchemotherapy which portends the likely development of cardiac dysfunction.
 HINT: Use of BNP and NT-proBNP in pediatrics must be done with the knowledge that absolute value cutoffs have yet to be established across all pathophysiologies. However, longitudinal assessment (i.e., using the patient as their own control) of the values may be helpful in determining response to treatment or severity of disease.
Troponin is a vital protein involved in the cascade leading to actin and myosin contraction. Cardiac contraction is regulated by calcium via a tropomyosin-like protein factor, which was discovered to be a complex of tropomyosin and troponin. Troponin is the calcium receptive protein and is integral in the contraction and relaxation of cardiac muscle. Troponin I and Troponin T are noted only in cardiac muscle. Troponin levels in pediatrics have been used to predict the degree of myocardial damage, either postoperatively or after use of cardiotoxic medications (including chemotherapy), and longitudinal evaluation has been helpful in predicting recovery or mortality. In neonates, troponin levels may be useful to assess the degree of cardiac damage associated with asphyxia. Troponin levels may be helpful in other disease states such as active myocarditis and determining cardiac damage to ischemia in those rare coronary anomalies noted in pediatrics.
ELECTROCARDIOGRAPHY
The electrocardiogram provides data concerning the following:
Rate
Rhythm
Axes
Intervals
Hypertrophy
Wave changes (Q waves and ST/T waves)
Rate
The heart rate is determined accurately by dividing 60 by the RR interval (measured in seconds). For example, if the RR interval is 0.4 second (10 small boxes), the heart rate is 60 divided by 0.4, or 150 beats/minute.
Rhythm
Rhythm diagnosis is beyond the scope of this chapter (see discussion in Chapter 74, “Syncope” and Chapter 75, “Tachycardia).”
Axes
The frontal axis should be determined for the P, QRS, and T waves from the limb leads (I, II, III, aVR, aVL, aVF). The hexaxial reference system (Figure 84-2) is usually used. The normal axes generally fall between 0° and 90°. The specific axis is equal to the direction of the largest positive force on depolarization.
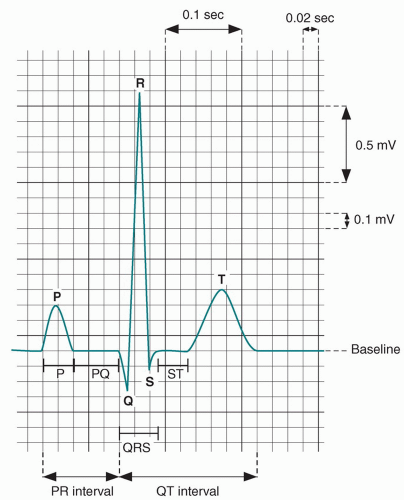 FIGURE 84-2 Hexaxial reference system (frontal axis). The shaded area represents the normal axis. |
A cursory way to determine the frontal axis is to note the complex that is isoelectric and locate the two planes perpendicular to it. The perpendicular plane with the greatest positive deflection is indicative of the axis.
P-Wave Axis
The location of the P-wave axis determines the origin of an atrial-derived rhythm:
0° to 90° = high right atrial rhythm (normal sinus rhythm)
90° to 180° = high left atrial rhythm (ectopic atrial rhythm)
180° to 270° = low left atrial rhythm (ectopic atrial rhythm)
270° to 0° = low right atrial rhythm (ectopic atrial rhythm)
 HINT: Classic “mirror image” dextrocardia is associated with a P-wave axis of 90° to 180° in conjunction with high amplitude forces in the right chest leads and low voltage in the left chest leads (i.e., lead V4R has a greater amplitude than lead V4).
QRS Axis
The QRS axis value is age specific (Table 84-1) but may correlate with CHD in certain clinical settings. For example, a northwest axis or left axis deviation (-30° to -120°) may correlate with an endocardial cushion defect or tricuspid atresia. Left axis deviation is always abnormal in a newborn.
T-Wave Axis
The T-wave axis helps determine strain associated with ventricular hypertrophy. A T-wave axis that is 90° different from the QRS axis suggests a strain pattern.
Intervals
Standard calculated intervals include the PR, QRS, and corrected QT intervals (Figure 84-3). The normal heart rate, PR interval, and QRS duration vary with age (Table 84-2).
PR Interval
First-degree atrioventricular block is characterized by a PR interval that is greater than the standard range for age. A short PR interval associated with a delta wave is indicative of Wolff-Parkinson-White syndrome.
TABLE 84-1 Age-Specific QRS Axis Values
Stay updated, free articles. Join our Telegram channel
Full access? Get Clinical Tree
 Get Clinical Tree app for offline access

|
|---|