His–Purkinje system
In an ECG, the P wave represents atrial depolarisation, while atrial repolarisation occurs during ventricular depolarisation and hence is not visualised. The QRS wave represents ventricular depolarisation, while the T wave represents ventricular repolarisation.
The ECG is recorded onto standard paper travelling at a rate of 25 mm/second. The paper is divided into large squares, each measuring 5 mm in width and representing 0.2 seconds. Each large square is divided into 25 small squares; a small square is 1 mm wide and represents 0.04 seconds.
Electrode Placement and Skin Preparation
ECG lead electrodes are placed either in a bipolar or in a unipolar arrangement. In the bipolar lead arrangement, the electrical activity at a single positive electrode is compared with that at a single negative electrode. In the unipolar lead arrangement, the electrical potential at a single positive electrode, the so-called exploring electrode, is compared with the average electrical activity at several other electrodes, which serve as the negative pole.
The limb leads (I, II, III) are bipolar leads, while the augmented voltage leads (aVR, aVL, aVF) are unipolar leads. These six leads explore the electrical activity of the heart in the frontal plane (the orientation of the heart seen when looking directly at the anterior chest; see Figure 10.2).
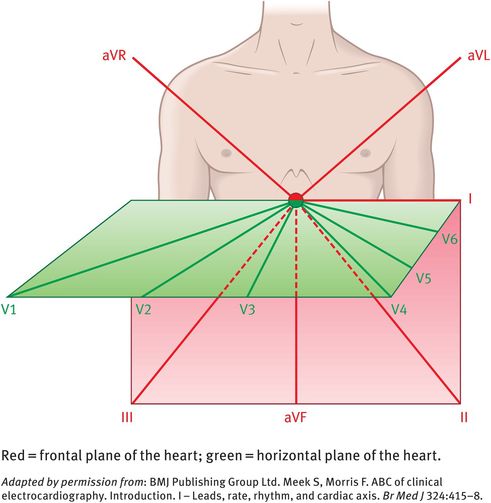
Vertical and horizontal perspectives of the electrode leads
The chest leads (V1, V2, V3, V4, V5, V6) explore the electrical activity of the heart in the horizontal plane (Figure 10.2). The reference point for the chest leads is obtained by connecting the left-arm, right-arm and left-leg electrodes together. The position of the six chest electrodes for standard 12-lead electrocardiography is depicted in Figure 10.3.
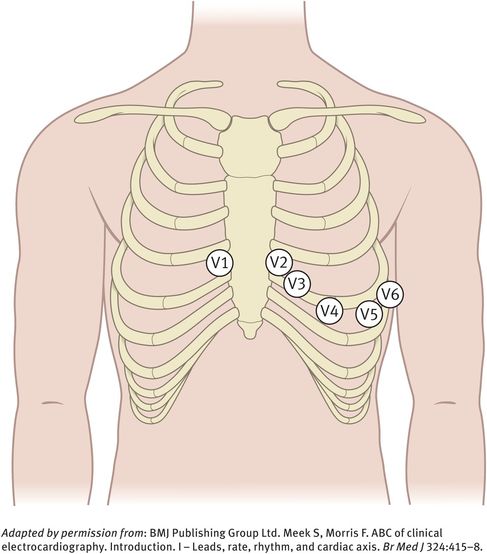
Position of the six chest electrodes for standard 12-lead electrocardiography
In a standard 12-lead ECG:
leads II, III and aVF ‘view’ the inferior surface of the heart
leads V1 to V4 view the anterior surface of the heart
leads I, aVL, V5 and V6 view the lateral surface of the heart
leads V1 and aVR view the right atrium and the cavity of the left ventricle.
The shape of the QRS complex in any lead depends on the orientation of that lead to the vector of depolarisation.
To obtain good electrical contact, the skin is cleaned and gel is applied before placing the electrodes. After removal of the electrodes at the end of the procedure, the skin should be thoroughly cleaned again to avoid skin irritation from the salty gel. No special precautions are required and no complications from this procedure have been observed.
Features of a Normal Electrocardiogram
Normal sinus rhythm on an ECG has the following cardinal features:
The heart rate is 60–99 beats/minute.
The cardiac rhythm is regular except for minor variations with respiration.
The P wave is upright in leads I and II.
The normal duration of the PR interval is 0.12–20 seconds. This is the time required for the completion of atrial depolarisation, conduction through the atrioventricular node and His–Purkinje system and arrival at the ventricular myocardial cells.
Each P wave is usually followed by a QRS complex.
The normal duration of the QRS interval is 0.06–0.10 seconds. This represents the time required for ventricular cells to depolarise.
Normal values for the QT interval are between 0.30 and 0.43 seconds (0.30–0.45 seconds for women). This is the time required for depolarisation and repolarisation of the ventricles.
Young healthy individuals, especially athletes, may also display various other rhythms, especially during sleep. For example, respiration may cause sinus arrhythmia, characterised by beat-to-beat variation in the RR interval, with the heart rate increasing during inspiration. This is a vagally mediated effect in response to the increased volume of blood that returns to the heart during inspiration. Other normal findings noted in healthy individuals include tall R waves, prominent U waves (reflecting repolarisation of the papillary muscles or His–Purkinje fibres), ST segment elevation, exaggerated sinus arrhythmia, sinus bradycardia and first-degree heart block.
Principles and use of ultrasound
Diagnostic ultrasound uses the transmission of mechanical vibrations through matter to obtain some information about that matter. Ultrasound allows us to:
determine the nature of a tissue (for example cystic or solid)
assess the movement of tissues (such as fetal heart, bowel)
measure blood flow (for example in the ovarian/follicular circulation, fetal circulation)
measure structures (such as follicular diameter, femur length).
Ultrasound has an advantage over other imaging modalities because it is noninvasive and does not use ionising radiation. For these reasons, ultrasound can be used as a screening test and repeated examinations can be made with relative safety. Therefore, ultrasound is ideally suited for use in obstetrics and gynaecology.
The Sound Wave and Its Generation
Sound is a pulsating pressure wave (that is, a mechanical disturbance of a medium) that passes through the medium at a fixed speed. Any sound wave can be defined by two main parameters, namely its amplitude, which is related to its acoustic power, and its frequency. Sound waves with frequencies above 20 kHz are termed ultrasound, with medical ultrasound operating in the low MHz range. Figure 10.4 shows the range of ultrasound frequencies used in the medical environment.
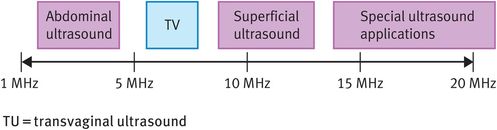
Typical range of ultrasound frequencies used in clinical practice
To produce ultrasound, there is the need to generate a pressure wave. This is achieved by incorporating a piezoelectric crystal within a transducer that is placed in contact with the tissue under investigation. The piezoelectric crystal converts electrical energy into mechanical energy and vice versa. When excited by a high-voltage current, the crystal oscillates at a given frequency, which is determined by the thickness of the crystal.
Two types of ultrasound can be produced, namely continuous-wave ultrasound and pulsed-wave ultrasound. For imaging purposes, pulsed-wave ultrasound is used. It consists of bursts or ‘packets’ of ultrasound that are sent out at a given frequency. The rate at which these bursts of ultrasound are sent out is known as the pulse repetition frequency. Figure 10.5 shows the temporal profile of pulsed-wave ultrasound. The advantage of this type of ultrasound is that it is possible to obtain spatial information and therefore imaging is possible.
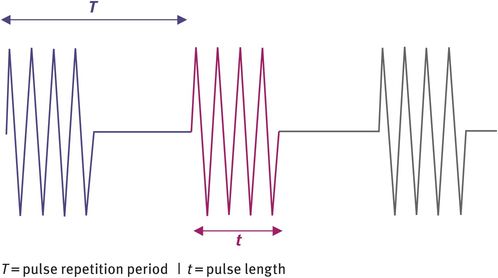
Temporal profile of pulsed-wave ultrasound
Interactions of Ultrasound with Tissue
To build up an ultrasound image, the ultrasound pressure wave needs to interact with the tissue under investigation. The pressure wave then needs to return to the piezoelectric crystal to be converted from mechanical into electrical energy. There are three principal interactions with tissue:
reflection
scatter
absorption.
Reflection occurs at interfaces between tissues with different characteristics. The tissue property that determines the degree of reflection is called the acoustic impedance (Z), which is related to the density (ρ) of the tissue and the velocity (c) of ultrasound in that particular tissue:
The greater the difference in acoustic impedance between two tissues, the greater the degree of reflection.
Scatter occurs when ultrasound interacts with a structure whose dimensions are similar to, or smaller than, the wavelength of the ultrasound wave. This is known as Rayleigh scattering and the resulting wave is scattered in all directions (360 degrees scattering). This type of interaction typically occurs when ultrasound interacts with very small structures such as blood cells or parenchyma. The intensity of the scattered wave depends primarily on the dimensions of the target tissue and the wavelength of the ultrasound wave. Generally, the intensity of the scatter increases very rapidly with the frequency of the ultrasound pressure wave, which puts an upper limit on the frequency of ultrasound that can be used in clinical practice.
Absorption is the conversion of mechanical (ultrasound) energy into heat or internal molecular energy. This can obviously have detrimental results in that the heating effect can produce unwanted bioeffects. In addition, energy is lost from the ultrasound beam, reducing the penetration of the beam. Absorption increases with frequency, which effectively puts an upper limit of 20 MHz on the frequency of ultrasound that can be used.
The echoes generated from the reflection at tissue boundaries and the scattering within tissues and organs give rise to the complex echo trains from which the diagnostic information is derived.
Real-Time B-Mode (Brightness Mode) Ultrasound Scanning
Ultrasound scanning is a highly operator-dependent technique. To produce a B-mode ultrasound image, the ultrasound beam needs to be swept across the field of view (Figure 10.6A). Typically, 200 effective ultrasound beams will be used to produce an image (Figure 10.6B).
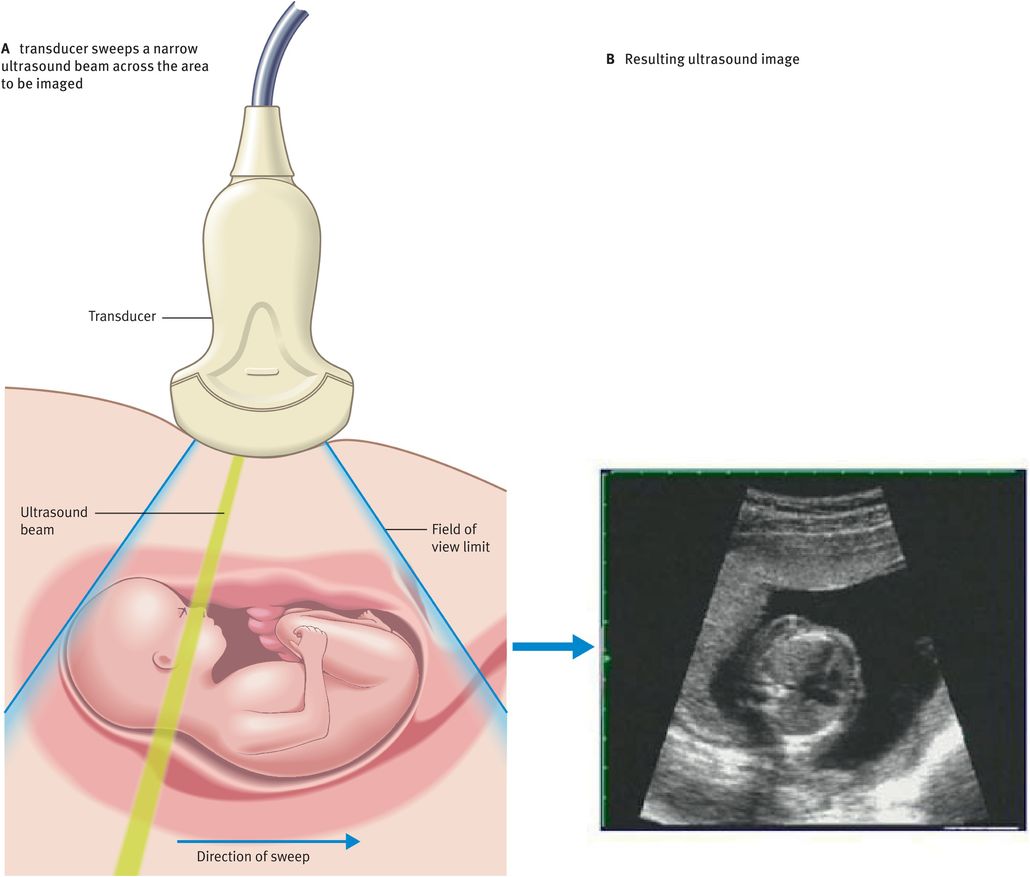
Figure 10.7 illustrates the main components of a typical B-mode ultrasound scanner. We will now discuss the role of these components in image formation.
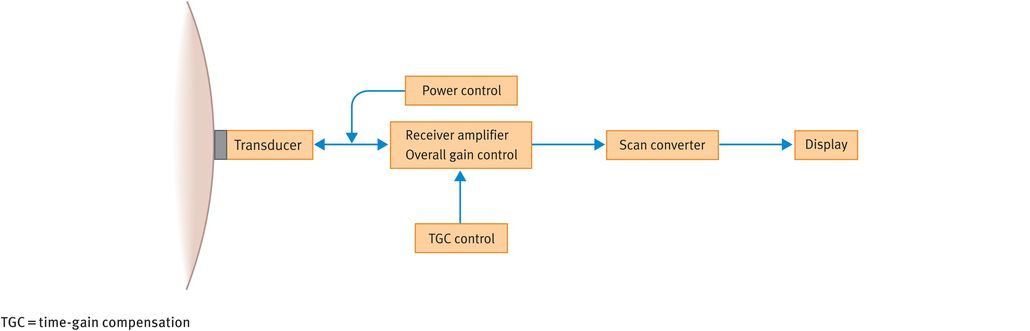
Main operator-dependent components of a typical B-mode ultrasound scanner
The transducer houses the piezoelectric crystal and generates the ultrasound beam. Modern transducers tend to be broadband transducers with selectable frequencies. Transducers come in different shapes and sizes, depending on the frequencies used and the specific applications.
The power control allows adjustment of the amount of electric voltage that is applied to generate the ultrasound pulses.
The echoes received from the tissues are converted into electrical signals by the transducer. However, the received signal is much weaker than the transmitted signal and therefore a receiver amplifier boosts the returning signals to useful levels. As an analogy, the gain control acts like the volume control on a radio.
Owing to the attenuation of ultrasound pulses with depth, echoes from similar reflectors reduce in amplitude as the tissue depth increases. To ensure that echoes from similar reflectors at different depths are displayed at the same amplitude, it is necessary to compensate for attenuation. This is achieved using a technique called time-gain compensation, which essentially employs a series of amplifiers that can be adjusted to increase the image amplification at specific depths.
The scan converter controls the way in which the image is presented. It basically consists of computer memory elements that store grey-scale information and produces a digital image that is comprised of tiny picture elements (pixels). Each pixel has a unique address where the value of the echo amplitude is stored. This allows the appropriate shade of grey for each pixel to be displayed on the screen. In the scan converter, various parameters such as preprocessing and postprocessing curves can be altered, which can improve image quality.
Flat screens or conventional monitors are used to display the images.
Limitations of real-time B-mode scanning
B-mode ultrasound scanning has several practical limitations including:
inadequate spatial resolution
inadequate penetration
poor image quality (grey scale)
low frame rate
compromised field of view
low line density.
Spatial resolution is the minimum distance between two reflectors or scattering surfaces that is necessary to be able to distinguish two separate echo signals. There are two main components to spatial resolution. Firstly, axial resolution, which is the minimum distance between two points that are located along the beam axis. The axial resolution is determined by the pulse length, which is shorter at higher frequencies. In fact, the axial resolution is equal to half the pulse length and this is why higher frequencies are used to give better axial resolution. The second component of spatial resolution is lateral resolution, which is the minimum distance between two points that are located at the same range or depth within the tissue (objects side by side in the image). The lateral resolution is determined by the beam width and is highly dependent on beam focusing. The spatial resolution also depends on the slice thickness, which is determined by the thickness of the transducer and is therefore inherent in the transducer’s design.
Penetration is reduced by the attenuation of ultrasound. The main factors influencing penetration are absorption and scatter. As alluded to earlier, both absorption and scatter increase with increasing frequencies. Hence, lower frequencies have to be used to achieve greater penetration. As a result, better penetration comes at the price of poorer resolution.
Image quality depends on several factors: the contrast resolution, which is influenced by the preprocessing and postprocessing carried out in the scan converter; the dynamic range (the range of echo strengths that can be handled by the amplifiers), which dictates how the echo train is converted to a grey scale; and the temporal resolution, which depends on the number of frames displayed per second (frame rate). All of these factors need to be optimised to obtain the best possible image quality.
Frame rate, line density (the number of scan lines in the image) and field of view (the size of the image displayed) are all interrelated. Ideally, one would like to have a fast frame rate, a high line density and a large field of view to obtain the best possible image. Unfortunately, the interrelation of these factors means that something has to be compromised and, depending on the scan being performed, one has to decide which of the factors are the most important to optimise.
Doppler Ultrasound
The wavelength recorded by an observer depends on the movement of the source and the observer relative to one another. This phenomenon can be used in medical ultrasound to give two pieces of useful information:
the speed at which the target is moving
the direction of the motion.
The difference in frequency between the returning echo and the transmitted ultrasound wave is known as the Doppler frequency shift; in medical ultrasound, it is particularly used to assess blood flow.
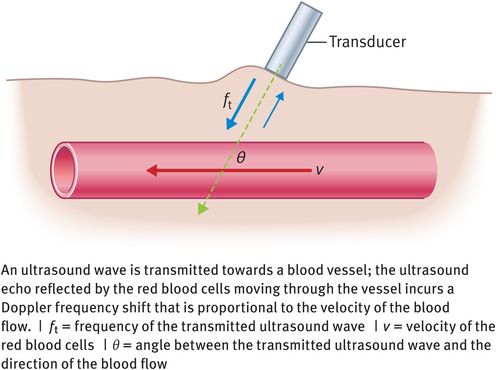
Doppler equation
If the red blood cells are moving through a blood vessel at velocity v and the angle of insonation between the red blood cells and the ultrasound beam is θ degrees (Figure 10.8), then the Doppler frequency shift (fd) is given by the following equation:
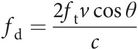
where c is the velocity of ultrasound in soft tissue and ft is the frequency of the ultrasound wave transmitted by the ultrasound transducer.
Doppler frequency shift
Doppler instrumentation
The simplest way to detect blood flow is by use of continuous-wave ultrasound. Instruments of this kind will give us no imaging capability and the devices therefore tend to be fairly basic, designed to assess the pulse or the fetal heart beat.
To get more information about the nature of blood flow, the Doppler information needs to be coupled with an imaging device. To this end, the main instrument now available is a colour flow scanner, which combines a B-mode real-time grey-scale imaging system with pulsed-wave Doppler and colour flow imaging. Colour flow images display direction and velocity information pictorially (Figure 10.9). Information on the direction of blood flow is colour-coded; generally, flow towards the transducer is red and flow away from the transducer is blue. Information on the velocity of red blood cells is also colour-coded, with dark hues representing low velocities and bright hues representing high velocities.
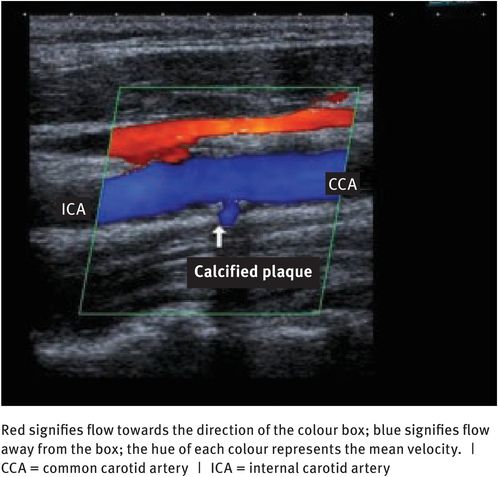
Colour flow Doppler scan of a carotid artery
Safety of Diagnostic Ultrasound
Diagnostic ultrasound has been used for many years with no proven adverse effects, so why should we worry? Modern ultrasound equipment uses a broader range of ultrasound intensities than were ever used before; there is an increased use of Doppler imaging, which requires higher intensities than B-mode and M-mode ultrasound (M-mode stands for movement mode and is used exclusively in cardiac application); and in some circumstances there is the use of microbubble contrast agents. All of these factors in combination produce the potential for bioeffects. The following bioeffects have been variably reported in epidemiological studies:
effects on isolated cells in vitro
functional changes in multicellular organisms
reduction in birth weight
increase in childhood malignancies
changes in neurological development
dyslexia
handedness
speech development.
The interactions of ultrasound with tissue can give rise to potentially harmful bioeffects, the most important of these being heating and mechanical effects.
Heating
As stated earlier, absorption of ultrasound energy can lead to the heating of tissue. Heating is more likely to occur at sites in the body where the absorption is higher than in the surrounding tissue. For example, bone absorbs energy more strongly than soft tissue does and therefore the surrounding soft tissue can experience secondary heating as a result of conduction from the bone. This is particularly important as fetal bone matures, when large increases in absorption have been documented. Consequently, heating effects during routine fetal assessment need to be considered. Diagnostic ultrasound can produce temperature rises that are hazardous to sensitive organs and the developing embryo.
To this end, the thermal index has been developed in an attempt to account for the possibility of bioeffects resulting from heating. This index is an estimate of the rise in tissue temperature that might be possible under ‘reasonable worst-case conditions’ and is defined as the ratio of the acoustic power emitted to the power required to heat a particular target tissue by 1 degree C. As heating is tissue-specific, there are in fact three thermal indices: the thermal index in soft tissues (TIS), the thermal index in bone (TIB) and the thermal index in the cranium (TIC).
The responsibility for safety issues is with the operator. The operator should therefore continually monitor the thermal index and keep it as low as is consistent with achieving a diagnostic result. Regarding the safe use of ultrasound in obstetric investigations, the British Medical Ultrasound Society (BMUS) recommends monitoring of the TIS during scans carried out in the first 8 weeks following conception and monitoring of the TIB during subsequent scans.
Cavitation
Since the early days of ultrasound, it has been known that ultrasound can lyse or otherwise damage cells in suspension. This effect is not a result of the thermal properties of ultrasound; instead, it is attributable to the presence of gas-filled cavities in tissue exposed to ultrasound waves. These cavities can either oscillate or collapse under the pressure of the ultrasound beam, producing either considerable shear forces or high pressures and temperatures that can damage cell membranes or produce highly reactive free radicals. This phenomenon is known as cavitation. Gas in the lung, in the intestine and in contrast agents increases the likelihood of cavitation and mechanical damage.
Once again, an index has been developed in an attempt to account for the possibility of bioeffects resulting from mechanical effects. This is known as the mechanical index and is related to the maximum negative pressure and frequency in an ultrasound field.
The importance of cavitation has been summed up by the European Federation of Societies for Ultrasound in Medicine and Biology (EFSUMB) as follows: ‘biological effects of nonthermal origin have been reported in animals but, to date, no such effects have been demonstrated in humans, except when a microbubble contrast agent is present.’
Guidelines and recommendations for the safe use of diagnostic ultrasound
There are a number of guidelines and recommendations for the safe use of diagnostic ultrasound and these change or are updated at regular intervals. A good review of the current guidelines and recommendations can always be found on the website of the BMUS [www.bmus.org]. The BMUS also provides recommended thermal and mechanical index values. The EFSUMB [www.efsumb.org] and the American Institute of Ultrasound in Medicine [www.aium.org] also publish their latest documents on their websites.
Principles and use of X-rays, computed tomography and magnetic resonance imaging
X-Rays
X-radiation is a form of electromagnetic radiation. X-rays have a wavelength in the range of 10–0.01 nm, corresponding to frequencies in the range of 0.03–30 × 1018 Hz and energies in the range of 120 eV to 120 keV. They are longer than gamma rays but shorter than ultraviolet rays. X-rays with energies below 12 keV are classified as soft X-rays and those above as hard X-rays, owing to their penetration abilities.
Radiography is considered to be a noninvasive medical test method that is primarily used for diagnostic purposes. It is the oldest and most frequently used form of medical imaging. As a result, the term X-ray is used to refer to a radiographic image produced using this method as well as to the method itself. X-rays are a form of ionising radiation and as such can be dangerous. X-rays were listed as a carcinogen by the US government in 2005.
The sievert (Sv) is the SI unit of measure of radiation and denotes the amount of energy delivered to a human body by gamma radiation or X-radiation (ionising radiation). The old-fashioned counterpart is the rem; 1 Sv is equivalent to 100 rem. Commonly, the radiation exposure from an X-ray is in the microsievert range, whereby 1 mrem equals 10 microsievert. The average person living in the USA receives approximately 3 mSv annually from background sources alone.
Beam formation and detection
X-rays are produced by accelerating electrons, which are then made to collide with a metal target; the precise nature of the metal target depends on the type of application. In the X-ray tube, the electrons suddenly decelerate upon collision with the metal target and can knock out an electron from the inner shell of the metal atom. Electrons from higher energy levels then fill up the vacancy and X-ray photons are emitted as a result. The process is extremely inefficient and a considerable amount of energy and heat has to be wasted to produce a reasonable flux of X-rays.
X-rays were originally detected by use of a photographic plate and later by use of an X-ray film in a cassette. These devices are generally referred to as image receptors. Plates and films have been largely replaced in hospitals by computed and digital radiography, although film technology is still used in some countries and for industrial applications. Computed and digital technologies have several advantages: they do not require wet processing facilities on site; they do not require the use of silver, which is a nonrenewable resource; and the archiving and retrieval of digital images is considerably easier, with additional space-saving benefits.
Stay updated, free articles. Join our Telegram channel

Full access? Get Clinical Tree


