Background
Readmission rates are used as a quality metric in medical and surgical specialties; however, little is known about obstetrics readmissions.
Objective
Our goals for this study were to describe the trends in postpartum readmissions over time; to characterize the common indications and associated diagnoses for readmissions; and to determine maternal, delivery, and hospital characteristics that may be associated with readmission.
Study Design
Postpartum readmissions occurring within the first 6 weeks after delivery in California, Florida, and New York were identified between 2004 and 2011 in State Inpatient Databases. Of the 5,949,739 eligible deliveries identified, 114,748 women were readmitted over the 8-year period. We calculated the rates of readmissions and their indications by state and over time. The characteristics of the readmission stay, including day readmitted, length of readmission, and charge for readmission, were compared among the diagnoses. Odds ratios were calculated using a multivariate logistic regression to determine the predictors of readmission.
Results
The readmission rate increased from 1.72% in 2004 to 2.16% in 2011. Readmitted patients were more likely to be publicly insured (54.3% vs 42.0%, P < .001), to be black (18.7% vs 13.5%, P < .001), to have comorbidities such as hypertension (15.3% vs 2.4%, P < 0.001) and diabetes (13.1% vs 6.8%, P < .001), and to have had a cesarean delivery (37.2% vs 32.9%, P < .001). The most common indications for readmission were infection (15.5%), hypertension (9.3%), and psychiatric illness (7.7%). Patients were readmitted, on average, 7 days after discharge, but readmission day varied by diagnosis: day 3 for hypertension, day 5 for infection, and day 9 for psychiatric disease. Maternal comorbidities were the strongest predictors of postpartum readmissions: psychiatric disease, substance use, seizure disorder, hypertension, and tobacco use.
Conclusion
Postpartum readmission rates have risen over the last 8 years. Understanding the risk factors, etiologies, and cause-specific timing for postpartum readmissions may aid in the development of new quality metrics in obstetrics and targeted strategies to curb the rising rate of postpartum readmissions in the United States.
Hospital readmissions continue to be a focus of quality improvement and cost reduction efforts in health care. In 2010, readmission rates ranged from 11.4% to 18.1% for medical admissions and from 7.6% to 18.3% for surgical admissions in hospitals across the United States. For the Medicare population, the average readmission rate is estimated at approximately 19%. Higher rates have been reported for Medicaid patients, with readmissions accounting for up to 25% of hospital stays in the adult population.
The most frequently coded indication for hospital admission in the United States is related to pregnancy and delivery, accounting for nearly 4 million hospital stays and consistent with the national birth rate. Despite this large volume of pregnancy-related admissions, there has been no prior large-scale or population-based research on the incidence and implications of obstetric readmissions. In general, there has been limited research published on postpartum readmissions; prior studies, mostly based at single institutions, have focused on attempting to identify risk factors for readmissions.
Currently, postpartum readmission rates are not used as a quality metric in obstetrics. However, in the search for useful and relevant quality markers in the field, this study aims to increase our baseline understanding of postpartum readmissions in the United States. Thus, our goals for this study were to describe the trends in postpartum readmissions over time; to characterize the common indications and associated diagnoses for readmissions; and to determine maternal, delivery, and hospital characteristics that may be associated with readmission.
Materials and Methods
This study examines readmission data from State Inpatient Databases (SID), which are available from the Agency for Healthcare Research and Quality’s Healthcare Cost and Utilization Project (HCUP). These databases provide the following information on all statewide hospital admissions: principal and associated diagnoses and procedures; admission and discharge status; patient demographic characteristics; expected payment source; total charges; and length of stay. Readmission data in these databases are available from approximately 2003 through 2011, although not all states have data that are properly coded to identify readmissions. In 2003, only 9 states had readmission data available; in 2011, 14 had these data available.
Three states were selected for this analysis: California, Florida, and New York. These states were chosen based on the availability of readmission data, their high annual delivery volume, and their geographical distribution across the country. In combination, these states account for nearly 1 million deliveries a year, which is approximately 25% of all births in the United States. These 3 states each had readmission data available over the 8-year period from 2004 through 2011. Other states with readmission data were not included due to time and cost restraints in obtaining each state’s datasets.
Delivery-related admissions were identified from diagnosis and procedure codes using the stepwise methodology previously outlined by Kuklina et al. Of the deliveries identified, records without an assigned unique identifier were excluded, as their readmissions could not be tracked. Furthermore, patients who had 3 or more delivery admissions in a calendar year were excluded, given the biological unlikelihood of 3 separate deliveries in a 52-week period.
We defined a postpartum readmission as an admission within 42 days (6 weeks) after the date of the delivery admission. Each year was an individual data set that was not continuous or linked with admission data in prior or subsequent years. Therefore, when possible, deliveries in November and December each year were excluded because their eligible readmission period entered into the next year. Readmissions from these deliveries are unable to be identified; thus their inclusion would falsely lower the annual readmission rate. This methodology is recommended by HCUP for SID analyses and has been used in readmission projects in other specialties.
Relevant maternal comorbidities, pregnancy complications, delivery-related procedures, and intrapartum complications were identified using the diagnosis and procedure codes from the International Classification of Diseases, Ninth Revision (ICD-9), listed in Appendix A . Comorbidities and complications were classified using previously described algorithms for identifying reliable pregnancy-related data using ICD-9 codes. Available maternal characteristics included for comparison were age, race/ethnicity, primary insurance payer, median household income (in quartiles based on a patient’s postal code), and maternal comorbidities. Pregnancy characteristics included multiple gestation, prior cesarean delivery, presence of preterm labor, and placental previa (encompassing all abnormal placentations). Delivery characteristics included mode of delivery and commonly reported delivery complications and associated procedures. The hospital characteristics for comparison included their teaching status and whether they were designated as a community (ie, nonfederal, short-term, or specialty hospital), as reported to the American Hospital Association. The main outcomes of interest in this study were readmission rates over time, indications for readmission, characteristics of readmission stays, and predictors of readmissions. Readmission rates by year for the overall population and for the individual states were calculated by dividing the number of 42-day readmissions by the number of delivery admissions with revisit codes (ie, deliveries for which readmissions were eligible to be tracked). Demographic, maternal, pregnancy, and hospital characteristics were compared between the non-readmitted and the readmitted group using 2-sided t tests for continuous variables and χ 2 tests for categorical variables. P values less than .05 were considered statistically significant.
Readmission diagnoses and procedures were identified by ICD-9 diagnosis and procedure codes listed in Appendix B . The development of diagnosis clusters was based on methods used in previous studies. We considered the indication for readmission to be the primary diagnosis coded listed in the SID. However, we also examined associated diagnoses that were coded during the readmission stay.
Multivariate logistic regressions were used to determine the predictors for readmission. We included all available maternal characteristics (age, maternal comorbidities), pregnancy complications, mode of delivery, hospital characteristics, year, and state in the model. Maternal age and year were modeled as continuous variables; all other variables were modeled as categorical. Year and state were included to account for any changes in practice management or regional or national polices that may have affected readmissions. Terms with P values <.05 were considered significant.
SAS 9.4 software (SAS Institute, Cary, NC) was used for data processing and statistical analyses. All data were deidentified, and the Partners Healthcare Institutional Review Board exempted this study from review.
Results
Over 8 years, 8,020,568 deliveries were identified in the 3-state sample. There were 5,949,739 deliveries that met the inclusion criteria for analysis, and a total of 114,748 patients were readmitted.
Table 1 compares the maternal, pregnancy, peripartum, and hospital characteristics for patients who were readmitted versus those who were not readmitted. Readmitted patients were more likely to be publicly insured (54.3% vs 42.0%, P < 0.001), to be black (18.7% vs 13.5%, P < .001), to have comorbidities such as hypertension (15.3% vs 2.4%, P < .001) and diabetes (13.1% vs 6.8%, P < .001), and to have had a cesarean delivery (37.2% vs 32.9%, P < .001). Peripartum, they were more likely to have a postpartum hemorrhage (6.9% vs 5.1%, P < .001), infection (2.6% vs 1.2%, P < .001), and a thrombotic event (deep vein thrombosis or pulmonary embolus) (1.3% vs 0.7%, P < .001). There were minimal differences between readmitted and non-readmitted patients based on hospital teaching status or community hospital designation.
| Characteristics | Readmitted (n = 114,748) | Non-readmitted (n = 5,834,991) | P value |
|---|---|---|---|
| Maternal characteristics | |||
| Age | 35.8 (17.2) | 28.2 (8.3) | <.001 |
| Race/ethnicity | |||
| White | 55,214 (49.3%) | 2,617,384 (46.7%) | <.001 |
| Black | 20,927 (18.7%) | 757,050 (13.5%) | |
| Hispanic | 26,235 (23.4%) | 1,512,129 (27.0%) | |
| Asian | 4,850 (4.3%) | 429,347 (7.7%) | |
| Other | 4,778 (4.3%) | 285,643 (5.1%) | |
| Primary payer | |||
| Private | 45,825 (39.9%) | 3,101,984 (53.2%) | <.001 |
| Public | 62,305 (54.3%) | 2,449,174 (42.0%) | |
| Uninsured or self-pay | 3,479 (3.0%) | 157,116 (2.7%) | |
| Maternal comorbidities | |||
| Asthma | 6,908 (6.0%) | 179,938 (3.1%) | <.001 |
| Diabetes mellitus | 14,991 (13.1%) | 398,061 (6.8%) | <.001 |
| Hypertensive disorder (chronic) | 17,574 (15.3%) | 137,985 (2.4%) | <.001 |
| Pregnancy-related hypertensive disorder | 12,792 (11.1%) | 361,586 (6.2%) | <.001 |
| Obesity | 8,224 (7.2%) | 171,914 (2.9%) | <.001 |
| Psychiatric disease | 17,953 (15.6%) | 96,795 (1.6%) | <.001 |
| Seizure disorder | 1,536 (1.3%) | 15,602 (0.3%) | <.001 |
| Smoking | 6,829 (6.0%) | 70,422 (1.2%) | <.001 |
| Substance abuse | 8,493 (7.4%) | 106,255 (1.8%) | <.001 |
| Thyroid disease | 5,500 (4.8%) | 133,410 (2.3%) | <.001 |
| Median household income | |||
| Quartile 1 | 30,075 (30.6%) | 1,380,200 (28.0%) | <.001 |
| Quartile 2 | 25,304 (25.8%) | 1,235,593 (25.0%) | |
| Quartile 3 | 23,572 (24.0%) | 1,208,919 (24.5%) | |
| Quartile 4 | 19,209 (19.6%) | 1,111,300 (22.5%) | |
| Pregnancy and delivery characteristics | |||
| Pregnancy characteristics | |||
| Multiple gestation | 3,527 (3.1%) | 105,235 (1.8%) | <.001 |
| Prior cesarean | 16,294 (14.2%) | 889,847 (15.2%) | <.001 |
| Preterm labor | 13,956 (12.2%) | 406,428 (7.0%) | <.001 |
| Placenta previa | 1,454 (1.3%) | 59,013 (1.0%) | <.001 |
| Mode of delivery | |||
| Cesarean delivery | 42,638 (37.2%) | 1,922,335 (32.9%) | <.001 |
| Delivery/peripartum complications | |||
| Hemorrhage | 7,901 (6.9%) | 294,986 (5.1%) | <.001 |
| Laceration | 3,206 (2.8%) | 250,289 (4.3%) | <.001 |
| Infection | 2,928 (2.6%) | 71,263 (1.2%) | <.001 |
| Thrombotic event | 1,508 (1.3%) | 40,338 (0.7%) | <.001 |
| Uterine rupture | 136 (0.1%) | 2,816 (0.0%) | <.001 |
| Operative injury | 435 (0.4%) | 7,287 (0.1%) | <.001 |
| Other | 4,723 (4.1%) | 92,174 (1.6%) | <.001 |
| Hospital characteristics | |||
| Teaching status | |||
| Major teaching | 43,624 (44.2%) | 2,190,832 (43.6%) | <.001 |
| Minor teaching | 160 (0.2%) | 7,565 (0.2%) | |
| Nonteaching | 54,889 (55.6%) | 2,831,567 (56.3%) | |
| Community hospitals | |||
| Noncommunity hospitals | 111,242 (98.4%) | 5,678,741 (98.6%) | <.001 |
| Community hospitals | 1,830 (1.6%) | 82,403 (1.4%) |
Figure 1 shows the rates of readmission by state compared to the average readmission rate. All states had an increase in readmissions over the 8 years. Overall, the rate of postpartum readmissions increased by approximately 25% from 1.72% to 2.16%. Florida had the sharpest increase in readmissions at 41% (from 1.97% to 2.78%). New York’s readmissions increased 20% (from 1.67% to 2.00%). By comparison, the increase in California’s readmission rate was the lowest at 16% (from 1.61% to 1.88%).
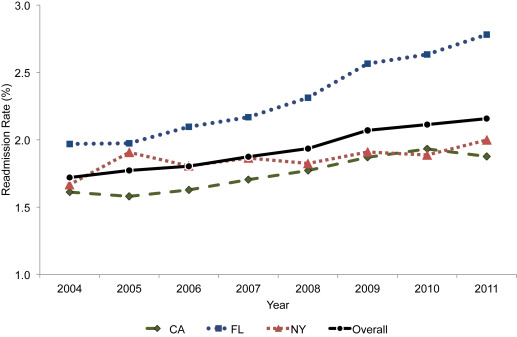
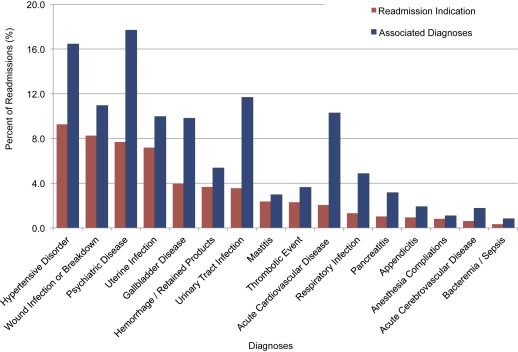
Figure 2 displays the rates of the readmission by diagnosis. The diagnoses are ordered from most to least prevalent primary diagnosis in the figure. The most common primary diagnoses associated with readmission were hypertensive disorder (9.3%), wound infection or breakdown (8.3%), psychiatric disease (7.7%), and uterine infection (7.2%). These 4 diagnoses were approximately twice as prevalent as any of the remaining primary diagnoses. As patients often present with more than 1 diagnosis, the most common diagnoses for readmitted patients, including both primary and secondary diagnoses, included psychiatric disease (17.7%), hypertensive disorder (16.4%), urinary tract infection (11.7%), wound infection or breakdown (10.9%), acute cardiovascular disease (10.3%), and uterine infection (10.0%).
The median time from discharge to readmission was 7 days (IQR, 2–19 days), and patients had a median length of stay of 2 days (IQR, 1–3 days). The median number of days to readmission differed by the indication for readmission. Patients with hypertension were readmitted relatively soon after discharge (median, 3 days; IQR, 2–6 days) and had the shortest length of stay (median, 2 days; IQR, 1–3 days). In comparison, patients readmitted with psychiatric disease or substance abuse issues presented a median of 9 days after discharge (IQR, 1–23 days) and had prolonged stays (median, 5 days; IQR, 3–9 days). The most common procedures performed during readmissions were blood transfusion (594/10,000 per readmissions) and dilation and curettage (208/10,000 per readmissions).
Figure 3 illustrates the cumulative percentage of postpartum patients who were readmitted within 6 weeks of delivery for all readmissions, and the 4 most common indications. Overall, approximately 90% of readmissions occurred within the first 30 days. For hypertension, wound breakdown, and psychiatric disease, more than 97% of readmissions occurred within 30 days; for uterine infection, 85% of readmissions occurred within 30 days. Readmitted patients with hypertension were more likely to be readmitted sooner compared to patients with other diagnoses, whereas patients with uterine infections had less predictable, more equally distributed rates of readmission by day.
Table 2 lists the odds ratios (OR) and 95% confidence intervals (CI) for the multivariate logistic regression output that models the predictors of postpartum readmission. The year term was insignificant, suggesting that the increasing rates of readmissions were explained by other terms in the model and not other extrinsic factors. However, there does appear to be regional differences in the rates of postpartum readmissions, as California had the lowest rates of readmission and Florida had the highest.
| Model term | Odds ratio (95% CI) | P value |
|---|---|---|
| Year | 1.001 (0.998–1.005) | .449 |
| State | ||
| California | 0.953 (0.936–0.971) | <.001 |
| Florida | 1.039 (1.021–1.058) | <.001 |
| New York | Reference | |
| Patient demographics | ||
| Insurance status | ||
| Private | 0.746 (0.713–0.779) | <.001 |
| Public | 1.138 (1.089–1.188) | <.001 |
| Uninsured | Reference | |
| Race/ethnicity | ||
| Black | 1.348 (1.321–1.374) | <.001 |
| Hispanic | 0.999 (0.981–1.017) | <.001 |
| Asian | 0.694 (0.672–0.718) | <.001 |
| White | Reference | |
| Income | ||
| First quartile | 1.064 (1.042–1.086) | .009 |
| Second quartile | 1.070 (1.048–1.092) | <.001 |
| Third quartile | 1.058 (1.037–1.133) | .087 |
| Fourth quartile | Reference | |
| Maternal characteristics | ||
| Age | 1.038 (1.037–1.038) | <.001 |
| Asthma | 1.284 (1.249–1.321) | <.001 |
| Diabetes mellitus | 1.234 (1.208–1.259) | <.001 |
| Hypertensive disorder (chronic) | 1.886 (1.839–1.934) | <.001 |
| Pregnancy-induced hypertension | 1.652 (1.617–1.688) | <.001 |
| Obesity | 1.455 (1.418–1.494) | <.001 |
| Psychiatric disease | 2.542 (2.488–2.600) | <.001 |
| Seizure disorder | 1.989 (1.873–2.113) | <.001 |
| Smoking | 1.859 (1.800–1.921) | <.001 |
| Substance dependence/abuse | 2.016 (1.958–2.075) | <.001 |
| Thyroid disease | 1.061 (1.028–1.096) | <.001 |
| Pregnancy characteristics | ||
| Cesarean delivery | 1.431 (1.408–1.455) | <.001 |
| Multiple gestation | 1.201 (1.154–1.249) | <.001 |
| Prior cesarean delivery | 0.753 (0.737–0.769) | <.001 |
| Preterm labor | 1.632 (1.597–1.667) | <.001 |
| Placenta previa | 1.135 (1.071–1.203) | <.001 |
| Hospital characteristics | ||
| Hospital teaching status | ||
| Major teaching | 1.008 (0.992–1.034) | .088 |
| Minor teaching | 1.231 (0.987–1.534) | .075 |
| Nonteaching | Reference | |
| Community hospital | 0.898 (0.847–0.951) | <.001 |
Stay updated, free articles. Join our Telegram channel

Full access? Get Clinical Tree


