Summary
- Childhood obesity can be measured in various ways, but applying a single method across all available data shows a rapid rise in the numbers of children affected.
- Very few countries have shown a reversal of this trend, but prevalence levels vary across populations, and according to social demographics.
- The rise in child obesity will almost certainly lead to a rise in adult obesity rates.
- Child obesity is a health concern itself and will increase the demand for pediatric treatment.
In many developed economies child obesity levels have doubled in the last two decades.1 The impending disease burden in these countries has been described by medical professionals as “a public health disaster waiting to happen”,2 “a massive tsunami”,3 and “a health time-bomb”.4 In emerging and in less developed economies, child obesity prevalence levels are also rising,5 especially among populations in urban areas where there may be less necessity for physical activity, greater opportunities for sedentary behavior and greater access to energy-dense foods and beverages.
This chapter looks at the figures and predictions, and considers the implications in terms of children’s obesity-related health problems and the need for policy development for both pediatric treatment services and public health preventive action.
Measuring the prevalence of obesity
Policy-makers will need to evaluate the trends in child obesity and the success of any interventions, but they face an initial problem in agreeing a clear definition of what constitutes excess body weight in a child. Among adults, obesity is generally defined as a BMI greater than 30 kg/m2, and overweight as a BMI between 25 and 30 kg/m2, but for children there are difficulties in defining a single standard as normally-growing children show significant fluctuations in the relationship between weight and height. Charts showing weight, height and BMI for children by age and gender are commonly used, but with different cut-off points for overweight and obesity, such as 110% or 120% of ideal weight for height, or weight-for-height greater than 1 or 2 standard deviations above a predefined mean, or a BMI-for-age at the 85th, 90th, 95th or 97th percentiles, based on various reference populations.1
For young children, it has been common practice to use “weight-for-height” rather than BMI. This stems from existing definitions used in the assessment of underweight and stunting, where “weight-for-age”, “height-for-age” and “weight-for-height” are used to assess infant growth. The measures are still occasionally used for assessing overweight in young children, usually by taking a value of two standard deviations (Z >+2.0) above a reference population mean as the criteria for excess weight for a given age and gender.
In recent years, BMI has been increasingly accepted as a valid indirect measure of adiposity in older children and adolescents for survey purposes,1,6 leading to various approaches to selecting appropriate BMI cut-off values to take account of age and gender differences during normal growth.7–12 A number of different BMI-for-age reference charts have been developed, such as those from the US National Centre for Health Statistics,9 the United Kingdom10 and France.11
An expert panel convened by the International Obesity TaskForce (IOTF) proposed a set of BMI cut-offs based on pooled data collected from Brazil, Britain, Hong Kong, Singapore, the Netherlands and the USA. The IOTF definitions of overweight and obesity are based on BMI centile curves that passed through the adult cut-off points of BMI 25 and 30. The resulting set of age- and gender-specific BMI cut-off points for children was published in 2000.12
The World Health Organization (WHO) has for many years recommended using a set of cut-offs based on a reference population derived from the USA, but more recently the WHO has been reviewing their recommendations. There had been concern that the USA data included large numbers of formula-fed infants with growth patterns that differed from breast-fed infants, and which underestimated the true extent of overweight in younger children. WHO has now published a new “standard” set of growth charts for children aged 0–5 years, based on data from healthy breast-fed babies.13 It is unclear at this stage what BMI cut-off values should be used from this healthy population to define overweight and obesity, with both centile and Z-score options available in published tables. Further reference charts are available for children aged 5–19 years, based on a revision of US data collected in 1977 adapted to match the standards for 0–5-year-olds.
Care should be taken when looking at published prevalence figures for overweight and obesity. Some authors use “overweight” to define all members of a population above a specified cut-off, while others mean “overweight” to mean those above one cut-off but not above a higher cut-off that defines obesity. Thus, in some reports the prevalence value for “over-weight” children includes obese children and in other reports it does not. In this section “overweight” includes obese, so the term should properly be understood to mean “overweight including obese”. Readers should also note that prevalence levels using reference curves from the USA sometimes refer to “at risk of overweight” and “overweight” for the top two tiers of adiposity, and sometimes to “overweight” and “obese”.
It should also be noted that the definitions are very helpful for making comparisons between different population groups, or monitoring a population over time. However, for the clinical assessment of children, serial plotting of BMI on nationally recommended BMI-for-age charts should be coupled with more careful examination of the child in order to be sure that, for example, a high BMI is not due to extra muscle mass or to stunted linear growth.
In this chapter the prevalence levels will be based on the IOTF international classification scheme, as most survey evidence is available using this approach, and the results tend to be more conservative than some other approaches.1
Policy-makers face a second hurdle in understanding the circumstances surrounding obesity in children and adolescents, namely, a lack of representative data on what is happening in the population that is of interest. Only in a few countries are children monitored routinely and data on their nutritional status gathered, analysed and reported consistently.
Even where data are available, they need to be examined carefully. Firstly, data may be collected using proper measurement procedures, or may be self-reported, but self-reported measures tend to underestimate BMI, especially among more over-weight respondents. Data may come from nationally representative surveys or from smaller surveys—for example, in the more accessible urban areas—which do not represent national populations. And, when comparing two surveys across a period of time, surveys need to be properly comparable in terms of the children’s ages, and their ethnic and socio-demographic mix.
The figures presented here are based on the latest and most reliable available, some of which were previously published in 2006 by Wang and Lobstein.5 Unless otherwise stated, the IOTF definitions of over-weight and obesity in childhood are used.
Global figures
Taking an estimate for the world as a whole, in 2004 some 10% of school-age children (aged 5–17) were defined as overweight, including some 2–3% who were obese. This global average reflects a wide range of prevalence levels in different regions and countries, with the prevalence of overweight in Africa and Asia averaging well below 5% and in the Americas and Europe above 20%. Projections to the year 2010 are shown in Table 1.1.
Table 1.1 Estimated prevalence of excess bodyweight in school-age children in 2010.
Source: Wang and Lobstein.
| Regiona | Obese | Overweight (including obese) |
| Americas | 15% | 46% |
| Mid East & N Africa | 12% | 42% |
| Europe & former USSR | 10% | 38% |
| West Pacific | 7% | 27% |
| South East Asia | 5% | 23% |
| Africa | > 1% | > 5% |
aCountries in each region are according to the World Health Organization.
Region: Americas
The most comprehensive and comparable national representative data on trends in the prevalence of obesity are from the USA, where nationally representative surveys undertaken in the 1960s were followed by the series of National Health and Nutrition Examination Surveys (NHANES) from 1971 onwards. The most recent publications (for surveys conducted in 2003–2004) show that 36% of children aged 6–17 were overweight, including 13% obese. These figures are based on the international (IOTF) criteria for overweight and obesity,12 and compare with 36% and 18% respectively using US-defined cut-offs.14
In Canada 26% of younger children and 29% of older children were found to be overweight in a 2004 survey, almost exactly double the prevalence levels found among children 25 years earlier.15 In Brazil, the prevalence of overweight among school-aged children was 14% in 1997, compared with 4% in 1974. In Chile, in 2000 the prevalence of overweight among school children was 26%.
There are few data available for schoolchildren in most other South and Central American countries, but some data have been collected for pre-school children. In Bolivia, the prevalence of overweight (defined as one standard deviation above a reference mean) was 23% in 1997, and in the Dominican Republic it was 15% in 1996. In a few countries in the region, obesity prevalence has fallen: in Columbia it fell from 5% to 3% between 1986 and 1995.
Region: Europe
A number of studies have examined childhood over-weight and obesity prevalence in European countries. The highest prevalence levels are observed in southern European countries. A survey in 2001 found that 36% of 9-year-olds in central Italy were overweight, including 12% who were obese. In 1991, 21% of school-age children in Greece were overweight or obese, whereas a decade later, in 2000, 26% of boys and 19% of girls in Northern Greece were overweight or obese, while data from Crete in 2002 show 44% of boys aged 15 years to be overweight or obese. In Spain, 35% of boys and 32% of girls aged 13–14 years were overweight in a survey in 2000.
Northern European countries tend to have lower prevalence values. In Sweden in 2000–2001, the prevalence was 18% for children aged 10 years. In the Netherlands the figures are particularly low, with only 10% of children aged 5–17 overweight, including only 2% obese, in a 1997 survey. In France, the figures are a bit higher, at 15% overweight and 3% obese in a northern French survey in 2000, and these figures appear to have remained stable, according to recent preliminary results of surveys in 2007.16 In England, prevalence rates have climbed to 29% overweight, including 10% obese, in a 2004 survey.
The reasons for a north–south gradient are not clear. Genetic factors are unlikely to be the explanation, as the gradient can be shown even within a single country, such as Italy and virtually all countries have shown a marked increase in prevalence in recent decades. A range of factors influencing regional barriers or promoters of population levels of physical activity may be important. The child’s household or family income may be another relevant variable, possibly mediated through income-related dietary factors such as maternal nutrition during pregnancy, or breast- or bottle-feeding in infancy, as well as the quality of the diet during childhood.
Regions: North Africa, Eastern Mediterranean and Middle East
Several countries in this region appear to be showing high levels of childhood obesity. In Egypt, for example, the prevalence of overweight (based on local reference charts and a z score > was over 25% in pre-school children and 14% in adolescents. Similar figures are found in other parts of the region. A fifth of adolescents aged 15–16 years in Saudi Arabia were defined as overweight (based on BMI > 120% reference median value). In Bahrain in 2002, 30% of boys and 42% of girls aged 12–17 were overweight, including over 15% obese in both groups (defined by IOTF cut-offs).
Regions: Asia and Pacific
The prevalence of obesity among pre-school children is around 1% or less in many countries in the region, for example Bangladesh (1.1%), the Philippines (0.8%), Vietnam (0.7%) and Nepal (0.3%), but it should be noted that no data are available for some countries in the region (e.g., the Pacific islands) where adult obesity prevalence rates are known to be high.
In more economically developed countries, the prevalence figures for pre-school and school-age children are considerably higher. Among Australian children and adolescents aged 7–15 years, the prevalence of overweight (including obesity) doubled from 11% to 21% between 1985 and 1995, and was found to be 27% in a regional survey of 4–12-year-olds in 2003–4.17
In mainland China, whose population accounts for one-fifth of the global population, the prevalence of obesity has been rising in both adults and children during the past two decades. A survey in 1992 showed the prevalence of overweight, including obesity, among schoolchildren to be 4%–this rose to 7% in 2002. In urban areas the prevalence was 10%, and in the largest cities nearly 20% (see Table 1.3).
While the epidemic of obesity has affected a wide range of countries in this region, under-nutrition is still a major problem. In China, the prevalence of underweight (<5th percentile BMI of the US reference) was 9% among children aged 6–9 years, and 15% among children aged 10–18, in 1997. In Indonesia, over 25%, and in Bangladesh and India over 45% of children under 5 years old are under-weight. Thus, several of the most populous countries in this region are facing a double burden of continued under-nutrition and rising over-nutrition.
Region: Sub-Saharan Africa
The burden of under-nutrition remains very high in this region, with continuing poverty, war, famine and disease, especially HIV/Aids, and very high rates of child mortality. There are very few surveys from African countries that can provide prevalence figures for childhood obesity, as most public health nutrition programs have been focused on under-nutrition and food safety problems. In general, the prevalence of childhood obesity remains very low in this region, except for countries such as South Africa where obesity has become prevalent in adults, particularly among women, and where childhood obesity is also rising. Data from South Africa show the prevalence of overweight (including obesity) among young people aged 13–19 years to be over 17%, with boys generally less at risk (7%) than girls (25%). Prevalence was highest (over 20% for both boys and girls) in white and Indian population groups.
The prevalence of excess weight among children is increasing in both developed and developing countries, but at different rates and in different patterns. North America and some European countries have the highest prevalence levels, and in recent years have shown high year-on-year increases in prevalence. Data from Brazil and Chile show that rates of increasing overweight among children in some developing countries is comparable to that in the USA or Europe.
Other countries are showing only modest increases. China has shown a small rise in the prevalence of overweight among rural children, but a more marked increase among urban children.18 The rapid rise in the prevalence of overweight is shown in most developed economies, but an interesting exception is Russia, where the economic downturn in the early 1990s may explain the decline in the prevalence of overweight children during the period (Table 1.2).
Table 1.2 Examples of the rise in the prevalence of overweight children in developed and developing economies.
| Date of survey | Prevalence of overweight | |
| USA | 1971–74 | 14% |
| 1988–94 | 25% | |
| 2003–4 | 36% | |
| Canada | 1978–79 | 14% |
| 2004 | 29% | |
| Australia | 1985 | 11% |
| 1995 | 21% | |
| New Zealand | 1989 | 13% |
| 2000 | 30% | |
| Japan | 1976–80 | 10% |
| 1992–2000 | 19% | |
| England | 1984 | 7% |
| 1994 | 12% | |
| 2004 | 29% | |
| Greece (boys) | 1991 | 21% |
| Greece North (boys) | 2000 | 26% |
| Greece Crete (boys) | 2002 | 44% |
| Iceland | 1978 | 12% |
| 1998 | 24% | |
| Netherlands | 1980 | 5% |
| 1996–97 | 11% | |
| Spain | 1980 | 13% |
| 1995 | 19% | |
| 2000–2 | 34% | |
| Brazil | 1974 | 4% |
| 1997 | 14% | |
| Chile | 1987 | 13% |
| 2000 | 27% | |
| China rural | 1992 | 4% |
| 2002 | 5% | |
| China urban | 1992 | 7% |
| 2002 | 10% | |
| Russia | 1992 | 15% |
| 1998 | 9% | |
| 2005 | 12% a |
aBased on self-reported height and weight.
Demographics of child adiposity
If policies to prevent child obesity are to be successful they need to consider the distribution of the problem among different demographic groups within the child population. Some population groups are more easily accessed than others but they may not be those most in need of attention. Treatment may be accessed more easily by some groups, but not necessarily by those that need it most.
Examination of differences in the distribution of overweight and obesity among children coming from different social classes (defined by family income levels or educational levels of the main income earner) shows a complex pattern. In more economically developed, industrialized countries, children in lower socio-economic groups tend to show higher prevalence levels of overweight and obesity. Moreover, programmes to tackle obesity may be assisting better-off families while obesity levels continue to rise among poorer families.
In contrast, in countries that are not economically developed, or are undergoing economic development, overweight and obesity levels tend to be highest among families with the highest incomes or educational attainment. In Brazil, in 1997, 20% of children in higher-income families were overweight or obese, compared with 13% of children in middle-income families and only 6% of children in lower-income families. In China, there is a clear positive association between child overweight and both income level and educational level, and by urban–rural differences (Table 1.3).
Table 1.3 Prevalence of overweight and obesity (combined) among children aged 7–12 years in rural and urban populations and various income and education levels defined by parental status, China, 2002.
Source: Li.18
| Boys | Girls | |
| Urban/rural | ||
| Large city | 24% | 15% |
| Small city | 10% | 7% |
| Village | 5% | 3% |
| Family income (yuan/year/person) | ||
| >10,000 | 22% | 13% |
| 5000–10,000 | 15% | 10% |
| 2000–5000 | 10% | 7% |
| <2000 | 7% | 3% |
| Education level of father | ||
| College and higher | 20% | 12% |
| Senior high school | 15% | 9% |
| Junior high school | 7% | 5% |
| Primary or less | 4% | 2% |
These figures need to be considered in developing policies targeting obesity prevention. Economic development in urban and rural areas is likely to be closely related to the development of environments that reduce physical activity, encourage sedentary behavior and encourage the consumption of energy-dense foods and beverages. Physical activity is likely to be highest in rural areas in less developed economies, where there is likely to be only limited access to pre-processed, long-shelf-life, mass-produced products—soft drinks, fatty snack foods, confectionery and fast food outlets—compared with urban areas and among wealthier families. In contrast, in highly-developed economies, the large majority of the population is likely to have less need of physical activity and to have extensive access to processed, energy-dense foods and beverages.
For children, economic development sees a move from agricultural labor and domestic labor to TV watching, while active transport (walking, cycling) is replaced with motorized transport, even for short journeys such as getting from home to school or to shops. Traditional staple foods give way to highly marketed and promoted branded food and beverage products.
When economic development suffers a reversal, as was witnessed in some Eastern European economies and in the Russian Federation during the late 1980s and early 1990s, child overweight levels may actually show decreasing prevalence, as the data for Russia indicate here. A study of children’s body height and mass in Poland from 1930 until 1994 indicated that the lowest values for both traits were found immediately post-war (1948–49), increasing to the end of the 1970s, and falling again during the recession of the 1980s.19 When the economy recovers, the prevalence of overweight and obesity may increase sharply, as has been shown in data for East Germany (school-age children) and Croatia (pre-school children) in the years following unification and national independence, respectively.
Child obesity and tracking to a dulthood
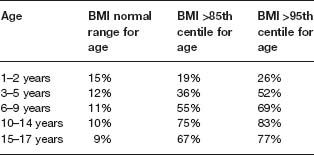
One of the most pressing considerations to emerge from the dramatic rise in child obesity is the likely impact that this will have on adult disease rates in the next few years. The persistence, or tracking, of obesity from childhood and adolescence to adulthood has been well documented.20 In the USA, Whitaker et al21 demonstrated that if a child was obese during childhood, the chance of being obese in young adulthood ranged from 8% for 1- or 2 year-olds without obese parents to 79% for 10–14-year-olds with at least one obese parent. Evidence from a longitudinal study of children, the Bogalusa Heart Study, suggests that children who have overweight onset before the age of 8 are at significantly increased risk of obesity in adulthood.22 Comparing racial groups, tracking of adiposity was stronger for black compared with white youths, especially for females (Table 1.4).23
Table 1.4 Proportion of children who had a BMI > 27.5 kg/m2 as young adults (before age 30 years) according to obesity status in childhood.
Source: Whitaker et al.
Stay updated, free articles. Join our Telegram channel

Full access? Get Clinical Tree


