Background
Intrauterine growth restriction and premature birth represent 2 independent problems that may occur simultaneously and contribute to impaired neurodevelopment.
Objective
The objective of the study was to assess changes in the frontal lobe metabolic profiles of 1 year old intrauterine growth restriction infants born prematurely and adequate-for-gestational-age controls, both premature and term adequate for gestational age and their association with brain structural and biophysical parameters and neurodevelopmental outcome at 2 years.
Study Design
A total of 26 prematurely born intrauterine growth restriction infants (birthweight <10th centile for gestational age), 22 prematurely born but adequate for gestational age controls, and 26 term adequate-for-gestational-age infants underwent brain magnetic resonance imaging and magnetic resonance spectroscopy at 1 year of age during natural sleep, on a 3 Tesla scanner. All brain T1-weighted and diffusion-weighted images were acquired along with short echo time single-voxel proton spectra from the frontal lobe. Magnetic resonance imaging/magnetic resonance spectroscopy data were processed to derive structural, biophysical, and metabolic information, respectively. Neurodevelopment was evaluated at 2 years of age using the Bayley Scales 3rd edition, assessing cognitive, language, motor, socioemotional, and adaptive behavior.
Results
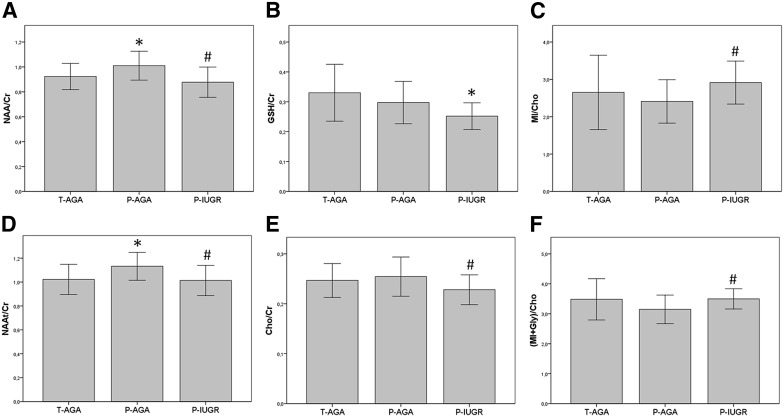
Prematurely born intrauterine growth restriction infants had slightly smaller brain volumes and increased frontal lobe white matter mean diffusivity compared with both prematurely born but adequate for gestational age and term adequate for gestational age controls. Frontal lobe N-acetylaspartate levels were significantly lower in prematurely born intrauterine growth restriction than in prematurely born but adequate for gestational age infants but increased in prematurely born but adequate for gestational age compared with term adequate-for-gestational-age infants. The prematurely born intrauterine growth restriction group also showed slightly lower choline compounds, borderline decrements of estimated glutathione levels, and increased myoinositol to choline ratios, compared with prematurely born but adequate for gestational age controls. These specific metabolite changes were locally correlated to lower gray matter content and increased mean diffusivity and reduced white matter fraction and fractional anisotropy. Prematurely born intrauterine growth restriction infants also showed a tendency for poorer neurodevelopmental outcome at 2 years, associated with lower levels of frontal lobe N-acetylaspartate at 1 year within the preterm subset.
Conclusions
Preterm intrauterine growth restriction infants showed altered brain metabolite profiles during a critical stage of brain maturation, which correlate with brain structural and biophysical parameters and neurodevelopmental outcome. Our results suggest altered neurodevelopmental trajectories in preterm intrauterine growth restriction and adequate-for-gestational-age infants, compared with term adequate-for-gestational-age infants, which require further characterization.
Intrauterine growth restriction (IUGR) caused by placental insufficiency affects 5–10% of all pregnancies. This condition is associated with fetal undernutrition and chronic hypoxia and has 2 distinct clinical presentations: early- and late-onset IUGR. Whereas the late-onset subtype represents a milder but more prevalent form of IUGR, early-onset IUGR is a severe condition, associated with fetal deterioration and elective preterm delivery.
From a brain structural perspective, late-onset IUGR fetuses present differences in cortical development, corpus callosum, brainstem, and cerebellum. With regard to brain metabolism, reduced levels of N-acetyl aspartate (NAA; a neuronal marker) ratios to choline compounds (Cho; maker of cell membrane turnover [NAA/Cho]) or creatine (Cr; implicated in cellular energetics [NAA/Cr]) have been detected in fetuses with early- and late-onset IUGR. Moreover, an association between brain microstructural changes (smaller corpus callosum) and altered metabolic profile (lower NAA/Cho) has been shown in late-IUGR fetuses. These prenatal brain developmental changes reflect the so-called fetal brain programming under placental insufficiency.
Regardless of its clinical presentation, IUGR is associated with suboptimal neurodevelopmental outcome, mostly affecting frontal networking functions such as attention, creativity, language, memory performance, and learning abilities. Efforts have been made to unveil which mechanisms are involved in brain remodeling under IUGR conditions. However, it is difficult to address the differential effects of early-onset IUGR and premature birth because they represent 2 independent conditions occurring simultaneously, and both can contribute to an impaired neurodevelopment.
Understanding the specific contribution of early-onset IUGR to this problem could be paramount for improving its clinical management and foster discussion about potential perinatal interventions. The first year of life represents a very active period of brain maturation and is therefore suitable for such assessment.
Previous studies on early-onset IUGR have reported reduced brain volumes and altered cortical development during the neonatal period and altered white matter (WM) microstructure and global gray matter (GM) decrements at 1 year of age. Moreover, a mixed population of 1 year old early/late-IUGR infants showed structural brain networks with a reduced level of organization and specific correlations between brain regional circuit metrics and related neurodevelopmental outcomes.
Although 1 year old late-onset IUGR infants have shown increased frontal lobe levels of NAA/Cr, brain metabolic profile changes in the early-onset form have not yet been assessed at this age. Therefore, it remains unclear whether neurodevelopmental changes in early- and late-onset IUGR are underlied by similar metabolic alterations.
The purpose of this study was to assess changes in brain metabolite profiles of 1 year old preterm infants with early-onset IUGR (P-IUGR) as compared with adequate-for-gestational-age controls, both premature (P-AGA) and born at term (T-AGA), and their regional association with brain structural and biophysical parameters, and neurodevelopmental outcome at 2 years.
Materials and Methods
Study cohort
This study is part of a larger prospective research program on IUGR involving fetal and short- and long-term postnatal follow-up. The protocol used was approved by the local institutional ethics committee (review board 2010/5736), and all parents gave their written informed consent.
A consecutive sample of 74 neonates was prospectively recruited at birth. Subjects were classified according to their gestational age (GA) at birth and birthweight centile, corrected for sex and GA at birth ; GAs were established from fetal crown-rump lengths in the first trimester. This sample included a group of 26 singleton neonates delivered after 37 weeks, with birthweight above the 10th centile (T-AGA); and 48 neonates delivered before 37 weeks (preterm), including 60% singleton pregnancies.
Preterm subjects with a birthweight above the 10th centile were classified as P-AGA (n = 22) and those below the 10th centile as P-IUGR (n = 26). Infants with congenital malformations, chromosomal abnormalities, infections, or chronic maternal pathology were not eligible for this study.
Magnetic resonance (MR) acquisition
Brain magnetic resonance imaging (MRI) was carried out at 16.1 (±2.4) months of age, without sedation, during natural sleep. Data were acquired with a 3.0 T scanner (TIM TRIO; Siemens Diagnostics Healthcare, Erlangen, Germany), and a head matrix radiofrequency coil was used. The total length of each MR examination did not exceed 45 minutes.
High-resolution, T1-weighted anatomical images were acquired with magnetization prepared rapid acquisition gradient echo: repetition time (TR), 2050 milliseconds; echo time (TE), 2.41 milliseconds; inversion time, 1050 milliseconds; 192 sagittal slices with 0.9 mm thickness, without interslice gap; in-plane acquisition matrix, 256 × 256; field of view, 220 × 220 mm; and voxel size, 0.86 × 0.86 × 0.9 mm.
Proton spectra were then obtained from the frontal lobe region using single-voxel point resolved spectroscopy (PRESS): voxel size, 40 × 20 × 20 cubic millimeters; TR, 2000 milliseconds; TE, 30 milliseconds; transients, 98; water suppression module, chemical shift selective; acquisition time, 3.5 minutes. A reference spectrum was also acquired, with 16 transients and no water suppression.
Diffusion-weighted images were also acquired using single-shot, echo-planar imaging: TR, 9300 milliseconds; TE, 94 milliseconds; 40 axial slices, 3 millimeter thickness, without interslice gap; matrix, 122 × 122; field of view, 200 × 200 millimeters, voxel size, 1.64 × 1.64 × 3 millimeters; 30 diffusion directions (b = 1000 s/mm 2 ), and a baseline image (b = 0 s/mm 2 ). Structural MR images were reviewed for the presence of anatomical abnormalities by an experienced neuroradiologist blinded to the group membership.
Postprocessing of MRI and magnetic resonance spectroscopy (MRS) data
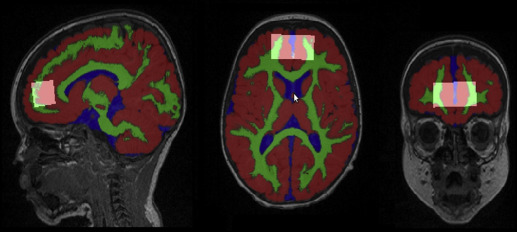
The T1-weighted and diffusion-weighted images were used for brain segmentation ( Figure 1 ), computing structural and biophysical regional parameters, such as WM, GM, cerebrospinal fluid (CSF), average fractional anisotropy (FA) and mean diffusivity (MD), integrity, and directionality of the fiber tracts. This is detailed in Supplemental Methods 1 . All acquired MRI structural and diffusion images were visually inspected for apparent or aberrant artifacts and subjects excluded accordingly.
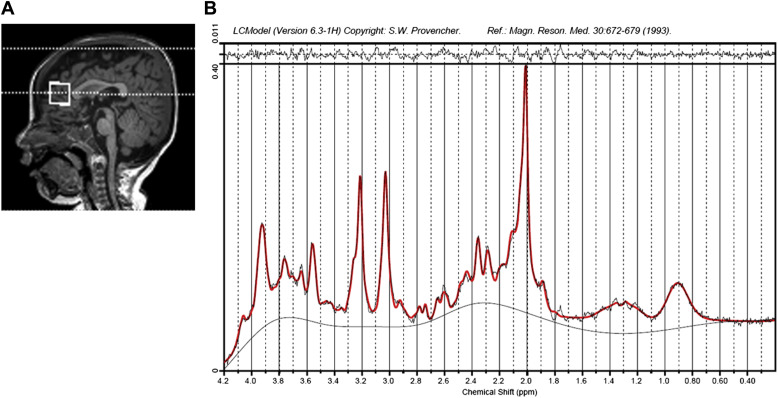
MRS data were quantified using linear combination model fitting (LC model, Figure 2 ), as detailed in Supplemental Methods 2 . MRS data were selected for further analysis only if the following applied: no gross visual artifacts were detectable and the spectral pattern was interpretable ; signal-to-noise ratio >10; and estimated full width at half maximum <0.1 parts per million. The data were quantified based on the reference water scans, and the metabolite ratios to total Cr and to the total Cho were determined. The brain metabolites were assigned according to the literature.
Neurodevelopmental assessment
Neurodevelopmental outcome was assessed at 22.5 (±2.5) months of age, using the Bayley Scales of Infant and Toddler Development test, third edition (BSID-III). Five distinct areas were evaluated: cognitive, language, motor, socioemotional behavior, and adaptive behavior scales. Each area consists of a score with a normalized mean of 100 ± 15 (controls). All developmental examinations were performed by a single experienced psychologist, blinded to the infant’s medical history. Patients were classified into 2 groups of neurodevelopmental outcome based on their BSID-III area scores: abnormal test, at least 1 score below 85 (1 SD); normal test, and all scores above (≥) 85.
Statistical analysis
Quantitative and qualitative parameters were initially compared between the different clinical groups with a Student t test for independent samples (or a Mann-Whitney U test, for nonnormal distributions) and a Pearson’s χ 2 , respectively. Linear comparisons of perinatal clinical and demographic observations across the 3 groups were performed using an analysis of variance test with polynomial contrast, a Jonckheere-Terpstra test, or a linear Pearson’s χ2 test, as appropriate.
Differences in BSID-III test scores, structural and biophysical parameters, and brain metabolite levels across the different groups were analyzed with a general linear model (GLM), using a polynomial contrast adjusted by potential confounding factors, such as gestational age at birth, sex, maternal breast-feeding longer than 4 months, low socioeconomic status, and corrected age at MRI and/or at BSID-III test, as appropriate.
Correlations between metabolite levels and MRI parameters were assessed with Pearson coefficients (or Spearman for nonnormal distributions). Data are displayed as mean ± SD. All statistical analyses were performed with IBM SPSS, version 19.0 (SPSS Inc, Chicago, IL), considering results significant at a value of P < .05.
Results
Infant cohort and perinatal clinical observations
After MRI and MRS data assessment, spectra from 53 infants complied with our evaluation standards and were selected for further analysis: 15 P-IUGR, 58%; 15 P-AGA, 56%; and 23 T-AGA, 88% ( Table 1 ). Significant differences in biometrical parameters and physical condition were detectable at birth across the 3 clinical groups, such as weight, length, cephalic perimeter, Apgar score, and admission to the neonatal intensive care unit ( Table 2 ). At 1 year of age, preterm infants showed lower weight and height than term infants, although no specific differences were detectable between the P-AGA and P-IUGR groups ( Table 2 ).
| Parameter | T-AGA, n | P-AGA, n | P-IUGR, n | Total, n | % |
|---|---|---|---|---|---|
| Initial number of subjects | 26 | 22 | 26 | 74 | 100 |
| Signs of brain pathology (MRI) a | 3 | 3 | 6 | 12 | 16 |
| Poor spectral quality (MRS) b | 0 | 4 | 5 | 9 | 12 |
| Final cohort | 23 | 15 | 15 | 53 | 72 |
a Enlarged ventricular space, enlarged subarachnoid spaces, and/or cisterna magna, periventricular leukomalacia, reduced corpus callosum, delayed myelination, and/or brain stem hypoplasia
b Gross visual artifacts and/or absence of an interpretable pattern, signal-to-noise ratio <10, and/or full width at half maximum >0.1 parts per million, mostly related to infant motion.
| Parameter | T-AGA (n = 23) | P-AGA (n = 15) | P-IUGR (n = 15) | Linear tendency ( P value) |
|---|---|---|---|---|
| Maternal demographic characteristics | ||||
| Maternal age, y | 33.1 ± 3.2 | 30.7 ± 4.3 | 32.4 ± 3.9 a | .289 b |
| Low maternal socioeconomic status, % c | 42.9 | 73.3 | 66.7 | .125 d |
| Maternal smoking, % e | 27.3 | 26.7 | 20.0 | .634 d |
| Perinatal data | ||||
| GA at birth, wks | 39.8 ± 1.4 | 30.5 ± 2.7 a | 31.4 ± 2.9 a | .000 f |
| Cesarean delivery, % | 26.3 | 40.0 | 66.7 a | .021 d |
| Instrumental vaginal delivery, % | 15.8 | 13.3 | 0.0 | .144 d |
| Gestational diabetes, % | 9.5 | 0.0 | 0.0 | .130 d |
| Birthweight, g | 3405.0 ± 364.9 | 1575.3 ± 531.6 a | 1330.5 ± 418.1 a | .000 b |
| Birthweight centile | 52.4 ± 29.9 | 35.6 ± 23.1 | 2.21 ± 3.1 a , g | .000 b |
| Sex (male), % | 52.2 | 73.3 | 46.7 | .876 d |
| Umbilical artery pH <7.10, % | 0.0 | 6.7 | 7.7 | .349 d |
| Apgar score at 5 min <7, % | 0.0 | 26.7 a | 46.7 a | .003 d |
| Length, cm | 50.0 ± 1.4 | 40.9 ± 3.2 a | 39.8 ± 4.7 a | .000 f |
| Length centile | 50.3 ± 22.5 | 61.0 ± 17.2 | 16.5 ± 9.1 a , g | .002 b |
| Cephalic perimeter, cm | 34.2 ± 0.8 | 28.4 ± 2.8 a | 27.9 ± 2.8 a | .000 b |
| Cephalic perimeter centile | 35.3 ± 20.7 | 49.7 ± 24.8 | 22.3 ± 19.4 g | .323 b |
| Admission to NICU, d | 0.1 ± 0.5 | 34.8 ± 19.4 a | 35.3 ± 27.3 a | .000 b |
| Neonatal complications, % h | 0.0 | 40.0 a | 20.0 a | .058 d |
| Infant parameters at 12 months | ||||
| Corrected age at MRI, wks | 56.6 ± 6.2 | 70.7 ± 8.3 a | 70.6 ± 6.7 a | .000 f |
| Weight, kg | 9.8 ± 1.1 | 8.9 ± 1.3 a | 8.4 ± 0.7 a | .007 f |
| Weight centile i | 41.2 ± 30.2 | 21.0 ± 26.5 a | 11.1 ± 12.6 a | .002 b |
| Height, m | 0.8 ± 0.0 | 0.7 ± 0.1 | 0.7 ± 0.0 a | .047 f |
| Height centile i | 50.2 ± 30.1 | 35.8 ± 38.3 | 14.9 ± 20.4 a | .021 b |
| Cephalic perimeter, cm | 46.2 ± 1.4 | 46.1 ± 1.4 | 45.4 ± 0.9 | .216 f |
| BMI, weight/height 2 , kg/m 2 | 17.4 ± 1.6 | 16.1 ± 1.2 a | 16.4 ± 1.1 | .034 b |
| Breast-feeding >4 mo, % | 50.0 | 38.5 | 33.3 | .372 d |
| BSID-III test at 24 mo | ||||
| Corrected age, mo | 24.2 ± 1.1 | 21.1 ± 2.8 a | 22.2 ± 2.3 a | .031 f |
| Cognitive score | 104.6 ± 9.8 | 96.9 ± 10.9 | 93.8 ± 9.8 a | .275 j |
| Language score | 110.3 ± 15.9 | 101.1 ± 16.2 | 98.7 ± 9.8 a | .766 j |
| Motor score | 107.7 ± 12.5 | 100.2 ± 11.5 | 98.9 ± 8.7 a | .506 j |
| Socioemotional score | 111.2 ± 22.4 | 104.4 ± 33.9 | 98.2 ± 23.6 | .912 j |
| Adaptive score | 103.9 ± 14.5 | 100.7 ± 19.1 | 106.7 ± 20.1 | .342 j |
| Average score | 108.1 ± 9.7 | 100.3 ± 13.9 | 100.2 ± 9.4 a | .706 j |
| Abnormal N.D., % k | 26.7 | 45.5 | 61.5 | .066 d |
c Maternal education less than high school
f Analysis of variance with polynomial contrast
g Compared with P-AGA (linear comparisons [ P < .05])
h Late-onset sepsis, enterocolitis, or severe respiratory distress syndrome
i Calculated as reported by others
j GLM with polynomial contrast, adjusted by gestational age at birth, sex, maternal breast-feeding longer than 4 months, low socioeconomic status, and corrected age at the BSID-III test
k Infants with at least 1 BSID-III area score <85 (independent sample comparisons [ p < .05]).
Brain structural and biophysical changes
The structural MRI parameters obtained ( Figure 1 ) showed some differences between 1 year old P-IUGR, P-AGA, and T-AGA infants ( Table 3 ). Regarding the volumetric analysis, P-IUGR infant brains were smaller compared with the P-AGA ( P = .043) and T-AGA groups ( P = .026), in agreement with their slightly decreased cranial cephalic perimeters at the same age ( Table 2 ). They also presented slightly lower frontal lobe GM volume percentage than T-AGA infants ( P = .005). Moreover, P-IUGR and P-AGA infants showed significantly increased CSF volumes compared with the T-AGA group, in agreement with increased brain MD. When assessing diffusivity within the MRS voxel volume, total MD, white matter MD (MD WM ), and MD along the fibers were significantly increased in the P-IUGR group compared with T-AGA. MD WM was also significantly higher in P-IUGR infants than in P-AGA infants ( P = .025).
| Parameter | T-AGA | P-AGA | P-IUGR | Linear tendency ( P value) |
|---|---|---|---|---|
| All brain | ||||
| Volume, ·10 5 mm 3 | 10.5 ± 0.6 | 10.5 ± 0.6 | 10.0 ± 0.7 a , b | .407 |
| WM, % | 21.3 ± 1.0 | 21.0 ± 1.2 | 20.8 ± 1.0 | .971 |
| GM, % | 68.7 ± 1.3 | 67.9 ± 1.1 a | 68.1 ± 1.1 | .905 |
| CSF, % | 10.0 ± 1.0 | 11.0 ± 0.9 a | 11.1 ± 1.7 a | .875 |
| FA, A.U. | 213.2 ± 12.5 | 210.4 ± 12.4 | 209.9 ± 10.6 | .427 |
| MD, ·10 –3 mm 2 /s | 117.6 ± 6.8 | 123.9 ± 5.7 a | 123.6 ± 9.8 a | .462 |
| Frontal lobe | ||||
| Volume, ·10 5 mm 3 | 1.7 ± 0.13 | 1.7 ± 0.1 | 1.6 ± 0.1 | .358 |
| WM, % | 11.4 ± 1.0 | 11.2 ± 1.2 | 10.9 ± 0.9 | .979 |
| GM, % | 80.8 ± 1.0 | 80.1 ± 1.2 | 79.8 ± 1.1 a | .420 |
| CSF, % | 4.8 ± 0.6 | 5.6 ± 0.6 a | 5.7 ± 1.4 a | .884 |
| FA, A.U. | 166.2 ± 17.3 | 159.0 ± 19.9 | 156.7 ± 27.2 | .068 |
| MD, ·10 –3 mm 2 /s | 99.1 ± 13.6 | 98.6 ± 14.9 | 98.6 ± 17.1 | .515 |
| MRS voxel | ||||
| Frontal Lobe, % | 76.0 ± 4.2 | 76.0 ± 4.2 | 76.2 ± 5.2 | .847 |
| WM, % | 33.7 ± 4.0 | 31.8 ± 4.0 | 32.4 ± 4.2 | .575 |
| GM, % | 62.0 ± 3.2 | 63.1 ± 3.1 | 62.2 ± 2.9 | .453 |
| CSF, % | 4.36 ± 1.2 | 5.2 ± 1.3 | 5.4 ± 1.9 | .424 |
| FA, A.U. | 183.9 ± 15.4 | 185.9 ± 11.0 | 178.6 ± 16.3 | .616 |
| MD, ·10 –3 mm 2 /s | 105.1 ± 5.5 | 108.0 ± 5.0 | 110.3 ± 8.4 a | .148 |
| MD WM , ·10 –3 mm 2 /s | 95.8 ± 3.4 | 96.6 ± 2.1 | 99.2 ± 3.1 a , b | .009 |
| MD GM , ·10 –3 mm 2 /s | 105.2 ± 5.8 | 106.5 ± 4.2 | 108.4 ± 7.6 | .292 |
| MD CSF , ·10 –3 mm 2 /s | 169.1 ± 24.6 | 192.8 ± 17.8 a | 187.7 ± 32.2 | .183 |
| FA WM , A.U. | 250.8 ± 26.2 | 255.4 ± 26.5 | 238.5 ± 26.4 | .434 |
| Fibers, ·10 3 | 2.46 ± 0.33 | 2.46 ± 0.36 | 2.72 ± 0.32 a | .022 |
| FA fibers , A.U. | 239.1 ± 14.4 | 240.2 ± 12.6 | 235.8 ± 16.8 | .925 |
| MD fibers , ·10 –3 mm 2 /s | 99.5 ± 4.1 | 100.7 ± 3.8 | 102.8 ± 4.4 a | .021 |
| INT, s/mm 2 | 2.94 ± 0.28 | 2.92 ± 0.27 | 2.79 ± 0.27 | .795 |
| DIR, A.U. | 550.0 ± 20.5 | 562.0 ± 37.6 | 575.4 ± 27.8 a | .779 |
b Compared with P-AGA. Linear comparisons are as follows: GLM with polynomial contrast, adjusted by gestational age at birth, sex, maternal breast-feeding longer than 4 months, low socioeconomic status, and corrected age at MRI.
Finally, tractography analysis of the fibers passing through the MRS voxel showed an increased number of streamlines and directionality in the P-IUGR group compared with T-AGA ( P = .037 and P = .006, respectively) and a similar tendency compared with P-AGA ( P = .073 and P = .331, respectively). When comparing the groups with a polynomial contrast adjusted for potential confounding factors, frontal lobe FA showed a tendency for linear change across the three clinical groups ( P = .068), and significant linear changes were observed for MD WM and the estimated number of streamlines within the MRS voxel ( P = .009 and P = .022, respectively) ( Table 3 ).
Brain metabolite changes
The frontal lobe MRS data ( Figure 2 A) showed no significant differences in spectral quality among the 3 groups ( Supplemental Table 1 ) and good quantification performance ( Supplemental Table 2 ). The brain metabolite differences detected between the 3 clinical groups are summarized in Table 4 .
| Metabolite | T-AGA | P-AGA | P-IUGR | Linear tendency ( P value) |
|---|---|---|---|---|
| NAA/Cr | 0.92 ± 0.11 | 1.01 ± 0.12 a | 0.88 ± 0.12 b | .016 |
| NAAt/Cr | 1.02 ± 0.13 | 1.13 ± 0.12 a | 1.01 ± 1.30 b | .011 |
| GSH/Cr | 0.33 ± 0.09 | 0.30 ± 0.07 | 0.25 ± 0.04 a | .496 |
| Cho/Cr | 0.25 ± 0.03 | 0.25 ± 0.04 | 0.23 ± 0.03 b | .134 |
| MI/Cho | 2.65 ± 0.99 | 2.41 ± 0.58 | 2.91 ± 0.57 b | .164 |
| (MI plus Gly)/Cho | 3.48 ± 0.69 | 3.15 ± 0.48 | 3.50 ± 0.34 b | .162 |
The relative levels of NAA (NAA/Cr, Figure 3 A; and NAAt/Cr, Figure 3 B) were significantly lower in P-IUGR infants compared with P-AGA but were significantly higher in P-AGA than in T-AGA infants. P-IUGR infants showed borderline significant decreases of: estimated glutathione (GSH/Cr, Figure 3 C), compared with either the T-AGA ( P = 0 047) or P-AGA ( P = .053) groups; and Cho/Cr ( Figure 3 D), compared with P-AGA infants ( P = .049) and less with T-AGA ( P = .093). Frontal lobe levels of the myoinositol to choline ratio (MI/Cho) were also a significant increase in P-IUGR infants compared with the P-AGA group ( Figure 3 E; [MI plus Gly]/Cr, Figure 3 F). When adjusting for confounding variables, the relative NAA levels (NAA/Cr and NAAt/Cr) showed a significant linear change across the three clinical groups ( Table 4 ).