Background
The use of in vitro fertilization that includes third-party in vitro fertilization is increasing. However, the relative contribution of third-party in vitro fertilization that includes the use of donor oocytes, sperm, or embryo and a gestational carrier to the birth cohort after in vitro fertilization is unknown.
Objective
The purpose of this study was to examine the contribution of third-party in vitro fertilization to the in vitro fertilization birth cohort over the past decade.
Study Design
This retrospective analysis investigated 1,349,874 in vitro fertilization cycles that resulted in 421,525 live births and 549,367 liveborn infants in the United States from 2004–2013. Cycles were self-reported by fertility centers to a national registry: Society for Assisted Reproductive Technologies Clinic Outcome Reporting System.
Results
Third-party in vitro fertilization accounted for 217,030 (16.1%) of all in vitro fertilization cycles, 86,063 (20.4%) of all live births, and 115,024 (20.9%) of all liveborn infants. Overall, 39.7% of third-party in vitro fertilization cycles resulted in a live birth, compared with 29.6% of autologous in vitro fertilization cycles. Use of third-party in vitro fertilization increased with maternal age and accounted for 42.2% of all in vitro fertilization cycles and 75.3% of all liveborn infants among women >40 years old. Oocyte donation was the most common third-party in vitro fertilization technique, followed by sperm donation. Over the study period, annual cycle volume and live birth rates gradually increased for both autologous in vitro fertilization and third-party in vitro fertilization ( P <.0001 for all). Live birth rates were the highest when multiple third-party in vitro fertilization modalities were used, followed by oocyte donation.
Conclusion
Third-party in vitro fertilization use and efficacy have increased over the past decade, now comprising >20% of the total in vitro fertilization birth cohort. In women who are >40 years old, third-party in vitro fertilization has become the dominant treatment.
With increasing delays in childbearing and rapid aging of patient populations in fertility centers, the use of in vitro fertilization (IVF) is increasing. Likewise, the use of third-party IVF (3IVF), which includes oocyte, sperm, and embryo donation, and the use of gestational carriers is increasing in the United States. Newborn infants who were conceived via all IVF, including 3IVF, now account for 1.6% of the general US birth cohort. The contribution of various 3IVF modalities to the birth cohort, however, has not been systematically studied.
Most IVF outcome studies have focused on cycles with autologous oocytes and partner semen. Others have examined pregnancy outcomes after oocyte donation but have not addressed other third-party modalities. Cycles that use gestational carriers have been increasing and appear to be associated with relatively high success rates.
Because gamete quality decreases in women and men with age and uterine and medical problems in general become more common, one would expect the demand for all 3IVF to increase. A recent report by Kawwass et al is supportive of this notion, demonstrating increased use of oocyte donation over the past decade. Their study noted that, in 2010, 18,306 donor oocyte cycles were performed, which accounted for approximately 12% of all IVF cycles. Because donor oocyte cycles lead to much higher pregnancy and delivery rates than autologous IVF cycles, births that result from oocyte donation are likely overrepresented relative to their prevalence within the IVF birth cohort. Similarly, pregnancies conceived via donor sperm, embryos, and gestational carriers are likely overrepresented within the IVF birth cohort because of higher pregnancy and live birth rates. The primary purpose of this investigation therefore was to assess the use of all 3IVF techniques and their contribution to the total IVF birth cohort over the past decade. Such a comprehensive overview is useful for patients and providers of reproductive medical services; it can also serve as a basis for the development of public health policy.
Materials and Methods
Our study was approved by the Institutional Review Board of the Center for Human Reproduction and by the Society for Assisted Reproductive Technology (SART) Research Committee before giving us access to its deidentified national data set.
To explore trends in 3IVF, we reviewed all US donor oocyte, sperm, embryo, and gestational carrier cycles that were reported to the Society for Assisted Reproductive Technologies Clinic Outcome Reporting System registry during 2004–2013. Cycles that involve third parties, but do not involve IVF, such as donor sperm intrauterine insemination, are not included in this registry. Data were collected and verified by SART and reported to the Centers for Disease Control and Prevention in compliance with the Fertility Clinic Success Rate and Certification Act of 1992 (Public Law 102-493). The data are self-reported to the SART Clinic Outcome Reporting System by fertility centers and represents >90% of all IVF cycles that are performed in the United States. Data are validated annually, with some IVF centers having on-site visits for chart review based on an algorithm for clinic selection. During each visit, data that were reported by the center were compared with information recorded in patients’ charts. Ten of 11 data fields that were selected for validation were found to have discrepancy rates of ≤5%.
Autologous IVF cycles, which did not use a third party, during the same time period served as a reference group. Any cycle that involved ≥1 3IVF modality qualified for the study. All initiated fresh and frozen/thawed IVF cycles were included in the analysis. Use of 3IVF modalities and cycle outcomes were stratified by age of the intended mother: <35, 35-37, 38-40, 41-42, and ≥43 years.
Outcomes of interest included live birth rates, number of liveborn infants, spontaneous abortion, and stillbirth rates for each age category. The SART definition of live birth is the birth of a fetus with signs of life, regardless of gestational age. The SART definition of stillbirth is the birth of a fetus with no signs of life at ≥18 weeks from the date of transfer. Spontaneous abortion is defined as a pregnancy that fails to develop normally and is spontaneously lost at <18 weeks from the date of transfer. Therapeutic abortion is defined as an operative procedure to terminate electively a viable pregnancy, regardless of gestational age.
A chi-square or Cochran–Mantel–Haenszel test was used for comparisons. A probability value of <.05 was considered significant. All analyses were conducted with SAS software (version 9.4; SAS Institute Inc, Cary, NC).
Results
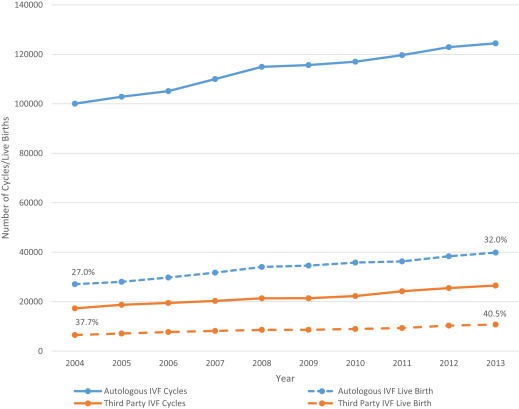
The data include a total of 1,349,874 IVF cycles that resulted in 421,525 live births and 549,367 liveborn infants: 3IVF accounted for 16.1% of all cycles, 20.4% of all live births, and 20.9% of liveborn infants ( Table 1 ). Overall, 39.7% of 3IVF cycles resulted in live birth vs 29.6% of autologous IVF cycles. Both 3IVF and autologous IVF cycle volume and live births gradually increased over the study period ( Figure 1 ). Specifically, 3IVF cycle volume increased by 53%; autologous IVF cycle volume increased by 24% over the study period. Live birth rates after 3IVF increased from 37.7% to 40.5%; those births with autologous IVF increased from 27.0% to 32.0% over the study period ( P <.0001 for both). Live birth rates were the highest in cycles that used multiple 3IVF modalities, followed by oocyte donation cycles ( Table 1 ).
| Variable | Cycles | Live Birth | Live Birth Rate | Infants |
|---|---|---|---|---|
| All in vitro fertilization, n | 1,349,874 | 421,525 | 31.2% | 549,367 |
| Autologous in vitro fertilization, % | 83.9 | 79.6 | 29.6 | 79.1 |
| All third-party in vitro fertilization, % | 16.1 | 20.4 | 39.7 | 20.9 |
| Oocyte donation, % | 10.4 | 14.1 | 42.3 | 14.5 |
| Sperm donation, % | 2.7 | 2.5 | 28.1 | 2.4 |
| Embryo donation, % | 0.6 | 0.6 | 34.1 | 0.6 |
| Gestational carrier, % | 0.9 | 1.0 | 33.2 | 1.0 |
| Multiple third-party in vitro fertilization, % | 1.5 | 2.3 | 48.0 | 2.5 |
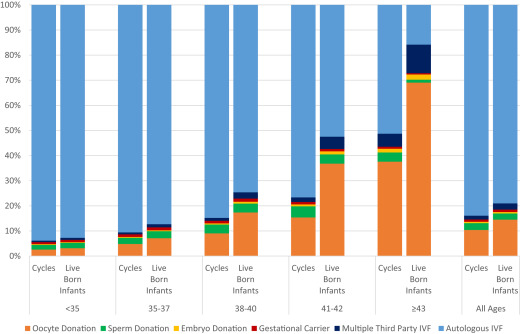
Use of 3IVF increased with advancing maternal age and was most common among women over age 40 years; 54.8% of all 3IVF cycles were performed in women over the age of 40 years ( Table 2 ). Moreover, among women over age 40 years, 42.2% of all IVF cycles used a third party. Because of higher live birth rates in association with 3IVF, these cycles accounted disproportionally for 75.3% of all liveborn infants among all women over age 40 years ( Figure 2 ).
| Maternal age group | Autologous in vitro fertilization | Oocyte donation | Sperm donation | Embryo donation | Gestational carrier | Multiple third-party in vitro fertilization |
|---|---|---|---|---|---|---|
| All ages | ||||||
| In vitro fertilization cycles, n | 1,132,844 | 140,197 | 36,696 | 7,478 | 12,275 | 20,384 |
| Diagnosis, % | ||||||
| Male infertility | 36.9 | 18.0 | 38.5 | 30.1 | 12.7 | 16.5 |
| Endometriosis | 11.6 | 6.6 | 7.1 | 10.3 | 6.2 | 3.7 |
| Ovulation disorder | 15.4 | 4.9 | 8.6 | 8.4 | 7.4 | 3.1 |
| Diminished ovarian reserve | 21.0 | 77.2 | 29.1 | 55.8 | 17.1 | 51.7 |
| Tubal factors | 17.1 | 8.2 | 8.5 | 9.6 | 7.4 | 4.3 |
| Uterine factors | 4.8 | 5.2 | 4.5 | 5.1 | 39.5 | 13.6 |
| Unexplained | 13.3 | 3.3 | 10.7 | 4.6 | 4.9 | 2.7 |
| Other | 13.5 | 17.2 | 25.4 | 20.5 | 40.9 | 44.1 |
| Patient race/ethnicity, % | ||||||
| Non-Hispanic white | 45.5 | 46.1 | 45.7 | 59.4 | 47.1 | 48.4 |
| Non-Hispanic black | 4.5 | 4.1 | 5.1 | 2.5 | 2.4 | 3.0 |
| Asian/Pacific Islander | 7.8 | 7.3 | 3.9 | 2.3 | 6.4 | 4.9 |
| Hispanic | 5.2 | 4.3 | 4.8 | 3.2 | 5.6 | 5.2 |
| Other | 6.8 | 7.1 | 9.7 | 6.1 | 9.6 | 8.3 |
| Unknown | 30.3 | 31.0 | 30.8 | 26.6 | 28.8 | 30.2 |
| Previous assisted reproductive technology procedures: ≥1, % | — a | 67.6 | 50.0 | 52.7 | 66.5 | 56.1 |
| Previous births: ≥1, % | — a | 35.0 | 16.7 | 31.4 | 35.9 | 28.2 |
| <35 Years | ||||||
| In vitro fertilization cycles, n | 489,276 | 13,501 | 9,763 | 1,511 | 4,178 | 3,103 |
| Diagnosis, % | ||||||
| Male infertility | 42.0 | 17.8 | 61.5 | 43.0 | 12.1 | 13.4 |
| Endometriosis | 13.5 | 10.7 | 8.4 | 12.8 | 6.3 | 2.3 |
| Ovulation disorder | 22.2 | 9.1 | 14.7 | 14.1 | 8.6 | 3.2 |
| Diminished ovarian reserve | 8.0 | 60.9 | 6.6 | 26.1 | 5.8 | 12.9 |
| Tubal factors | 16.7 | 6.8 | 8.2 | 9.7 | 6.9 | 3.8 |
| Uterine factors | 3.4 | 2.7 | 2.4 | 2.3 | 40.1 | 7.6 |
| Unexplained | 13.0 | 3.9 | 8.9 | 5.9 | 3.9 | 3.1 |
| Other | 11.3 | 25.4 | 18.3 | 21.8 | 47.1 | 73.6 |
| Patient race/ethnicity | ||||||
| Non-Hispanic white | 48.9 | 51.5 | 48.9 | 65.8 | 53.0 | 48.3 |
| Non-Hispanic black | 3.9 | 2.3 | 4.4 | 1.5 | 1.1 | 1.5 |
| Asian/Pacific Islander | 7.3 | 7.2 | 4.4 | 1.3 | 5.4 | 2.1 |
| Hispanic | 5.0 | 4.2 | 5.9 | 2.9 | 6.2 | 8.6 |
| Other | 6.2 | 7.1 | 9.1 | 4.5 | 8.3 | 9.8 |
| Unknown | 28.7 | 27.7 | 27.3 | 24.0 | 26.0 | 29.7 |
| Previous assisted reproductive technology procedures: ≥1, % | — a | 62.3 | 39.8 | 44.5 | 57.2 | 40.4 |
| Previous births: ≥1, % | — a | 22.4 | 17.3 | 26.2 | 30.8 | 40.2 |
| 35-37 Years | ||||||
| In vitro fertilization cycles, n | 257,097 | 13,721 | 6,857 | 1,015 | 2,972 | 2,196 |
| Diagnosis, % | ||||||
| Male infertility | 37.2 | 20.2 | 44.5 | 40.1 | 12.3 | 18.0 |
| Endometriosis | 12.7 | 11.8 | 8.9 | 17.2 | 7.5 | 5.2 |
| Ovulation disorder | 13.8 | 7.6 | 9.8 | 11.6 | 8.3 | 3.8 |
| Diminished ovarian reserve | 16.0 | 68.1 | 15.5 | 41.2 | 9.5 | 27.6 |
| Tubal factors | 19.1 | 9.3 | 9.7 | 12.9 | 8.8 | 4.5 |
| Uterine factors | 5.1 | 4.2 | 4.1 | 5.9 | 40.8 | 12.8 |
| Unexplained | 15.5 | 4.3 | 12.9 | 5.5 | 6.2 | 3.1 |
| Other | 12.9 | 17.5 | 25.1 | 21.7 | 40.5 | 56.7 |
| Patient race/ethnicity | ||||||
| Non-Hispanic white | 45.1 | 48.5 | 47.6 | 62.2 | 48.4 | 49.3 |
| Non-Hispanic black | 4.3 | 3.0 | 4.3 | 1.0 | 2.5 | 2.4 |
| Asian/Pacific Islander | 8.3 | 6.8 | 4.1 | 2.5 | 7.2 | 5.4 |
| Hispanic | 5.2 | 4.2 | 5.4 | 2.6 | 5.0 | 5.2 |
| Other | 6.7 | 7.4 | 8.6 | 6.8 | 9.2 | 7.9 |
| Unknown | 30.4 | 30.1 | 30.0 | 25.0 | 27.9 | 29.9 |
| Previous assisted reproductive technology procedures: ≥1, % | — a | 70.4 | 45.4 | 60.7 | 67.7 | 54.3 |
| Previous births: ≥1, % | — a | 27.7 | 22.7 | 26.9 | 39.5 | 28.1 |
| 38-40 Years | ||||||
| In vitro fertilization cycles, n | 223,219 | 23,830 | 9,168 | 1,278 | 2,720 | 3,049 |
| Diagnosis, % | ||||||
| Male infertility | 33.2 | 21.0 | 32.4 | 33.7 | 11.6 | 18.6 |
| Endometriosis | 10.0 | 9.1 | 6.9 | 12.4 | 6.2 | 5.1 |
| Ovulation disorder | 9.4 | 6.0 | 6.3 | 9.0 | 7.0 | 4.6 |
| Diminished ovarian reserve | 30.5 | 73.5 | 31.1 | 52.7 | 20.9 | 46.8 |
| Tubal factors | 18.0 | 9.8 | 9.3 | 11.0 | 7.2 | 4.5 |
| Uterine factors | 6.3 | 4.8 | 5.7 | 4.9 | 39.4 | 13.8 |
| Unexplained | 14.0 | 4.3 | 13.2 | 4.7 | 5.3 | 3.6 |
| Other | 15.7 | 16.1 | 28.0 | 20.3 | 38.9 | 45.1 |
| Patient race/ethnicity | ||||||
| Non-Hispanic white | 42.8 | 47.8 | 44.6 | 63.1 | 44.2 | 50.2 |
| Non-Hispanic black | 5.0 | 3.6 | 5.4 | 2.1 | 3.2 | 2.4 |
| Asian/Pacific Islander | 8.1 | 6.7 | 4.1 | 2.4 | 6.7 | 4.9 |
| Hispanic | 5.3 | 4.0 | 4.5 | 3.9 | 4.9 | 4.7 |
| Other | 7.2 | 7.2 | 9.5 | 6.2 | 9.8 | 7.6 |
| Unknown | 31.6 | 30.8 | 31.9 | 22.3 | 31.3 | 30.1 |
| Previous assisted reproductive technology procedures: ≥1, % | — a | 71.4 | 51.3 | 58.9 | 71.1 | 59.5 |
| Previous births: ≥1, % | — a | 31.3 | 20.9 | 32.4 | 37.9 | 22.7 |
| 41-42 Years | ||||||
| In vitro fertilization cycles, n | 100,990 | 24,338 | 6,186 | 1,170 | 1,309 | 2,880 |
| Diagnosis, % | ||||||
| Male infertility | 28.1 | 20.3 | 22.2 | 27.3 | 14.4 | 17.2 |
| Endometriosis | 7.0 | 6.5 | 5.6 | 10.3 | 4.1 | 4.7 |
| Ovulation disorder | 6.4 | 4.6 | 4.6 | 5.7 | 5.7 | 2.6 |
| Diminished ovarian reserve | 49.7 | 78.4 | 49.2 | 68.3 | 37.8 | 59.3 |
| Tubal factors | 15.0 | 9.5 | 7.8 | 9.9 | 7.6 | 4.5 |
| Uterine factors | 6.8 | 5.4 | 5.4 | 6.9 | 41.8 | 14.0 |
| Unexplained | 10.9 | 3.6 | 10.5 | 2.9 | 4.1 | 2.6 |
| Other | 17.7 | 16.1 | 29.4 | 20.8 | 32.7 | 38.9 |
| Patient race/ethnicity | ||||||
| Non-Hispanic white | 40.8 | 47.6 | 44.2 | 54.9 | 40.0 | 51.7 |
| Non-Hispanic black | 5.1 | 4.0 | 5.3 | 2.9 | 3.8 | 2.4 |
| Asian/Pacific Islander | 7.8 | 5.8 | 3.0 | 2.1 | 7.1 | 4.3 |
| Hispanic | 5.2 | 4.1 | 3.6 | 2.5 | 5.4 | 5.0 |
| Other | 8.1 | 7.3 | 10.0 | 6.9 | 11.1 | 7.7 |
| Unknown | 33.0 | 31.2 | 33.9 | 30.7 | 32.5 | 28.9 |
| Previous assisted reproductive technology procedures: ≥1, % | — a | 69.8 | 57.9 | 56.7 | 75.6 | 62.7 |
| Previous births: ≥1, % | — a | 33.6 | 18.8 | 30.3 | 38.4 | 22.7 |
| ≥43 Years | ||||||
| In vitro fertilization cycles, n | 62,262 | 64,807 | 4,722 | 2,504 | 1,096 | 9,156 |
| Diagnosis, % | ||||||
| Male infertility | 23.3 | 15.6 | 15.4 | 17.9 | 17.0 | 16.2 |
| Endometriosis | 4.8 | 3.7 | 4.1 | 4.8 | 4.1 | 3.0 |
| Ovulation disorder | 4.7 | 3.1 | 3.8 | 4.7 | 3.7 | 2.5 |
| Diminished ovarian reserve | 64.0 | 83.4 | 64.8 | 75.4 | 46.6 | 69.9 |
| Tubal factors | 12.3 | 7.1 | 6.8 | 7.3 | 5.8 | 4.2 |
| Uterine factors | 6.9 | 6.0 | 6.2 | 5.7 | 31.2 | 15.7 |
| Unexplained | 6.9 | 2.5 | 6.8 | 4.2 | 4.7 | 2.1 |
| Other | 18.3 | 16.2 | 30.0 | 19.3 | 33.0 | 32.3 |
| Patient race/ethnicity, % | ||||||
| Non-Hispanic white | 38.0 | 43.4 | 40.5 | 54.6 | 37.0 | 46.5 |
| Non-Hispanic black | 6.2 | 5.0 | 6.7 | 3.6 | 3.7 | 4.1 |
| Asian/Pacific Islander | 8.3 | 8.2 | 3.7 | 2.9 | 7.1 | 5.8 |
| Hispanic | 5.6 | 4.5 | 3.4 | 3.5 | 7.2 | 4.3 |
| Other | 8.8 | 7.0 | 12.5 | 6.3 | 13.1 | 8.4 |
| Unknown | 33.2 | 31.9 | 33.2 | 29.1 | 31.8 | 30.9 |
| Previous assisted reproductive technology procedures: ≥1, % | — a | 65.8 | 65.1 | 49.3 | 75.8 | 58.6 |
| Previous births: ≥1, % | — a | 41.1 | 19.1 | 36.2 | 37.9 | 27.8 |
a Indicates data fields that were not released by the Society for Assisted Reproductive Technology for this study.
Cycles that were cancelled before retrieval accounted for 10.4% of autologous IVF but only 5.3% of 3IVF cycles (oocyte donation, 6.3%; sperm donation, 2.0%; embryo donation, 6.5%; gestational carrier, 6.7%; multiple third party, 3.0%).
Table 2 provides additional details about patient characteristics; it is stratified by maternal age and IVF modality. Although in all age groups, most of the women who underwent 3IVF were nulliparous; their previous IVF procedures generally increased with maternal age. Although race/ethnicity were unreported for approximately 30% of patients, those who reported as non-Hispanic white women were most represented among 3IVF cycles; non-Hispanic black women were least represented.
Table 3 provides details about treatment characteristics for all 3IVF modalities. IVF was achieved with intracytoplasmic sperm injection in approximately 70% of cases, regardless of 3IVF modality. Most patients had replacement of 2 embryos across all 3IVF modalities; elective single embryo transfer was uncommon (<10% of cases). Most embryos were transferred at the cleavage rather than blastocyst stage. Preimplantation genetic diagnosis was seldom used for 3IVF (<6% of cases). Assisted zona hatching was performed in one-third to one-half of all cases, depending on 3IVF modality. Stratification of the data in Table 3 by maternal age did not alter any of these findings substantially.


