Background
A systematic survey of pelvic floor disorders in nulliparous women has not been presented previously.
Objective
The purpose of this study was to determine the prevalence of urinary incontinence parameters in a large cohort of nonpregnant, nulliparous women, and thereby construct a reference group for comparisons with parous women.
Study Design
This postal and World Wide Web–based questionnaire survey was conducted in 2014. The study population was identified from the Total Population Register in Sweden and comprised women who had not given birth and were aged 25-64 years. Four independent age-stratified, random samples comprising 20,000 women were obtained from the total number of eligible nullipara (n = 625,810). A 40-item questionnaire about pelvic floor symptoms, its severity, and its consequences were used. Age-dependent differences for various aspects of urinary incontinence were analyzed with the youngest group (25-34 years) serving as reference. Crude and body mass index–adjusted prevalence and its 95% confidence limits were calculated for each 10-year category.
Results
The response rate was 52% and the number of study participants was 9197. Urinary incontinence increased >5-fold from 9.7% in the youngest women with a body mass index <25 kg/m 2 to 48.4% among the oldest women with a body mass index ≥35 kg/m 2 . The prevalence of bothersome urinary incontinence almost tripled from 2.8-7.9% among all nulliparas. The proportion with bothersome urinary incontinence among incontinent women increased from 24.4% in the youngest age group to 32.3% in the age group 55-64 years. Nocturia ≥2/night increased 4-fold to 17.0% and leakage ≥1/wk increased 3-fold to 12.8% among the oldest women. Mixed urinary incontinence increased from 22.9-40.9% among the oldest 0-para with incontinence, whereas stress urinary incontinence decreased inversely from 43.6-33.0%. In the total cohort surgical treatment for urinary incontinence occurred in 3 per thousand.
Conclusion
Almost every aspect of urinary incontinence was present in nulliparous women of all ages and prevalence increased with advancing age between 25-64 years. This must be taken into account when using nullipara as a control group in comparisons with parous women to estimate the effect of pregnancy and childbirth.
Introduction
Pelvic floor disorders (PFDs) constitute a huge and costly women’s health problem, globally affecting millions of women throughout life. Yearly, millions of women undergo corrective surgery for these conditions at considerable expense and personal suffering. Compared with men, urinary incontinence (UI) in women has a different etiology, type, and severity. In women aged 15-55 years, UI occurs 5-6 times more often than in men. Even if childbirth is the most important causal factor, UI has been reported to occur in about 10-20% of nulliparous women up to the age of 45 years. This shows that the pelvic floor of nulliparous women is prone to dysfunction. Additional risk factors such as pregnancy, vaginal delivery, and obstetric events superimpose to further increase PFDs. Some studies have hypothetically attributed a dominant part of PFDs to the effect of pregnancy and factors unrelated to vaginal delivery, implicitly downplaying the permanent consequences of vaginal birth.
The current project (Swedish Pregnancy, Obesity, and Pelvic floor study in nulliparous women) was designed to address these controversial issues, which require a better understanding of the natural history of PFDs in 0-para women. To date the only study that presented data on UI prevalence for nulliparous women according to age (≥20 years) is the EPINCONT survey. However, in that study, the number of nulliparous women included in the various age groups decreased with advancing age. Thus, there were relatively small numbers of nulliparous women included in some of the age groups.
Only nonpregnant, nulliparous women obtained from a large, representative, national cohort covering an age span of 40 years were included. The primary aim was to describe the age-related prevalence of UI, its severity, subtypes, emotional impact, and health care consequences. A secondary aim was to create an appropriate control group for comparisons with parous women to be able to establish the additional costs of women’s reproductive burden, both in terms of pelvic floor health and economically.
Materials and Methods
Ethical approval for the study was obtained from the regional ethical review board (reference no. 776-13; Nov. 18, 2013). All women received written information and gave written consent before participation in the study.
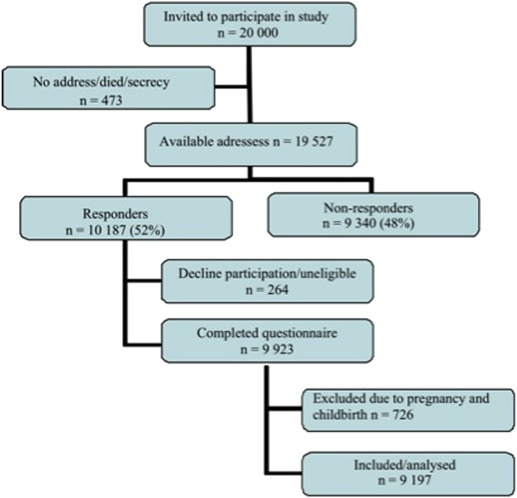
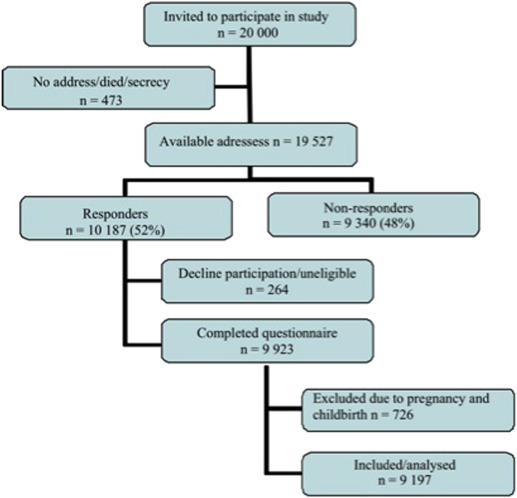
This national postal and World Wide Web–based questionnaire survey was conducted in 2014. The potential study population was identified by the Survey Division at the Central Bureau of Statistics from the Total Population Register and comprised women registered in Sweden who had not given birth and were 25-64 years of age. The lower limit of the age span was set to 25 years because studies of adolescent girls and young women indicate that the prevalence of UI seems to stabilize at a minimum during the third decade. The upper limit was set to 65 years because confounding age-dependent comorbidities potentially influence the prevalence of UI, which is known to increase rapidly from the seventh decade. A total of 20,000 women were randomly invited to participate in this study from the total number of eligible nullipara (n = 625,810). The 20,000 participants comprised 4 independent, random samples, stratified by decades of age, with oversampling of the 2 youngest age groups for a subsequent longitudinal follow-up. A letter about the study, which included log-in credentials to a World Wide Web form, was sent to all women, requesting them to give their written informed consent. The introductory letter was followed by postal questionnaires. The questionnaire (World Wide Web and postal versions) was returned by 10,187 women, after 3 mailing cycles during a 4-month period. The World Wide Web form was used by 52% of the women. The answers revealed that 194 women were pregnant, 525 were parous, and a further 264 declined participation or returned an unusable form. These women were excluded, plus another 7 due to missing information about parity. Misdiagnosis of parity was related to immigration (337/525). The final study population thus comprised 9197 women ( Figure 1 ).

The 40-item questionnaire included questions about current height and weight, UI or anal incontinence, genital prolapse, nocturia, urgency, and menstrual status (information about current pregnancy hysterectomy, menopausal status, and hormone treatment). Three separate validated questionnaires created by Sandvik et al, Tegerstedt et al, and Jorge and Wexner et al were combined into 1 questionnaire ( Appendix ). The proportion of missing data in responses to the questionnaire was low and varied between 0.3% for taking medication for UI (lowest) and 1.9% for sought doctor for UI (highest) in the cohort.
Any UI, subtypes of UI, and nocturia were defined according to the International Urogynecological Association/International Continence Society definition. Any UI was defined by the question “Do you have involuntary loss of urine?” Participants reporting UI were grouped according to the duration of UI (<5, 5-10, or >10 years). Stress UI (SUI) was defined as involuntary loss of urine in connection with coughing, sneezing, laughing, or lifting heavy items; urge UI (UUI) was present if loss of urine was in connection with a sudden and strong urge to void; and mixed UI (MUI) if both components were present. Other UI was affirmation of any UI but no information given about subtypes. Nocturia was defined as an interruption of sleep ≥1 times because of the need to urinate. Frequency of leakage was stratified into 4 categories: “Less than once a month,” “Once or more per month”, “Once or more per week” and “Every day and/or night.” The amount of leakage was categorized into “A few drops” vs “Small amounts” and “Large amounts.” The mental impact perceived by incontinent women was dichotomized into “A minor problem” (no problem/a small nuisance = not bothersome) and “Bothersome” UI (some bother/much bother/a major problem). Body mass index (BMI) (kg/m 2 ) was calculated from weight and height given in the questionnaire and was categorized as normal weight (<25.0), overweight (25.0-29.9), moderately obese (30.0-34.9), and severely obese (≥35.0). Women were also asked whether they had consulted a doctor for UI, were on medication or had undergone surgery for UI, or had undergone a hysterectomy.
Characteristics of responders and nonresponders
A comparison between responders and nonresponders was performed using information from the Total Population Register, available for 99.9% of the total sample. Nonresponders were younger (56.7% of the age group 25-29 years vs 37.3% of the age group 60-64 years), more often immigrants (63.7% vs 46.0% of Swedish born) and non-Swedish citizens (67.8% vs 32.2% of responders), more often unmarried (51.2% vs 45.3% of responders), lived in suburban or commuting municipalities (53.7% vs 46.3%), and had a lower income and lower level of education (postsecondary education >3 years in 40.9% vs 59.1%).
Statistical analysis
Statistical analyses were performed using software (SPSS Statistics 22; IBM Corp, Armonk, NY). Crude and adjusted prevalence and proportion and 95% confidence intervals for all outcomes were calculated for each 10-year category. Adjusted prevalence and odds ratio were calculated from the logistic regression model, taking age and BMI into account. Age- and BMI-dependent differences for various aspects of UI were analyzed with the youngest group (25-34 years) and normal BMI (<25) as reference. The degree of correlation between UI and age was analyzed using Pearson correlation coefficient (r).
Materials and Methods
Ethical approval for the study was obtained from the regional ethical review board (reference no. 776-13; Nov. 18, 2013). All women received written information and gave written consent before participation in the study.
This national postal and World Wide Web–based questionnaire survey was conducted in 2014. The potential study population was identified by the Survey Division at the Central Bureau of Statistics from the Total Population Register and comprised women registered in Sweden who had not given birth and were 25-64 years of age. The lower limit of the age span was set to 25 years because studies of adolescent girls and young women indicate that the prevalence of UI seems to stabilize at a minimum during the third decade. The upper limit was set to 65 years because confounding age-dependent comorbidities potentially influence the prevalence of UI, which is known to increase rapidly from the seventh decade. A total of 20,000 women were randomly invited to participate in this study from the total number of eligible nullipara (n = 625,810). The 20,000 participants comprised 4 independent, random samples, stratified by decades of age, with oversampling of the 2 youngest age groups for a subsequent longitudinal follow-up. A letter about the study, which included log-in credentials to a World Wide Web form, was sent to all women, requesting them to give their written informed consent. The introductory letter was followed by postal questionnaires. The questionnaire (World Wide Web and postal versions) was returned by 10,187 women, after 3 mailing cycles during a 4-month period. The World Wide Web form was used by 52% of the women. The answers revealed that 194 women were pregnant, 525 were parous, and a further 264 declined participation or returned an unusable form. These women were excluded, plus another 7 due to missing information about parity. Misdiagnosis of parity was related to immigration (337/525). The final study population thus comprised 9197 women ( Figure 1 ).

The 40-item questionnaire included questions about current height and weight, UI or anal incontinence, genital prolapse, nocturia, urgency, and menstrual status (information about current pregnancy hysterectomy, menopausal status, and hormone treatment). Three separate validated questionnaires created by Sandvik et al, Tegerstedt et al, and Jorge and Wexner et al were combined into 1 questionnaire ( Appendix ). The proportion of missing data in responses to the questionnaire was low and varied between 0.3% for taking medication for UI (lowest) and 1.9% for sought doctor for UI (highest) in the cohort.
Any UI, subtypes of UI, and nocturia were defined according to the International Urogynecological Association/International Continence Society definition. Any UI was defined by the question “Do you have involuntary loss of urine?” Participants reporting UI were grouped according to the duration of UI (<5, 5-10, or >10 years). Stress UI (SUI) was defined as involuntary loss of urine in connection with coughing, sneezing, laughing, or lifting heavy items; urge UI (UUI) was present if loss of urine was in connection with a sudden and strong urge to void; and mixed UI (MUI) if both components were present. Other UI was affirmation of any UI but no information given about subtypes. Nocturia was defined as an interruption of sleep ≥1 times because of the need to urinate. Frequency of leakage was stratified into 4 categories: “Less than once a month,” “Once or more per month”, “Once or more per week” and “Every day and/or night.” The amount of leakage was categorized into “A few drops” vs “Small amounts” and “Large amounts.” The mental impact perceived by incontinent women was dichotomized into “A minor problem” (no problem/a small nuisance = not bothersome) and “Bothersome” UI (some bother/much bother/a major problem). Body mass index (BMI) (kg/m 2 ) was calculated from weight and height given in the questionnaire and was categorized as normal weight (<25.0), overweight (25.0-29.9), moderately obese (30.0-34.9), and severely obese (≥35.0). Women were also asked whether they had consulted a doctor for UI, were on medication or had undergone surgery for UI, or had undergone a hysterectomy.
Characteristics of responders and nonresponders
A comparison between responders and nonresponders was performed using information from the Total Population Register, available for 99.9% of the total sample. Nonresponders were younger (56.7% of the age group 25-29 years vs 37.3% of the age group 60-64 years), more often immigrants (63.7% vs 46.0% of Swedish born) and non-Swedish citizens (67.8% vs 32.2% of responders), more often unmarried (51.2% vs 45.3% of responders), lived in suburban or commuting municipalities (53.7% vs 46.3%), and had a lower income and lower level of education (postsecondary education >3 years in 40.9% vs 59.1%).
Statistical analysis
Statistical analyses were performed using software (SPSS Statistics 22; IBM Corp, Armonk, NY). Crude and adjusted prevalence and proportion and 95% confidence intervals for all outcomes were calculated for each 10-year category. Adjusted prevalence and odds ratio were calculated from the logistic regression model, taking age and BMI into account. Age- and BMI-dependent differences for various aspects of UI were analyzed with the youngest group (25-34 years) and normal BMI (<25) as reference. The degree of correlation between UI and age was analyzed using Pearson correlation coefficient (r).
Results
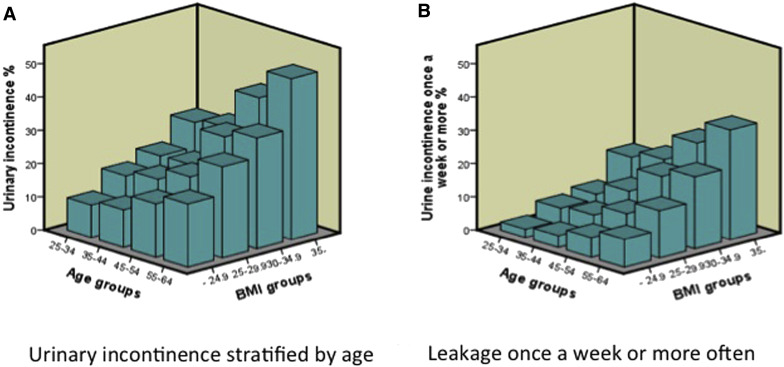
The response rate was 52.2%: lowest (44.7%) in the youngest age group (25-34 years) and increasing consistently to 62.4% among the oldest (55-64 years). Cohort characteristics are displayed in Table 1 . Weight and BMI plateaued after 45 years of age. The crude prevalence increased linearly from 11.7% in the youngest to 24.9% in the oldest group. The correlation between age and UI was highly significant for linearity (r = 0.86). The combined effect of age and BMI was substantial. UI increased 5-fold from 9.7% in the youngest women with normal BMI (<25) to 48.4% among the oldest women with a BMI ≥35 ( Figure 2 , A). Similarly, leakage ≥1/wk increased almost 14-fold from 2.4-33.0% ( Figure 2 , B). Bothersome UI almost tripled from 2.8-7.9% ( Table 2 ) and its proportion among incontinent women increased from every fourth to every third woman (24.4-32.3%) ( Table 3 ). Number of daytime micturitions was similar across ages. Nocturia ≥2/night increased 4-fold to 17.0% and leakage ≥1/wk 3-fold to 12.8% among the oldest women. Similarly, the prevalence of leakage of more than a few drops increased 3-fold to 9.6% ( Table 2 ). The proportion among subtypes of UI changed over time. MUI increased from 22.9-40.9% in the oldest group, whereas SUI decreased inversely from 43.6-33.0%. MUI and bothersome UI had the strongest association to both BMI and age. UUI was associated with age but not with BMI, whereas SUI had a stronger association with BMI than with age ( Table 4 ). In the total cohort, surgical treatment for UI occurred in 0.3%, medical treatment in 0.3%, and 1.8% had sought doctor for UI ( Table 2 ).
| Cohort characteristics | 25–34 y n = 3329 Mean/% (95% CI) | 35–44 y n = 2613 Mean/% (95% CI) | 45–54 y n = 1545 Mean/% (95% CI) | 55–64 y n = 1710 Mean/% (95% CI) | 25–64 y n = 9197 Mean/% (95% CI) |
|---|---|---|---|---|---|
| Response rate | 44.7% | 47.4% | 54.8% | 62.4% | 52.2% |
| Mean age, y | 28.6 (28.5–28.7) | 39.1 (39.0–39.2) | 49.5 (49.4–49.7) | 59.4 (59.2–59.5) | 40.8 (40.6–41.1) |
| Weight, kg | 65.9 (65.4–66.3) | 70.3 (69.6–70.9) | 72.9 (72.1–73.8) | 71.0 (70.3–71.7) | 69.3 (68.9–69.6) |
| Height, cm | 167.5 (167.2–167.7) | 166.8 (166.5–167.1) | 166.8 (166.5–167.1) | 165.8 (165.5–166.1) | 166.9 (166.7–167.0) |
| BMI, kg/m 2 | 23.5 (23.3–23.6) | 25.2 (25.0–25.4) | 26.2 (25.9–26.5) | 25.8 (25.6–26.1) | 24.9 (24.7–25.0) |
| BMI ≥30, kg/m 2 | 8.2% (7.2–9.1) | 15.7% (14.3–17.1) | 20.4% (18.4–22.4) | 17.2% (15.4–19.1) | 14.1% (13.3–14.8) |
| Hysterectomy | 0.1% (0.0–0.1) | 1.6% (1.1–2.1) | 6.7% (5.4–7.9) | 12.3% (10.8–13.9) | 3.9% (3.5–4.3) |
| Postmenopausal | 0.1% (0.0–0.2) | 0.9% (0.6–1.3) | 27.8% (25.5–30.0) | 65.5% (63.2–67.8) | 17.1% (16.4–17.9) |
| Estrogen treatment | 1.1% (0.7–1.4) | 1.4% (0.9–1.8) | 2.1% (1.4–2.9) | 4.1% (3.2–5.0) | 1.9% (1.6–2.2) |


