Introduction
Preeclampsia (PE) and fetal growth restriction (FGR) are important causes of perinatal death and handicap in survivors. PE is responsible for >70,000 maternal deaths each year around the world. Additionally, PE is associated with increased long-term risk for development of cardiovascular disease in both the mother and her infant.
Several studies examined the possibility that prophylactic use of low-dose aspirin in women at high risk of developing PE could reduce the prevalence of the disease. Meta-analyses of randomized controlled trials (RCTs) of aspirin vs placebo or no treatment showed that the prevalence of PE and FGR can be reduced by aspirin started at ≤16 weeks’ gestation and the effect is most marked for severe PE leading to delivery at <34 weeks’ gestation; aspirin started at >16 weeks had no significant effect on the prevalence of severe PE or FGR. Consequently, several national societies are now recommending that women identified as being at high risk for PE should receive low-dose aspirin starting from <16 weeks’ gestation. The recommended dose of aspirin varies between 60-150 mg daily but the optimal dose remains unclear. Observational studies suggested that 60-80 mg could be insufficient in some women and that 100-160 mg may be necessary to optimize prevention of PE.
The objective of this study is to evaluate the dose-response effect of aspirin for the prevention of PE and FGR.
Materials and Methods
We performed a systematic review and meta-analysis of RCTs that evaluated the impact of aspirin during pregnancy. Relevant trials were identified through a search of Embase, MEDLINE, the Cochrane Central Register of Controlled Trials, and the Web of Science databases including studies reported from January 1985 through December 2015. We used a combination of key words and Medical Subject Headings terms: “aspirin,” “antiplatelet,” “acetylsalicylic acid,” “ASA,” “pregnancy-complication,” “pregnancy,” “preeclampsia,” “pre-eclampsia,” “hypertension,” “blood pressure,” “eclampsia,” “PIH,” and “toxemia.” No language restriction was imposed. A first reviewer selected all the citations requiring a detailed evaluation. Two independent reviewers selected relevant abstracts and citations for complete evaluation. References of other systematic reviews were also searched for additional studies. In case of missing data in a relevant article, the corresponding and/or the primary authors were contacted for additional information (outcomes and data stratified according to gestational age at randomization). The quality of this review was validated with the preferred reporting items for systematic reviews and meta-analyses tool.
Trials involving pregnant women randomized to either aspirin with or without dipyridamole or to placebo or no treatment were included. Studies using other treatment, other study design, using the same population, or in which relevant data could not be extracted were excluded. Studies were stratified by gestational age at entry based on previous publications (≤16 vs >16 weeks’ gestation). The quality of studies was evaluated using the Cochrane handbook criteria for judging risk of bias and a sensitivity analysis was performed to evaluate the effect excluding: (1) studies at high risk of bias; (2) studies with low risk of PE (<7% prevalence in control group); and (3) excluding studies using dipyridamole.
Outcomes of interest included PE, usually defined as a systolic blood pressure ≥140 mm Hg or diastolic blood pressure ≥90 mm Hg that occurs >20 weeks’ gestation in combination with proteinuria, defined as urinary excretion ≥300 mg protein in a 24-hour urine specimen or ≥1+ protein on dipstick. Secondary outcomes included severe PE (any definition) and FGR, defined as birthweight <10th or <5th percentile for gestational age or similar definition.
Relative risks (RR) were calculated for each study and pooled for global analysis using DerSimonnian and Laird random effect to take into account variability and heterogeneity between studies. Heterogeneity between studies was calculated using Higgins I 2 and considered high if ≥50%. Random-effects meta-regression, weighted by the size of the studies, was performed to evaluate the dose-response effect of aspirin. An adjusted R 2 (considering the degree of freedom) coefficient and its P value were reported for each outcome. The adjusted R 2 represents the proportion of the variance in the dependent variable (in this case, the RR of the disease) that is predictable from the independent variable (dose of aspirin). An adjusted R 2 of 0% or a negative value (reported as 0%) indicates that the variance around the mean cannot be explained by the aspirin dose, while an adjusted R 2 of 100% indicates that the dose of aspirin could explain the entire variability between the studies. Publication bias was evaluated using funnel plots and symmetry using Egger test, for which a P value <.1 was considered asymmetrical.
Statistical analysis was performed using Review Manager 5.0.25 software (Nordic Cochrane Center, Cochrane Collaboration, Copenhagen, Denmark), Stata release 14.0 (StataCorp, College Station, TX), and SAS 9.2 software (SAS Institute Inc, Cary, NC).
Results
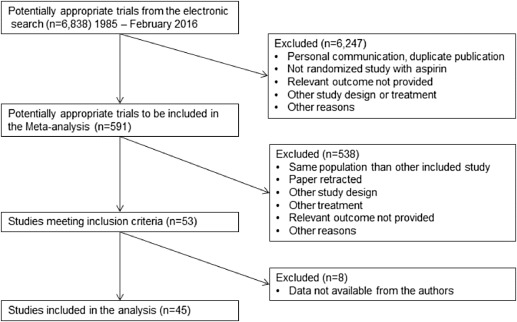
The literature search identified 6838 potential citations including 53 studies that met the inclusion criteria. Data stratified according to gestational age were available for 45 studies that enrolled 20,909 participants ( Figure 1 ). The characteristics of each study are reported in Table 1 .
| Study | N | Inclusion criteria | Intervention | ||
|---|---|---|---|---|---|
| ≤16 wk | Aspirin | Controls | Onset, wk | ||
| Tulppala et al, 1997 | 66 | Previous consecutive miscarriage | 50 mg | Placebo | <7 |
| Benigni et al, 1989 | 33 | History risk factors a | 60 mg | Placebo | 12 |
| b Caritis et al, 1998 | 652 | History risk factor a | 60 mg | Placebo | 13–16 |
| b Sibai et al, 1993 | 644 | Nulliparity | 60 mg | Placebo | 13–16 |
| b Golding, 1998 | 1997 | Nulliparity | 60 mg | Placebo | 12–16 |
| b Ebrashy et al, 2005 | 136 | Abnormal uterine artery Doppler plus history risk factors a | 75 mg | No treatment | 14–16 |
| Zhao et al, 2012 | 237 | History risk factor a | 75 mg | Placebo | 13–16 |
| Odibo et al, 2015 | 30 | History risk factor a | 80 mg | Placebo | 11–13 |
| Porreco et al, 1993 | 90 | Nulliparity + multiple gestation | 80 mg | Placebo | <16 |
| Jamal et al, 2012 | 70 | Diagnose PCOS before pregnancy, 18–40 y, singleton, no history of diabetes or HTN | 80 mg | No treatment | 6–12 |
| Mesdaghinia et al, 2011 | 80 | Abnormal uterine artery Doppler | 80 mg | No treatment | 12–16 |
| August et al, 1994 | 54 | History risk factors a | 100 mg | Placebo | 13–15 |
| Azar and Turpin, 1990 | 91 | History risk factors a | 100 mg c | No treatment | 16 |
| Bakhti and Vaiman, 2011 | 84 | Nulliparity | 100 mg | No treatment | 8–10 |
| Chiaffarino et al, 2004 | 35 | Chronic HTN with or without history risk factors a | 100 mg | No treatment | <14 |
| Dasari et al, 1998 | 50 | Nulliparity | 100 mg | Placebo | 12 |
| Hermida et al, 1997 | 107 | History risk factors a | 100 mg | Placebo | 12–16 |
| Ayala et al, 2013 | 350 | History risk factors a | 100 mg | Placebo | 12–16 |
| Michael et al, 1992 | 110 | HTN with history risk factors a | 100 mg | Placebo | <16 |
| b Villa et al, 2013 | 121 | Abnormal uterine artery Doppler and history risk factors a | 100 mg | Placebo | 13–14 |
| Beaufils et al, 1985 | 93 | History risk factors a | 150 mg c | No treatment | 14 |
| >16 wk | |||||
| Zimmermann et al, 1997 | 26 | Abnormal uterine artery Doppler | 50 mg | No treatment | 22–24 |
| b Caritis et al, 1998 | 1851 | History risk factor a | 60 mg | Placebo | 17–26 |
| CLASP, 1994 | 2492 | History risk factors a | 60 mg | Placebo | 20–32 |
| ECPPA, 1996 | 606 | History risk factors a | 60 mg | Placebo | 20–32 |
| Ferrier et al, 1996 | 43 | Nulliparity with abnormal umbilical artery Doppler | 60 mg | Placebo | 22–24 |
| b Golding, 1998 | 4292 | Nulliparity | 60 mg | Placebo | 20–32 |
| Hauth et al, 1993 | 606 | Nulliparity | 60 mg | Placebo | 24 |
| b Sibai et al, 1993 | 2340 | Nulliparity | 60 mg | Placebo | 17–25 |
| Kim et al, 1997 | 70 | History risk factors a | 60 mg | No treatment | 20–24 |
| Wallenburg et al, 1986 | 46 | Nulliparity with positive angiotensin II sensitivity test | 60 mg | Placebo | 28 |
| Wallenburg et al, 1991 | 36 | Nulliparity with positive angiotensin II sensitivity test | 60 mg | Placebo | 28–34 |
| Byaruhanga et al, 1998 | 230 | History of PE, or chronic HTN | 75 mg | Placebo | 20–28 |
| Davies et al, 1995 | 118 | Nulliparity | 75 mg | Placebo | 18 |
| McParland et al, 1990 | 100 | Nulliparity with abnormal uterine artery Doppler | 75 mg | Placebo | 24 |
| Rotchell et al, 1998 | 1485 | All pregnant women | 75 mg | Placebo | 20–32 |
| Wang and Li, 1996 | 84 | History risk factors a | 75 mg | Placebo | 28–34 |
| Rogers 1999 | 193 | Normotensive, primigravid with MAP ≥80 mm Hg and <106 mm Hg early in second trimester and MAP >60 mm Hg | 80 mg | Unclear | 22 |
| Schrocksnadel et al, 1992 | 41 | Nulliparity with positive roll-over test | 80 mg | Placebo | 28–32 |
| Grab et al, 2000 | 43 | Singleton with history risk factor | 100 mg | Placebo | 20 |
| Omrani et al, 1992 | 40 | History risk factors a with positive roll-over test | 100 mg | Placebo | 28–30 |
| Gallery et al, 1997 | 120 | History risk factors a | 100 mg | Placebo | 17–19 |
| McCowan et al, 1999 | 99 | FGR with abnormal umbilical artery Doppler | 100 mg | Placebo | 24–36 |
| Morris et al, 1996 | 102 | Nulliparity with abnormal umbilical artery Doppler | 100 mg | Placebo | 17–19 |
| Newnham et al, 1995 | 51 | IUGR and abnormal umbilical artery Doppler | 100 mg | Placebo | 28–36 |
| Schiff et al, 1989 | 65 | History risk factors a with positive roll-over test | 100 mg | Placebo | 28–29 |
| Trudinger et al, 1988 | 46 | Abnormal umbilical artery Doppler | 150 mg | Placebo | 28–36 |
| Yu et al, 2003 | 554 | Abnormal uterine artery Doppler | 150 mg | Placebo | 22–24 |
a Includes history of chronic HTN, cardiovascular or endocrine disease, pregnancy HTN, or fetal growth restriction
b Studies provided additional information on request
Aspirin initiated at ≤16 weeks’ gestation
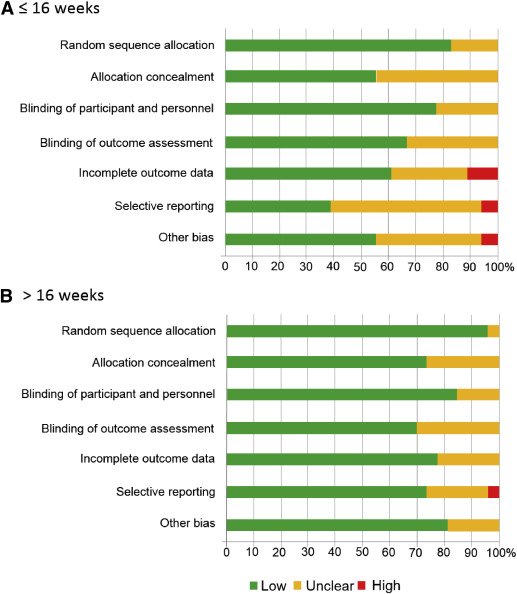
Data for 5130 participants randomized at ≤16 weeks’ gestation were available from 21 studies. The dose of aspirin varied between 50-150 mg daily, including 2 studies that combined 300 mg of dipyridamole with aspirin. In 7 RCTs, a placebo was not used and participants allocated to the control group received no treatment. The risk of bias tool described most studies as being at low or unclear risk of bias ( Figure 2 , A).
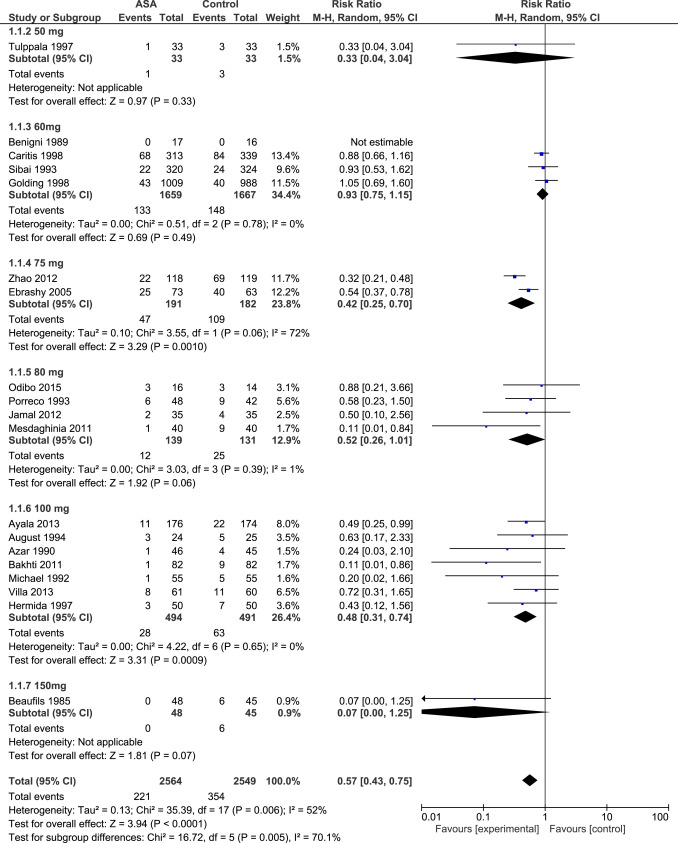
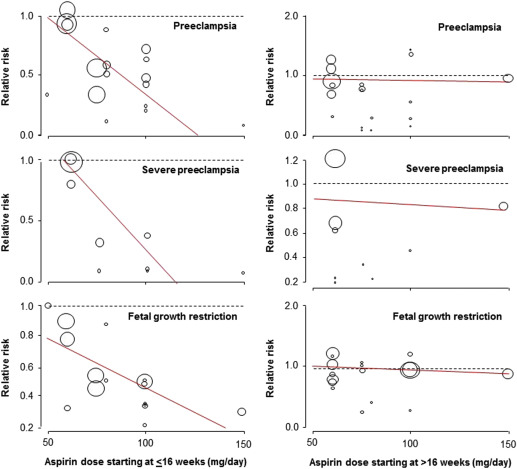
Aspirin was associated with a significant reduction in the prevalence of PE, severe PE, and FGR with a significant dose-response relationship ( Figure 3 , Table 2 , Supplemental Figures 1 , 2 , and 3 ). As a secondary analysis, we compared the 2 most studied dosages (60 mg daily: 4 RCTs, n = 3326; and 100 mg daily: 7 RCTs, n = 985); aspirin 100 mg vs 60 mg was significantly more effective in reduction of PE (RR, 0.48; 95% confidence interval [CI], 0.31–0.74 vs RR, 0.93; 95% CI, 0.75–1.15; P < .001); severe PE (RR, 0.24; 95% CI, 0.09–0.65 vs RR, 0.96; 95% CI, 0.71–1.28; P = .002), and FGR (RR, 0.45; 95% CI, 0.28–0.71 vs RR, 0.78; 95% CI, 0.53–1.16; P = .006).
| Outcome ≤16 wk | No. of trials | No. of participants | Relative risk (95% confidence interval) random effect | P value | I 2 | Dose-response correlation | |
|---|---|---|---|---|---|---|---|
| Adjusted R 2 | P value | ||||||
| Preeclampsia | |||||||
| 50 mg | 1 | 66 | 0.33 (0.04–3.04) | .33 | n/a | 44% | .036 |
| 60 mg | 4 | 3326 | 0.93 (0.75–1.15) | .49 | 0% | ||
| 75 mg | 2 | 373 | 0.42 (0.25–0.70) | .001 | 72% | ||
| 80 mg | 4 | 270 | 0.52 (0.26–1.01) | .06 | 1% | ||
| 100 mg | 7 | 985 | 0.48 (0.31–0.74) | .0009 | 0% | ||
| 150 mg | 1 | 93 | 0.07 (0.00–1.25) | .07 | n/a | ||
| Total | 19 | 5113 | 0.57 (0.43–0.75) | <.001 | 52% | ||
| Severe preeclampsia | |||||||
| 60 mg | 3 | 3279 | 0.96 (0.71–1.28) | .77 | 0% | 100% | .008 |
| 75 mg | 2 | 373 | 0.24 (0.09–0.65) | .005 | 9% | ||
| 100 mg | 3 | 334 | 0.23 (0.08–0.64) | .005 | 0% | ||
| 150 mg | 1 | 93 | 0.07 (0.00–1.25) | .07 | n/a | ||
| Total | 9 | 4079 | 0.47 (0.26–0.83) | .009 | 60% | ||
| Fetal growth restriction | |||||||
| 50 mg | 1 | 46 | 1.00 (0.22–4.45) | 1.00 | n/a | 100% | .044 |
| 60 mg | 3 | 1378 | 0.78 (0.53–1.16) | .22 | 0% | ||
| 75 mg | 2 | 373 | 0.48 (0.32–0.72) | .0004 | 0% | ||
| 80 mg | 3 | 180 | 0.64 (0.11–3.74) | .62 | 0% | ||
| 100 mg | 7 | 869 | 0.45 (0.28–0.71) | .0007 | 0% | ||
| 150 mg | 1 | 93 | 0.29 (0.10–0.82) | .02 | n/a | ||
| Total | 17 | 2939 | 0.56 (0.44–0.70) | <.001 | 0% | ||
Sensitivity analysis revealed a similar dose-response relationship of aspirin initiated at ≤16 weeks for the prevention of PE in high-quality studies (15 studies, R 2 , 100%; P = .004), but the association was marginally significant in the subgroup of studies that did not used dipyridamole (16 studies, R 2 , 41%; P = .06) and in the subgroup of studies that included high-risk populations (defined as a rate of PE >7% in the control group; 17 studies, R 2 , 36%; P = .06). The number of studies that randomized women at low risk of PE was too low to evaluate the dose-response effect.
Aspirin initiated at >16 weeks’ gestation
Data for 15,779 participants randomized at >16 weeks’ gestation were available from 27 studies. The dose of aspirin varied between 50-150 mg daily. In 2 RCTs, a placebo was not used and participants allocated to the control group received no treatment. The risk of bias tool described most studies as being at low or unclear risk of bias ( Figure 2 , B).
Aspirin started at >16 weeks was associated with a significant reduction in the prevalence of PE, but there was no dose-response relationship and there was no significant effect on the prevalence of severe PE or FGR ( Table 3 , Supplemental Figures 4 , 5 , and 6 ).
| Outcome >16 wk | No. of trials | No. of participants | Relative risk (95% confidence interval) random effect | P value | I 2 | Dose response | |
|---|---|---|---|---|---|---|---|
| Adjusted R 2 | P value | ||||||
| Preeclampsia | |||||||
| 50 mg | 1 | 26 | 2.00 (0.44–9.08) | .37 | n/a | 0% | .941 |
| 60 mg | 8 | 12,274 | 0.88 (0.68–1.12) | .30 | 57% | ||
| 75 mg | 4 | 1933 | 0.69 (0.42–1.15) | .16 | 20% | ||
| 80 mg | 2 | 234 | 0.21 (0.06–0.70) | .01 | 0% | ||
| 100 mg | 5 | 349 | 0.61 (0.26–1.44) | .26 | 52% | ||
| 150 mg | 1 | 554 | 0.95 (0.67–1.35) | .77 | n/a | ||
| Total | 21 | 15,370 | 0.81 (0.66–0.99) | .04 | 48% | ||
| Severe preeclampsia | |||||||
| 60 mg | 6 | 9358 | 0.87 (0.60–1.25) | .45 | 58% | 0% | .838 |
| 75 mg | 1 | 118 | 0.34 (0.01–8.29) | .51 | n/a | ||
| 80 mg | 1 | 41 | 0.17 (0.01–3.41) | .25 | n/a | ||
| 100 mg | 1 | 65 | 0.46 (0.04–4.78) | .51 | n/a | ||
| 150 mg | 1 | 554 | 0.82 (0.44–1.51) | .52 | n/a | ||
| Total | 10 | 10,136 | 0.85 (0.64–1.14) | .28 | 37% | ||
| Fetal growth restriction | |||||||
| 50 mg | 1 | 26 | 2.00 (0.21–19.44) | .55 | n/a | n/a | .563 |
| 60 mg | 7 | 7438 | 0.96 (0.78–1.17) | .67 | 13% | ||
| 75 mg | 4 | 538 | 0.82 (0.49–1.38) | .46 | 26% | ||
| 80 mg | 1 | 41 | 0.43 (0.04–4.40) | .48 | n/a | ||
| 100 mg | 4 | 325 | 0.96 (0.84–1.11) | .59 | 0% | ||
| 150 mg | 1 | 554 | 0.90 (0.67–1.22) | .51 | n/a | ||
| Total | 18 | 8922 | 0.95 (0.86–1.05) | .34 | 0% | ||
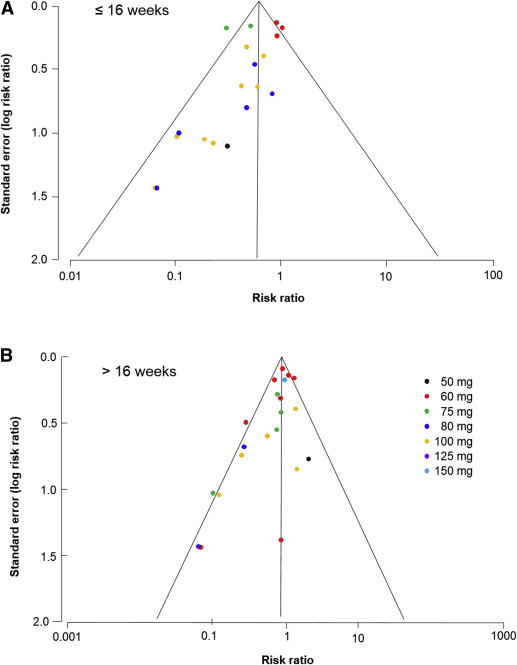
Analysis of the funnel plots suggest the possibility of publication bias because small studies with no beneficial effect were missing ( Figure 4 ). Moreover Egger test suggest asymmetry of the funnel plots: aspirin ≤16 weeks: P value = .091; aspirin >16 weeks: P value = .007.
Comment
Main findings
This meta-analysis demonstrates that the beneficial effect of prophylactic aspirin for the prevention of PE, severe PE, and FGR is conditional on the onset of treatment being at ≤16 weeks’ gestation and has a dose-response effect. The actual evidence shows that 60 mg of aspirin initiated at any time during pregnancy has no impact on the risk of PE, severe PE, and FGR.
The exact mechanism by which aspirin acts to prevent PE and FGR remains unclear. However, the finding that therapy is effective only when treatment is initiated at ≤16 weeks is compatible with the knowledge that certainly severe PE, preterm PE, and FGR are associated with impaired placentation; in normal pregnancies the physiological transformation of uterine spiral arteries is completed by 16-18 weeks’ gestation. We hypothesized that aspirin started ≤16 weeks can reduce deep placentation disorders in women at high risk of poor placentation and therefore reduce the early and severe forms of PE as well as FGR. However, few studies evaluated the impact of aspirin initiated in early pregnancy on placentation. On the other hand, term and mild PE are likely to be the consequences of other pathologic processes that can also lead to the maternal syndrome. The optimal approaches for the prediction and prevention of the preterm and severe forms of PE are likely to be different than those for the term and mild forms of the disease. As for the need of a minimum dose of aspirin, previous observational studies reported that in a high proportion of women a dose of <100 mg/d is not sufficient to affect platelet function or reduce PE.
The clinical impact of such finding is important because maternal history and characteristics, maternal nutritional status, as well as several ultrasound and biochemical markers can identify women who will develop PE, severe PE, early-onset PE, and FGR before the first symptoms, and as early as the first trimester of pregnancy. Combined screening by maternal factors, uterine artery pulsatility index, mean arterial pressure, and placental growth factor in the first trimester has been associated with a detection rate of 75% of preterm PE and 47% of PE at a false-positive rate of 10%. This growing body of evidences suggests that preterm PE and FGR can be predicted in early pregnancy and prevented with a minimum dose of aspirin initiated also in early pregnancy. The Aspirin for Evidence-Based Preeclampsia Prevention Trial is evaluating the impact of aspirin at 150 mg daily started at the end of the first trimester for the prevention of preterm PE in women identified at high risk of preterm PE using such combined screening.
Comparison with previous studies
The finding that low-dose aspirin started at ≤16 weeks in high-risk women reduces the prevalence of PE and FGR is in agreement with that of previous meta-analyses. Similarly, the finding that the effectiveness of aspirin is not only dependent on the gestational age at initiation of treatment but also on the dose of the drug is supported by the results of a previous meta-analysis, from the Cochrane Database, which reported a greater reduction in the risk of PE with the use of aspirin >75 mg/d (17 trials; N = 3061; RR, 0.64; 95% CI, 0.51–0.80) or the combination of aspirin >75 mg/d and dipyridamole (5 trials; N = 506; RR, 0.30; 95% CI, 0.15–0.60) compared to aspirin ≤75 mg/d (21 trials; N = 26,984; RR, 0.88; 95% CI, 0.81–0.95). Another meta-analysis (13 trials; N = 13,234) reported that the effect of aspirin for the prevention of FGR was greater when treatment started at ≤16 weeks’ gestation and the dose was 100-150 mg/d rather than 50-80 mg/d.
Limitations
The main limitation of this meta-analysis is the absence of large RCTs that recruited all participants in early pregnancy and more specifically ≤16 weeks of gestation. Most data from participants recruited at ≤16 weeks’ gestation come from small to moderate RCTs or from subgroups of participants recruited in larger RCTs. It could be argued that the use of subgroups (several dosages, several gestational ages) and multiple analyses could lead to potential biases. An additional limitation is that we are unable to determine the optimal dose of aspirin based on this meta-regression analysis, as the number of participants per subgroups is too small, and there is unexplained heterogeneity in some subgroup. Two dosages (60 and 100 mg/d) were studied in sufficient depth to allow direct comparison. Data from large, high-quality trials show that 60 mg/d has no significant impact on the prevalence of PE, severe PE, or FGR. In contrast, all of these outcomes were associated with a significant reduction in prevalence when 100 mg/d was started at ≤16 weeks’ gestation.
Conclusions
The results of this meta-analysis suggest that in high-risk women the effect of aspirin for the prevention of PE, severe PE, and FGR is dose-dependent and optimal when initiated ≤16 weeks of gestation.
Appendix

