Materials and Methods
FamilyScape is populated with a nationally representative sample of women between the ages of 15 and 39 years. Behaviors (eg, coital frequency and contraceptive use) are simulated at the individual level and on a daily basis. We parameterized the model so as to ensure that it generates realistic variation in these behaviors according to women’s demographic characteristics.
FamilyScape’s parameters were derived using data from a variety of sources, including the National Survey of Family Growth (NSFG), the National Vital Statistics System, the Guttmacher Institute’s Abortion Provider Survey, and several fertility studies. The model is designed to reproduce the behaviors and fertility outcomes of women in the United States between 2006 and 2010, which corresponds approximately to the time period during which CHOICE was implemented. FamilyScape produces distributions of sexual activity, contraceptive use, contraceptive switching, contraceptive failure, pregnancy, child-bearing, and abortion that are well-matched to their corresponding real-world benchmarks.
The Figure provides an overview of the model. On each day within the simulation, women decide whether to have sex. A woman’s probability of becoming pregnant when she has intercourse is a function of the effectiveness of any contraception that she is using and her natural fecundity (ie, her probability of conceiving from an act of unprotected sex).
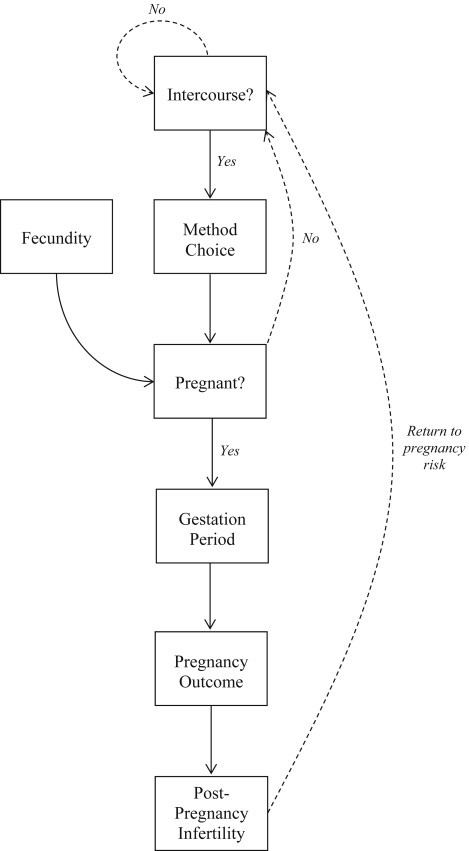
Women are assigned to contraceptive categories that reflect their choice of female- and male-controlled methods. In terms of female-controlled contraception, we simulate the use of LARC methods, which include IUDs, implants, and injectables; other female-controlled methods, such as the birth control pill, the transdermal patch, and the vaginal ring (PPR); and female sterilization. In terms of male-controlled contraception, we simulate the use of condoms and male sterilization.
Some women in the simulation use both female- and male-controlled methods, some use only 1 method, and others do not use any contraception. Women are allowed to switch contraceptive categories on a monthly basis. Each simulated pregnancy eventually results in a birth, an abortion, or a fetal loss.
A pregnancy’s eventual outcome determines the length of its gestation period. Because women tend to be temporarily infertile after their pregnancies end, we model an interval of postpregnancy infertility whose length varies according to the pregnancy’s outcome. A woman does not return to a state of pregnancy risk until after her interval of postpregnancy infertility is completed.
We generate simulation results using microdata produced by the model over a 1 year span of analysis time. To ensure that our results are not influenced unduly by outliers, we perform 100 separate simulation runs for each specification, and we report results that are averaged across those 100 1 year runs. For each simulated estimate, we report 95% confidence intervals that reflect uncertainty related to random variation in our results across runs.
Simulation specifications
To create a simulation population whose demographic characteristics were comparable with those of CHOICE participants, we first randomly selected a sample of women of child-bearing age from the 2006-2010 NSFG. We incorporated the survey’s demographic weights into the selection process to ensure that this initial sample was nationally representative. To mimic the eligibility requirements for participating in CHOICE, we dropped all women who were sterilized or sexually inactive.
Because the CHOICE population was found to be nationally unrepresentative with respect to age, race, ethnicity, income, and marital status, we then randomly selected and dropped subsets of observations that would have been outliers in the CHOICE sample according to each of these demographic characteristics. For instance, a smaller proportion of women were white in the CHOICE sample than in our initial nationally representative sample. We therefore randomly selected and dropped white women from our sample until the proportion of women who were white in our simulation population was similar to the corresponding metric for the CHOICE sample. We were ultimately left with a simulation population that was of roughly the same size as the CHOICE sample.
We implemented 3 different simulation specifications for this group of women. First, we performed a “preenrollment” simulation in which we reproduced the distribution of methods used by study participants prior to enrolling in CHOICE. We produced this distribution by using FamilyScape’s baseline parameters to assign each woman a probability of falling into a given contraceptive category as a function of her demographic characteristics. We then probabilistically assigned women to contraceptive categories in such a way as to simulate CHOICE participants’ observed preenrollment distribution of contraceptive use. This specification allowed us to estimate the pregnancy rate for our CHOICE sample in the absence of the CHOICE intervention.
In a second “CHOICE” specification, we replicated the postenrollment distribution of methods adopted by women who participated in CHOICE, meaning that 75% of women were assigned to FamilyScape’s LARC category and 25% were assigned to the PPR category. In contrast with the preenrollment specification, we did not allow for demographic variation in women’s probability of choosing LARC methods vs PPR methods. Instead, we randomly assigned women to these 2 categories. This was because the CHOICE intervention substantially compressed the degree of demographic variation in method choice. For example, black women are more than twice as likely as white women to choose LARC methods over PPR methods among NSFG respondents but were only 7% more likely than white women to choose LARC methods over PPR methods among CHOICE participants.
As is discussed in the Appendix , the results of a supplemental analysis show that our findings were insensitive to the assumption that there was no demographic variation in the probability of LARC uptake among CHOICE participants.
In a third and final “PPR-adoption” specification, we assumed that PPR methods would be adopted by all women who were using condoms or no method before they enrolled in CHOICE. We assumed continued LARC use among women who were relying on LARC methods prior to enrollment. Because women were eligible to participate in CHOICE only if they were willing to start a new method, we implicitly assume under this specification that women who remain in the LARC category will switch to a different long-acting method (eg, from an IUD to an implant).
The difference between the pregnancy rates produced by the preenrollment specification and the CHOICE specification is our estimate of the effect of the CHOICE intervention, and the difference between the pregnancy rates produced by the preenrollment and PPR-adoption specifications is our estimate of the counterfactual effect that would have been produced by PPR uptake among all CHOICE participants who were originally nonusers or condom users. We would emphasize that our descriptions of these 3 simulation specifications reflect initial method distributions. As with actual CHOICE participants, women in the simulation population could, and sometimes did, switch methods as the simulations progressed.
Results
Table 1 compares the demographic features of our CHOICE simulation population with those of the actual CHOICE sample for each of the characteristics incorporated into the demographic alignment process described in the previous section. Because no single CHOICE evaluation reported data on all relevant demographic characteristics, we drew benchmarks from several different studies.
| Characteristics | Simulation population | CHOICE sample |
|---|---|---|
| Age, y | ||
| 14–17, % | 5.2% (5.2–5.2%) | 5.2% |
| 18–20, % | 16.7% (16.7–16.7%) | 16.7% |
| 21–25, % | 38.5% (38.5–38.5%) | 38.5% |
| 26–35, % | 32.7% (32.7–32.7%) | 32.7% |
| 36 or older, % | 6.9% (6.9–6.9%) | 6.9% |
| Ethnicity | ||
| Hispanic, % | 4.9% (4.9–4.9%) | 5.1% |
| Race | ||
| Black, % | 54.1% (54.1–54.2%) | 50.5% |
| White, % | 40.6% (40.5–40.6%) | 41.8% |
| Other, % | 5.3% (5.3–5.3%) | 7.7% |
| Married, % | 15.8% (15.8–15.9%) | 20.8% |
| Low-income, % | 79.1% (79.0–79.2%) | 79.8% |
| n | 9195 (9170–9220) | 9256 |
For most characteristics, the simulation population closely matches its real-world benchmarks. Importantly, however, the only published marriage rate for CHOICE participants corresponds to a sample that was weighted to account for the unrepresentativeness of the CHOICE sample with respect to race, ethnicity, and age. We do not have data on a more appropriate benchmark reflecting the raw (unweighted) marriage rate within the CHOICE sample. This helps to explain the discrepancy between the simulated and benchmark marriage rates.
In Table 2 , we report the simulated distributions of initial contraceptive use for each specification. For reasons previously discussed, 75% of women adopt LARC methods and the remaining 25% of women adopt PPR methods under the CHOICE specification, whereas all nonusers and condom users take up PPR methods under the PPR-adoption specification. As is detailed further in the Appendix , our simulated preenrollment contraceptive distribution is similar to the real-world distribution of method use among CHOICE participants before they enrolled in the study.
| Most effective method used at the start of the simulation | Preenrollment specification | CHOICE specification | PPR-adoption specification |
|---|---|---|---|
| LARC | 4.4% (4.4–4.4%) | 75.0% (75.0–75.0%) | 4.4% (4.4–4.4%) |
| PPR | 19.1% (19.0–19.2%) | 25.0% (25.0–25.1%) | 95.6% (95.6–95.6%) |
| Condoms | 32.2% (32.1–32.3%) | 0.0% — | 0.0% — |
| No method | 44.2% (44.1–44.3%) | 0.0% — | 0.0% — |
Table 3 compares our simulated annual LARC and PPR failure rates under the CHOICE specification with the relevant benchmarks for the CHOICE sample. We developed these benchmarks by calculating weighted averages of the method-specific failure rates experienced by CHOICE participants, in which our weights were estimated using the distribution of postenrollment method use among study participants. Our simulated LARC failure rate is within three tenths of a percentage point of its benchmark. However, the PPR failure rate is noticeably higher in our simulation than among CHOICE participants.
| Method | Simulated estimate | Real-world benchmark |
|---|---|---|
| Failure rates | ||
| LARC | 0.6% (0.6–0.6%) | 0.3% |
| PPR | 7.7% (7.6–7.8%) | 4.8% |
In the Appendix , we report the results of an additional analysis in which we precisely replicated CHOICE participants’ postenrollment PPR and LARC failure rates. The conclusions suggested by this sensitivity test were consistent with the conclusions suggested by our main simulation specifications.
Given that all CHOICE enrollees adopted female-controlled methods, there are no benchmarks against which to compare our simulated failure rates for nonusers and condom users. For completeness, however, we note that the simulated annual failure rates among nonusers and condom users were 33.9% (95% confidence interval [CI], 33.7–34.1%) and 15.5% (95% CI, 15.4–15.6%), respectively.
The pregnancy rate among nonusers is generally assumed to be much higher than in our simulations. There are 2 explanations for this difference. First, the risk of pregnancy is substantially lower among sexually active nonusers who are not seeking pregnancy than among sexually active nonusers who are seeking pregnancy. Because CHOICE targeted women who were at risk of an unintended pregnancy, all 3 of our simulation specifications are parameterized to produce a pregnancy rate among sexually active nonusers that matches the (lower) real-world pregnancy rate experienced by sexually active nonusers who do not wish to become pregnant.
Second, the most commonly cited pregnancy rate for nonusers reflects the probability of becoming pregnant within 12 sexually active months. However, in the CHOICE study whose results were used to develop the benchmarks that are presented in Table 3 , method-specific pregnancy rates were measured over 12 consecutive calendar months without regard to sexual activity.
For the purposes of consistency, we used the same approach to calculate the simulated pregnancy rates reported in Table 3 and in the discussion cited previously. Both of these considerations are discussed further in the Appendix .
We present our main simulation results in Table 4 . In the top panel of the table, we report simulated pregnancy rates under the preenrollment, CHOICE, and PPR-adoption specifications. In the middle panel, we report the proportional differences between the simulated pregnancy rates for the CHOICE and PPR-adoption specifications and the simulated pregnancy rate for the preenrollment specification. We find that the CHOICE intervention reduced the pregnancy rate among program participants by about 82%. This simulated effect size is similar to other estimates of the intervention’s impacts on correlates of unintended pregnancy such as abortion and teenage pregnancy.
| Results | Values |
|---|---|
| Simulated pregnancy rate | |
| Preenrollment specification | 23.9% (23.8–24.0%) |
| CHOICE specification | 4.2% (4.1–4.2%) |
| PPR-adoption specification | 9.6% (9.5–9.7%) |
| Proportional reduction in the simulated pregnancy rate relative to preenrollment specification | |
| CHOICE specification | 82.4% (80.5–84.4%) |
| PPR-adoption specification | 59.8% (57.0–62.7%) |
| Share of the CHOICE effect that could have been achieved by the adoption of PPR methods among noncontraceptors and condom users | 72.6% (68.8–76.4%) |
Our results thus confirm that CHOICE produced a very substantial reduction in participants’ risk of unintended pregnancy. However, our PPR-adoption specification suggests that, if all nonusers and condom users had adopted PPR methods, the CHOICE sample’s pregnancy rate would have fallen by nearly 60%. We therefore conclude that more than 70% (0.598/0.824 ≈ 72.6%) of the CHOICE effect could have been achieved without any increase in LARC use.
Results
Table 1 compares the demographic features of our CHOICE simulation population with those of the actual CHOICE sample for each of the characteristics incorporated into the demographic alignment process described in the previous section. Because no single CHOICE evaluation reported data on all relevant demographic characteristics, we drew benchmarks from several different studies.
| Characteristics | Simulation population | CHOICE sample |
|---|---|---|
| Age, y | ||
| 14–17, % | 5.2% (5.2–5.2%) | 5.2% |
| 18–20, % | 16.7% (16.7–16.7%) | 16.7% |
| 21–25, % | 38.5% (38.5–38.5%) | 38.5% |
| 26–35, % | 32.7% (32.7–32.7%) | 32.7% |
| 36 or older, % | 6.9% (6.9–6.9%) | 6.9% |
| Ethnicity | ||
| Hispanic, % | 4.9% (4.9–4.9%) | 5.1% |
| Race | ||
| Black, % | 54.1% (54.1–54.2%) | 50.5% |
| White, % | 40.6% (40.5–40.6%) | 41.8% |
| Other, % | 5.3% (5.3–5.3%) | 7.7% |
| Married, % | 15.8% (15.8–15.9%) | 20.8% |
| Low-income, % | 79.1% (79.0–79.2%) | 79.8% |
| n | 9195 (9170–9220) | 9256 |
For most characteristics, the simulation population closely matches its real-world benchmarks. Importantly, however, the only published marriage rate for CHOICE participants corresponds to a sample that was weighted to account for the unrepresentativeness of the CHOICE sample with respect to race, ethnicity, and age. We do not have data on a more appropriate benchmark reflecting the raw (unweighted) marriage rate within the CHOICE sample. This helps to explain the discrepancy between the simulated and benchmark marriage rates.
In Table 2 , we report the simulated distributions of initial contraceptive use for each specification. For reasons previously discussed, 75% of women adopt LARC methods and the remaining 25% of women adopt PPR methods under the CHOICE specification, whereas all nonusers and condom users take up PPR methods under the PPR-adoption specification. As is detailed further in the Appendix , our simulated preenrollment contraceptive distribution is similar to the real-world distribution of method use among CHOICE participants before they enrolled in the study.
| Most effective method used at the start of the simulation | Preenrollment specification | CHOICE specification | PPR-adoption specification |
|---|---|---|---|
| LARC | 4.4% (4.4–4.4%) | 75.0% (75.0–75.0%) | 4.4% (4.4–4.4%) |
| PPR | 19.1% (19.0–19.2%) | 25.0% (25.0–25.1%) | 95.6% (95.6–95.6%) |
| Condoms | 32.2% (32.1–32.3%) | 0.0% — | 0.0% — |
| No method | 44.2% (44.1–44.3%) | 0.0% — | 0.0% — |
Table 3 compares our simulated annual LARC and PPR failure rates under the CHOICE specification with the relevant benchmarks for the CHOICE sample. We developed these benchmarks by calculating weighted averages of the method-specific failure rates experienced by CHOICE participants, in which our weights were estimated using the distribution of postenrollment method use among study participants. Our simulated LARC failure rate is within three tenths of a percentage point of its benchmark. However, the PPR failure rate is noticeably higher in our simulation than among CHOICE participants.
| Method | Simulated estimate | Real-world benchmark |
|---|---|---|
| Failure rates | ||
| LARC | 0.6% (0.6–0.6%) | 0.3% |
| PPR | 7.7% (7.6–7.8%) | 4.8% |
In the Appendix , we report the results of an additional analysis in which we precisely replicated CHOICE participants’ postenrollment PPR and LARC failure rates. The conclusions suggested by this sensitivity test were consistent with the conclusions suggested by our main simulation specifications.
Given that all CHOICE enrollees adopted female-controlled methods, there are no benchmarks against which to compare our simulated failure rates for nonusers and condom users. For completeness, however, we note that the simulated annual failure rates among nonusers and condom users were 33.9% (95% confidence interval [CI], 33.7–34.1%) and 15.5% (95% CI, 15.4–15.6%), respectively.
The pregnancy rate among nonusers is generally assumed to be much higher than in our simulations. There are 2 explanations for this difference. First, the risk of pregnancy is substantially lower among sexually active nonusers who are not seeking pregnancy than among sexually active nonusers who are seeking pregnancy. Because CHOICE targeted women who were at risk of an unintended pregnancy, all 3 of our simulation specifications are parameterized to produce a pregnancy rate among sexually active nonusers that matches the (lower) real-world pregnancy rate experienced by sexually active nonusers who do not wish to become pregnant.
Second, the most commonly cited pregnancy rate for nonusers reflects the probability of becoming pregnant within 12 sexually active months. However, in the CHOICE study whose results were used to develop the benchmarks that are presented in Table 3 , method-specific pregnancy rates were measured over 12 consecutive calendar months without regard to sexual activity.
For the purposes of consistency, we used the same approach to calculate the simulated pregnancy rates reported in Table 3 and in the discussion cited previously. Both of these considerations are discussed further in the Appendix .
We present our main simulation results in Table 4 . In the top panel of the table, we report simulated pregnancy rates under the preenrollment, CHOICE, and PPR-adoption specifications. In the middle panel, we report the proportional differences between the simulated pregnancy rates for the CHOICE and PPR-adoption specifications and the simulated pregnancy rate for the preenrollment specification. We find that the CHOICE intervention reduced the pregnancy rate among program participants by about 82%. This simulated effect size is similar to other estimates of the intervention’s impacts on correlates of unintended pregnancy such as abortion and teenage pregnancy.
| Results | Values |
|---|---|
| Simulated pregnancy rate | |
| Preenrollment specification | 23.9% (23.8–24.0%) |
| CHOICE specification | 4.2% (4.1–4.2%) |
| PPR-adoption specification | 9.6% (9.5–9.7%) |
| Proportional reduction in the simulated pregnancy rate relative to preenrollment specification | |
| CHOICE specification | 82.4% (80.5–84.4%) |
| PPR-adoption specification | 59.8% (57.0–62.7%) |
| Share of the CHOICE effect that could have been achieved by the adoption of PPR methods among noncontraceptors and condom users | 72.6% (68.8–76.4%) |
Stay updated, free articles. Join our Telegram channel

Full access? Get Clinical Tree


