Normal Nutritional Requirements
Praveen S. Goday
Every infant or child has a genetic potential for physical, mental, and emotional growth. Providing nutrition that fulfills all aspects of that growth potential represents optimal nutrition. When nutrition either limits growth or results in excessive body mass, because of either inadequate quality or inappropriate quantity, an individual is suffering from malnutrition (ie, undernutrition or obesity).
All published dietary requirements are guidelines designed to assure that most individuals will be well nourished. They are not meant to be rigidly followed by any specific individual. Precise adherence to these guidelines by any one person does not guarantee that an individual will be well nourished.
DIETARY GUIDELINES AND THE BASIC FOOD GROUPS
In 1988, the first Surgeon General’s Report on Nutrition and Health concluded that over-consumption of certain dietary components now is a major concern for Americans.1 The disproportionate consumption of foods that are high in fats, often at the expense of foods that are high in complex carbohydrates and fiber (eg, vegetables, fruits, and whole-grain products), increased the risk of diet-related diseases. The report reiterated the dietary guidelines issued jointly by the US Department of Agriculture (USDA) and the US Department of Health and Human Services. The recommendations of the Dietary Guidelines for Americans, as revised in 2005, are summarized here2:
• Eat a variety of nutrient-dense foods and beverages.
• Balance the food that you eat with regular physical activity.
• Choose a diet with plenty of grain products, vegetables, and fruits.
• Choose a diet low in fat, saturated fats, trans fats, and cholesterol.
• Choose a diet moderate in sugars and salt.
The USDA has defined a system of 5 basic food groups that, when combined appropriately, should provide the average American with his or her nutritional needs. These 5 groups are vegetables, fruits, grains (eg, breads, cereals, pastas), dairy products, and proteins (eg, meat, poultry, fish eggs, nuts, legumes). Fats, oils, and sweets are separated, and it is recommended that they be “used sparingly.”
DIETARY REFERENCE INTAKES
The Food and Nutrition Board (FNB) of the Institute of Medicine, National Academy of Science, has collaborated since 1992 to revise the recommended dietary allowances (RDAs).3 Following an explosion of nutrition-related scientific data, the FNB decided to replace the recommended dietary allowances with dietary reference intakes (DRIs), which broadened the focus of the FNB as well as guidelines for the United States and Canada. The dietary reference intakes were established to meet a variety of uses, those focused on the intake and adequacy of populations as well as individuals. The FNB investigated the connection between nutrient intake and the risk reduction for chronic disease. In addition, upper limits for nutrients were established, specifically addressing therapeutics and toxicities. The following are four categories that comprise the general heading of dietary reference intakes:
• Estimated average requirement (EAR). An estimated nutrient intake value that meets the requirement of half the healthy individuals in a group or population according to accepted scientific research. 
• Recommended dietary allowance. The averaged daily dietary intake level that is sufficient to meet the nutrient requirements of virtually all (97–98%) healthy individuals in a group or population. 
• Adequate intake (AI). If the estimated average requirement is not known because of inadequate data, the recommended dietary allowances cannot be set. In that case, an adequate intake is estimated. The adequate intake is a recommended daily intake based on scientific observation or approximations of nutrient intakes of healthy group(s). Adequate intakes are levels at which deficiency has not been observed. They are to be applied to individual intake as well as to groups.
• Tolerable upper limit (UL). The highest level of daily nutrient intake found to pose no risks of adverse effects in individuals of a healthy population. The risk of adverse effects and toxicities increases with an increase in consumption above these limits. 
The safe range of intake is the area between the recommended dietary allowance and the tolerable upper limit. This is the area where deficiency and toxicity for the individual are most likely not to occur. The recommended intakes for macronutrients and the dietary reference intakes of calcium, vitamin D, phosphorus, magnesium, fluoride, folate, vitamin B12, and other B vitamins and choline, along with a variety of minerals, have been published by the US National Academy of Sciences. Recommended pediatric intakes are summarized in eTables 23.1, 23.2, and 23.3  . The original tables with all age ranges, including adults, are available at http://www.iom.edu/Object.File/Master/21/372/0.pdf.
SPECIFIC NUTRITIONAL REQUIREMENTS
It is useful to partition nutrients into eight major categories: (1) water, (2) energy, (3) proteins, (4) carbohydrates, (5) fats, (6) vitamins, (7) major minerals, and (8) trace elements. Each category is discussed in the context of the requirements in healthy children and considerations regarding changing requirements during illness.
 WATER
WATER
Water comprises approximately 50% to 60% of body weight in young adults and 70% to 75% of body weight in infants. Total body water, expressed as a percentage of body weight, is a function of age, sex, and body composition. Total body water decreases with age and changes in body fat content. Water and electrolyte balance are exquisitely controlled, as discussed in greater detail in Chapter 466.
Providing adequate amounts of nutrients without adequate amounts of fluid will result in dehydration, excessive renal solute load, and inefficient use and wasting of calories. An individual’s requirement for water is determined by total water losses. Water losses reflect sensible and insensible losses, renal concentrating ability, and total nutrient and water intake. Infants are especially susceptible to dehydration; their requirement for water is much greater because of insensible losses from their large surface area. They also have a higher percentage of body water, their kidneys have a limited capacity for handling solute load, they have an impaired capacity to concentrate their urine, and they are unable to consistently communicate their thirst.
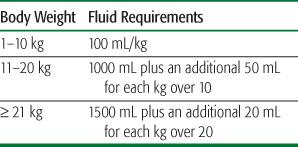
An individual’s water requirement is highly variable and quite complex. An adequate intake for water has been established; from a clinical perspective, Table 23-1 provides a useful method for estimating maintenance fluid requirements. Additional water must be provided when losses occur because of diarrhea, renal disease, cardiopulmonary compromise, fever, or catabolic stress.
Table 23-1. Estimated Daily Maintenance Fluid Requirements
For infants, breast milk or infant formula provides the majority of fluid requirements. Human milk and commercial formulas of standard energy density (ie, 20 kcal/oz or 0.66 kcal/mL) consist of approximately 89% water. Additional water that is produced from the oxidation of the ingested milk results in approximately 95% of the volume consumed being available as free water. The concentration of solutes that require excretion by the kidney (the potential renal solute load, or PRSL) must be considered during the design and manufacture of infant formula. 
The PRSL of commercially available milk-based formulas is about 135 mOsm/L (20 mOsm/100 kcal), and of soy protein–based formula about 160 mOsm/L (24 mOsm/100 kcal). In contrast, whole cow’s milk is 308 mOsm/L (46 mOsm/100 kcal), and skim milk is 326 mOsm/L (93 mOsm/100 kcal). The use of formula with a high PRSL places the infant at increased risk for hypertonic dehydration, whereas formulas providing 20 to 26 mOsm/100 kcal offer a margin of safety with respect to water balance and are therefore recommended. 
 ENERGY
Energy is required to carry out the biochemical processes of life and to perform physical work. The energy provided by foods is chemical energy obtained after digestion. The unit of measure for energy is either the joule or the calorie (1 joule = 4200 cal). The kilocalorie is equal to 1000 calories, or the amount of heat energy that is required to raise 1 kg of water by 1 °C. Energy from foods that are consumed in a child’s diet derives from carbohydrate (4 kcal/g), fat (9 kcal/g), and protein (4 kcal/g). In adults (and some adolescents), calories from ethanol (7 kcal/g) also may be a contributing source of energy.
The World Health Organization defines the energy requirements of an individual as the level of energy intake from food that will balance energy expenditure when the individual has a body size and composition and level of physical activity consistent with long-term good health and that will allow for the maintenance of economically necessary and socially desirable physical activity. In children and pregnant or lactating women, the energy requirement also includes the energy needs associated with the deposition of tissues or secretion of milk.
Energy requirements are highly individualized and vary widely among healthy persons. In states of disease and activity, energy requirements must be further adjusted to account for additional stresses. In most clinical situations, energy requirements for children are estimated from age, with the assumption of a similarity regarding body size, physical activity, and rate of growth. Provided one recognizes that recommendations for energy requirements are based on assumptions of size and activity, the energy needs of the healthy individual may be estimated from the estimated energy requirement (EER) equations that allow for growth and levels of physical activity.
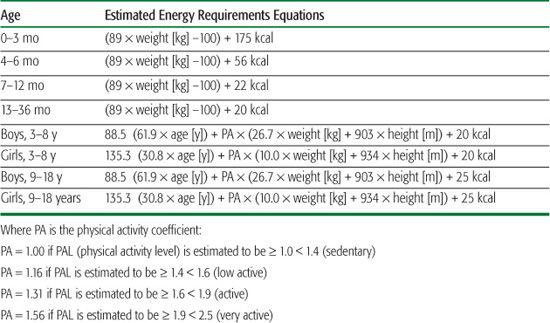
The equations used to obtain estimated energy requirements are shown in Table 23-2. Beyond 3 years of age, the recommended energy needs of boys and girls differ because of evolving activity patterns and, later, because of the onset of puberty. Variability in the timing and intensity of the pubertal growth spurt as well as activity lead to substantial variation in the energy requirements of individual adolescents.
Table 23-2. Estimated Energy Requirements
For the well-nourished, growing child, calculation of the estimated energy requirements may be sufficient to evaluate caloric adequacy. However, these calculations are not an adequate tool for determining the energy needs of sick or malnourished children. In these instances, more precise, individualized calculations are necessary to assess a child’s energy needs. The most reliable indicators of caloric adequacy in the sick child, however, are measurements of appropriate weight gain or loss, height, or skinfold thickness over time. Continual monitoring of growth parameters provides the only truly reliable method for determining the adequacy of energy intake. If growth is normal, it is reasonable to assume that the energy intake is adequate. 
 PROTEIN
Protein intake is required to supply nitrogen and amino acids for the synthesis of constituent proteins and other nitrogen-containing compounds such as polypeptide hormones. Nitrogen cannot be synthesized from fat or carbohydrate. Growth and regeneration of body components requires the constant replenishment of protein stores because of nitrogen losses from skin, hair, feces, and urine.
Protein quality refers to the distribution and the proportion of amino acids that the body is not capable of synthesizing in a particular protein source. A protein of high quality contains a large proportion of all essential amino acids. The required intake of protein varies inversely with the quality of the protein ingested; with intake of the higher-quality proteins, requirements will decrease. 
Protein needs range from 2.0 to 2.4 g/kg/d during the first month after birth and gradually fall to approximately 1.5 g/kg/d by 6 months of age, where it remains throughout the infant’s first year. Dietary reference intakes for protein have been established but are tabulated in grams/day rather than the more useful grams/kg/day (eTable 23.1  ).
).
During the second year of life, as table foods replace milk, the dietary requirement of protein increases from 1.5 g/kg/d to approximately 2 g/kg/d because the quality of mixed dietary protein is about 75% that of milk protein. Dietary protein requirements beyond infancy are met relatively easily by most Western diets. There is a surprising lack of appreciation of how much (or, more accurately, how little) protein actually is necessary in the diet to meet individual needs. The recommended dietary allowance for a 15-year-old boy is approximately 60 g of dietary protein. A 5-oz hamburger on a bun will meet over 50% of this protein need. 
 CARBOHYDRATE
Dietary carbohydrate may be either digestible or nondigestible. Digestible carbohydrates provide an important source of energy for metabolism. Glucose, stored as glycogen in the liver, is the preferred energy substrate for the brain. Carbohydrates also are structural elements in glycoproteins. If adequate dietary energy is not provided, additional energy must be expended to convert protein to glucose. The converted protein loses its value as a synthetic building block, with the nitrogen being lost in urine. An alternative means of deriving energy is via fatty acid oxidation. When carbohydrate is unavailable, fatty acids undergo β-oxidation, which results in acetyl-CoA, an intermediate of the citric acid cycle. This results in energy production. However, as in the case of gluconeogenesis, this alternative means of energy production requires energy itself. Therefore, inadequate provision of carbohydrate, which is an important source of calories, results in a net loss of body protein and fat stores, which may progress to protein-calorie malnutrition. Furthermore, inadequate energy intake from all sources can result in starvation, in which the body derives energy from ketone bodies. Carbohydrates are the predominant macronutrient in the promoted healthy diet.
Human milk provides approximately 40% of its calories as lactose, which is hydrolyzed to glucose and galactose. Fruits and vegetables contain simple sugars, including glucose and fructose; sucrose (table sugar) is a combination of glucose and fructose. In the child and adult, the majority of dietary carbohydrate is consumed in the form of polysaccharides, especially plant starches. Dietary carbohydrates provide from 35% to 60% of the average American diet. Complex carbohydrates should be promoted, and simple and refined starches should be minimized. This will help limit the overconsumption of “empty calories” and fructose often found in foods with high concentrations of refined sugars (eg, soda, sweets, candy, and various “fruit” drinks).
Nondigestible carbohydrates, or dietary fiber, derive from plants and consist of a number of polysaccharides and lignins that are present in the cell walls of all plants. There are two forms of dietary fiber: soluble and insoluble. Soluble fiber includes pectins, gums, mucilages, and some hemicelluloses. Pectins are found primarily in fruits and vegetables. Oat bran, barley, and legumes are examples of dietary sources of soluble fiber. Insoluble fiber consisting of predominantly cellulose and hemicellulose provides structure to plant cells. The major source of insoluble fiber is the bran layer of whole grains. 
 FAT
FAT
Fat (or lipid) provides an important, concentrated source of energy and plays a key role in the formation of the lipid “bilayer” membrane structure. In addition, the essential fatty acid arachidonic acid provides substrate for the formation of prostaglandins, leukotrienes, and thromboxanes. There are three major categories of lipids in Western diets: (1) triglycerides, (2) phospholipids, and (3) sterols. Triglycerides are the main dietary lipid. Each triglyceride consists of three esterified fatty acids that are bound to a molecule of glycerol. Triglycerides are characterized on the basis of the chain length of the bound fatty acids as short-chain fatty acids (fewer than 8 carbons), medium-chain fatty acids (8–12 carbons), and long-chain fatty acids (greater than 12 carbons). There are three predominant forms of phospholipid in the diet: (1) phosphatidylcholine (lecithin), (2) phosphatidylserine, and (3) phosphatidylethanolamine. These are structurally similar except for the bases (choline, serine, ethanolamine). The main dietary sterol is cholesterol, which is not present in foods of plant origin.
The main dietary lipid in North America is long-chain fatty acid (each fatty acid contains 14, 16, 18, or 20 carbon units). The long-chain fatty acids are further classified according to their degree of saturation; that is, saturated (contain the maximum number of hydrogens bound to the chain), monounsaturated (one double bond), and polyunsaturated (two or more double bonds). Typical American diets contain approximately 40% each of monounsaturated and saturated fatty acids. Polyunsaturated fatty acids and glycerol account for approximately 10% each. The proportion of unsaturated to saturated fatty acids in the diet is referred to as the P/S ratio (after the contribution of monounsaturated fatty acids has been excluded). In general, animal fats are highly saturated and have a lower P/S ratio than do vegetable fats. These distinctions are important because there is compelling evidence that links the ingestion of diets that are high in saturated fat to the development of atherosclerosis.
Trans-fatty acids are formed when manufacturers add hydrogen to liquid oils to create semisolid and more stable fats. This process results in the formation of a trans configuration (the cis configuration exists naturally in unsaturated fats). Recent studies have shown that consuming trans-fatty acids at levels similar to those in the average American diet (3% of kilocalories) will raise LDL-cholesterol and increase the risk of coronary heart disease and that increased trans-fatty acid intake may have adverse effects on infant neurodevelopment.5,6Trans-fatty acids are found in stick margarine, commercial frying fats, and high-fat baked goods. Natural sources of trans-fatty acids include butter, beef, and milk fats.
Humans are able to synthesize most fatty acids de novo by elongation and saturation of shorter unsaturated fatty acids. However, linoleic acid (an 18-carbon fatty acid with 2 unsaturated bonds) and longer polyunsaturates cannot be synthesized and therefore must be provided in the diet. Linoleic acid can be lengthened to form arachidonic acid (a 20-carbon fatty acid with 4 unsaturated bonds), which is therefore not essential if there is adequate linoleic in the diet. Linolenic acid (an 18-carbon fatty acid with 3 double bonds) generally also is considered to be an essential fatty acid, although dietary deficiency is rare.
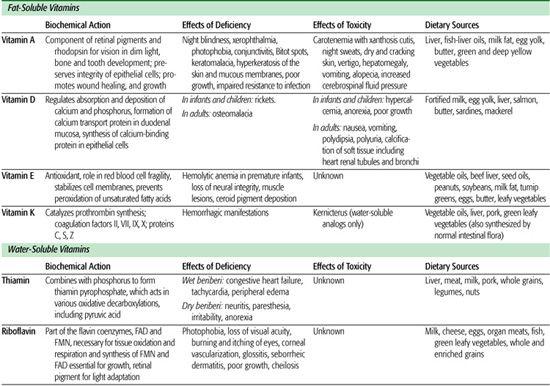
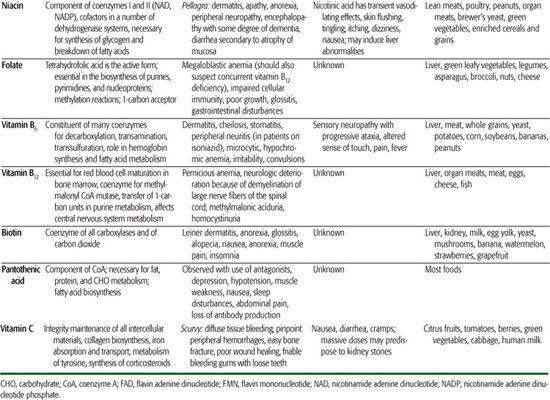
Table 23-3. Summary of Clinically Relevant Information on Fat-Soluble and Water-Soluble Vitamins
Essential fatty acid deficiency occurs when levels of linoleic acid are too low to maintain normal fatty acid metabolism. Clinically, symptoms that are most likely to be recognized are those of a scaly dermatitis, hair loss, diarrhea, and poor wound healing. Those children who are most at risk to develop essential fatty acid deficiency include premature infants who receive inadequate linoleic acid, children with fat malabsorption from hepatobiliary or pancreatic disease, and children receiving long-term parenteral nutrition without intravenous lipid. Although the exact requirement for linoleic acid is unclear, there is general agreement that 2% to 10% of calories should be ingested as linoleic acid. The diagnosis of essential fatty acid deficiency is established by demonstrating abnormally low plasma linoleic acid levels based on analysis of either total lipid extracts or isolated phospholipids. In addition, classically there is a decrease in arachidonic acid levels and a rise in 5,8,11-eicosatrienoic acid, which reflects a high rate of conversion of oleic acid to an abnormal triene. This generally is thought to occur as a compensatory mechanism with production of more longer-chain polyunsaturated fatty acids. The increased triene and decreased arachidonic acid (tetraene levels) result in a triene: tetraene ratio above 0.2, which is diagnostic of essential fatty acid deficiency.
Human milk contains 3% to 7% of calories from linoleic acid and significant amounts of linolenic acids. The actual fatty acid content varies depending on the mother’s diet. Most commercial formulas derive over 10% of their calories from linoleic acid, and all contain at least some linolenic acid. Cow’s milk has only approximately 1% linoleic acid, which is less than one half of the recommended level (2.4% of calories from linoleic acid), but essential fatty acid deficiency has not been observed in healthy babies who have been fed cow’s milk.
Medium-chain fatty acids comprise approximately 10% of the fatty acids in milk from the mother of a full-term infant and approximately 17% in that of the mother of a premature infant. Medium-chain triglycerides do not require bile acids to achieve solubilization and absorption. Additionally, they are absorbed directly into the portal system rather than via the lymphatic circulation. Thus, medium-chain triglyceride is better absorbed by premature infants compared with long-chain triglycerides, since bile acid secretion and pancreatic enzyme excretion is relatively deficient in the infant. Excessive use of medium-chain triglycerides (> 60% of total fat intake) as a replacement for long-chain triglycerides decreases the intake of essential fatty acids, thus increasing the risk of essential fatty acid deficiency.
Concerns regarding excessive caloric and cholesterol intake have led to the recommendation that overall fat intake should be limited, because elevated cholesterol levels early in life are linked to the later development of atherosclerosis in adulthood. Therefore, in all healthy children and adolescents over the age of 2 years, nutritional adequacy should be achieved by eating a wide variety of foods, with total fat providing no more than 30% of total calories and saturated fatty acids less than 10% of total calories. Intake of dietary cholesterol should not exceed 300 mg/d. Each of these recommendations refers to an average nutrient intake over a period of several days. The hope is that children will adopt these healthy eating habits and guidelines early in life, thereby fostering healthy eating patterns throughout life. Children who are younger than 2 years of age are specifically excluded from these recommendations because fat provides an important dietary source of energy. Therefore, emphasis on limiting fat intake can lead to inadequate caloric intake.
 VITAMINS
Vitamins serve as cofactors in a wide range of vital metabolic reactions. Their biochemical actions, effects of deficiency, toxicities, and dietary sources are enumerated in Tables 23-3 and 23-4; acceptable ranges of vitamin intake are listed in eTable 23.2  and online at http://www.iom.edu/Object.File/Master/21/372/0.pdf. Vitamins are widely used as dietary supplements. These supplements are of no demonstrated value for the healthy infant, child, adolescent, or adult who is consuming an adequate and varied diet. Although there is no demonstrated adverse effect to the use of a daily multivitamin supplement containing the recommended dietary allowance for vitamins, supplementation is expensive and unnecessary. For the otherwise well patient, use of a vitamin supplement may undermine the concept that adequate nutrition is provided through the intake of a mixed, varied diet.
 MAJOR MINERALS
Approximately 98% of the body’s mineral content consists of calcium, phosphorus, and magnesium, with bone containing 99% of the calcium, 80% of the phosphorus, and 60% of the magnesium. Table 23-5 outlines the principal biochemical actions, effects of deficiency, toxicity, and dietary sources of these three major minerals. Acceptable intakes are listed in eTable 23.3  and online at http://www.iom.edu/Object.File/Master/21/372/0.pdf. Total body calcium rapidly increases during the last 2 months of gestation and during adolescence. Bone mineralization continues through the third decade, when peak bone density is achieved. The height of this peak appears to influence the development of osteoporosis later in life, reinforcing the importance of early nutrition on later health.
Milk or infant formula supplies these minerals to the infant and young child. Therefore, children with decreased intake of milk, for whatever reason, are at increased risk of dietary calcium deficiency. The ratio of calcium to phosphorus (Ca:P ratio) strongly affects net mineral absorption and varies widely in different foods. Green vegetables have a Ca:P ratio of 2.8:1, human milk of 2:1, cow’s milk of 1.2:1, and meat of 0.6:1. Foods that are high in phosphates (eg, cola drinks) may predispose to bone loss. The favorable Ca:P in human milk is particularly important to assure adequate bone mineralization in infancy. Specially formulated premature and low-birth-weight formulas contain Ca:P ratios of approximately 2:1 to assure adequate bone mineralization for this high-risk population. The control of calcium metabolism is discussed in detail in Chapter 542.
Calcium absorption is inhibited by dietary phosphate, oxalate, fiber, alkali, and malabsorbed fat. Calcium absorption is enhanced by lactose-containing formulas and the activated form of vitamin D [1,25-(OH)2D3]. Phosphorus absorption is decreased by dietary calcium and aluminum-containing or magnesium-containing antacids.
Table 23-4. Summary of Clinically Relevant Information on Minerals
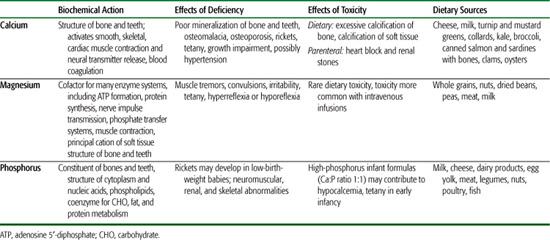
Table 23-5. Summary of Clinically Relevant Information on Trace Elements
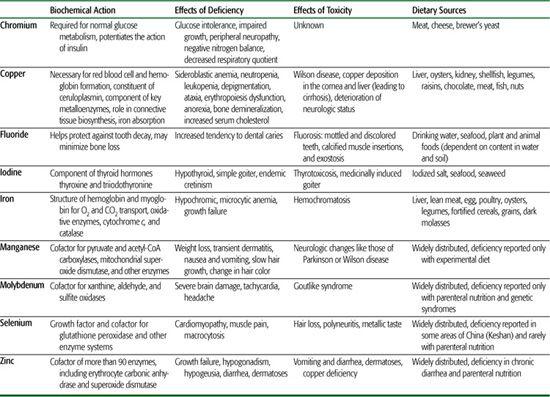
 TRACE ELEMENTS, IRON, AND ZINC
Trace elements constitute less than 0.0001 of the total body weight, yet many are considered to be essential for life, health, and reproduction. Table 23-5 summarizes the biochemical actions, effects of deficiency, toxicity, and dietary sources of the trace elements. Trace elements serve as cofactors in enzyme reactions, components of body fluids, sites for binding oxygen, and structural components for nonenzymatic macromolecules. Except for deficiencies of iron and iodine, which have been well known since before this century, deficiencies of other trace elements are only beginning to be recognized as health-related problems. For example, fluoride deficiency has been linked to an increased risk of dental cavities, zinc deficiency to growth failure, chromium deficiency to glucose intolerance, copper deficiency to hypercholesterolemia, and selenium deficiency to cardiomyopathy. Adequate iron intake is a concern throughout childhood. This is especially significant in periods of rapid growth. The exclusively breast-fed infant receives adequate iron and zinc from breast milk for the first 4 to 6 months of life. It has been shown that iron from breast milk is better absorbed than iron from formula. However, both breast-fed and formula-fed infants should receive additional sources of iron by age 6 months. This includes iron-fortified cereals and meats.
REFERENCES
See references on DVD.
Stay updated, free articles. Join our Telegram channel

Full access? Get Clinical Tree


