and Peter A. Dargaville5
(4)
Department of Neonatology, Murdoch Childrens Research Institute, Royal Children’s Hospital, Flemington Rd, Parkville, VIC, 3052, Australia
(5)
Department of Paediatrics, Royal Hobart Hospital and University of Tasmania, Hobart, TAS, Australia
14.1.1 Introduction
Respiratory inductive plethysmography (RIP) is a non-invasive method of measuring change in lung volume which is well-established as a monitor of tidal ventilation and thus respiratory patterns in sleep medicine. As RIP is leak independent, can measure end-expiratory lung volume as well as tidal volume and is applicable to both the ventilated and spontaneously breathing patient, there has been recent interest in its use as a bedside tool in the intensive care unit.
14.1.2 Technique
14.1.2.1 Theoretical Considerations
RIP determines change in lung volume by measuring the changes in both chest and abdominal volume displacements during tidal ventilation. In 1967, Konno and Mead, using the principle that there is a relationship between linear motion and volume displacement, showed that the chest wall operates with 2° of freedom and has two moving parts, the rib cage and the abdomen (Konno and Mead 1967). Additionally, in terms of motion of their surfaces, there is functional separation between the abdomen and the rib cage during breathing. By utilising this unitary behaviour of the two compartments, change in total thoracic volume1 can be determined from measurement of the volume displacement in each separate compartment. During ventilation, the lung will contribute to the majority of any thoracic volume change.
Thus, lung volume (V L) can be mathematically expressed as follows:

where V Lch and V Lab represent volume displacement within the chest and abdominal compartments, respectively.

(14.1)
The true practical advantage of Konno and Mead’s observation can be realised by considering the fact that a volume change will result in a change in cross-sectional area within each compartment.
Hence, V L can be considered as

where R ch and R ab are the cross-sectional areas of the chest and abdomen compartments respectively, k is a proportionality constant, representing the relative contribution of each compartment to total volume, and m scales the sum of the cross-sectional areas to a known volume (Sackner et al. 1989; Bar-Yishay et al. 2003).

(14.2)
14.1.2.1.1 Equipment
RIP systems employ two transducers, placed circumferentially around the chest and abdomen, to measure changes in the cross-sectional area of each (Watson et al. 1988; Adams 1996). Each transducer consists of a sinusoidal wire embedded in an elastic self-adherent material (Fig. 14.1). This allows the transducers to be applied to any chest or abdominal shape and size. One band is usually placed at nipple level (R ch) and the other approximately 1 cm above the umbilicus (R ab). These wires are connected to an electronic oscillator that generates a sine wave of 20 mV at 300 kHz. Stretch and relaxation of the bands produce variations in the electrical self-inductance within the wire and, thus, frequency (Adams 1996). The RIP unit demodulates the frequency change to produce an analogue voltage waveform representing the changes in rib cage and abdominal volume in real time (Ohms Law). The inductance within the wires increases linearly as a function of cross-sectional area in curved-shaped objects (Watson et al. 1988; Martinot-Lagarde et al. 1988; Brazelton et al. 1999a). The output of RIP is reliable within the frequency range of both conventional and high-frequency ventilator rates (Brazelton et al. 1999a, b; Boynton et al. 1989).
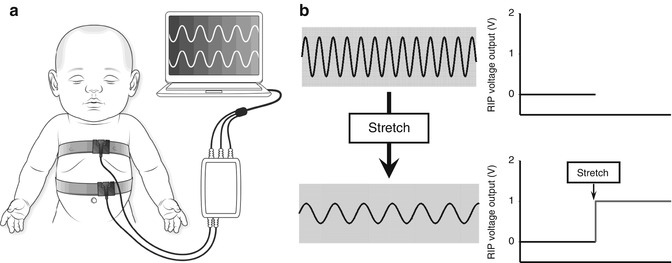

Fig. 14.1
(a) Illustration of RIP transducer bands correctly secured around the chest and abdomen of an infant. A sinusoidal wire embedded is in each band. (b) Schematic illustration of the relationship between changes in RIP voltage output (V) generated by stretch of the sinusoidal wire secondary to change in lung volume
Early RIP devices operated solely in AC-coupled output mode. This was adequate for assessing respiratory rate, tidal volume and synchrony of respiration, but the baseline signal was too unstable to assess end-expiratory lung volume (EELV) (Morel et al. 1983). Modern RIP devices allow both an AC- and DC-coupled output. In DC-coupled output, the RIP signal is sufficiently stable to allow reliable measurement of changes in EELV (Morel et al. 1983; Valta et al. 1992a), with good agreement with EELV values obtained by whole-body plethysmography (Carry et al. 1997) and super-syringe (Albaiceta et al. 2003).
14.1.2.1.2 Calibration
Changes in lung volume recorded by RIP are initially output as voltage changes. The RIP voltage change can be calibrated using a number of methods (Bar-Yishay et al. 2003). The two most common are the qualitative diagnostic calibration (QDC) algorithm (Sackner et al. 1989) and the least mean squares technique (Konno and Mead 1967; Strömberg et al. 1993). The least mean squares technique requires knowledge of a known volume change during the calibration phase, which is not always possible during paediatric and neonatal ventilation. For this reason, the QDC algorithm is the method most commonly used in ICU environments.
The QDC measures the voltage changes during a series of breaths at the start of the RIP recording, generally over 5 min. QDC allows derivation of the proportionality constant, k, in Eq. 14.2. The relative contribution of each compartment to the overall voltage change is estimated by selecting a series of breaths of similar tidal volume. This is achieved by excluding all breaths greater than one standard deviation (SD) of the mean ΔR ch and ΔR ab value. The constant k is then estimated as SD(R ch)/SD(R ab) (Sackner et al. 1989). QDC has been shown to generate acceptable agreement with pneumotachograph measurement of tidal volume in term newborn infants (Adams 1996) and piglet models of surfactant-deficient lung disease (Markhorst et al. 2006). The reliability of RIP calibration is best when measurements are immediately preceded by calibration and tend to deteriorate with time. RIP calibration accuracy decreases with severity of lung disease. In vitro, the phase deviation in the transducer outputs, and thus the stability of the proportionality factor, increases in a linear fashion at frequencies above 10 Hz (Boynton et al. 1989). The accuracy of this process is also directly related to the number of breaths analysed (Brown et al. 1998).
If the volumetric changes during the QDC are known, for example, using a pneumotachograph or super-syringe, then the scaling factor, m, can be determined for Eq. 14.2, and the RIP signals displayed in units of volume (Fig. 14.2). Calibration and signal stability can then be maintained if the band location and tension remain constant and the patient’s position, or pattern of breathing, does not change (Landon 2002).
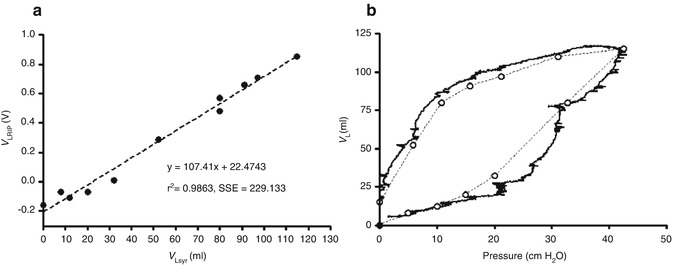

Fig. 14.2
(a) Relationship between super syringe volume (V Lsyr) and RIP (V LRIP) during a static pressure-volume curve between 0 and 40 cm H2O in a preterm lamb. RIP demonstrates a strong correlation over a wide range of lung volumes. (b) Resultant pressure-volume relationship after calibrating the RIP unit (solid lines). Open circles; Pressure – V Lsyr relationship
An advantage of the QDC method is that it can still be applied when absolute volume changes are not known. In these circumstances, changes in relative volume can be expressed as a ratio to the tidal volume during the QDC period. This is useful during non-invasive ventilation (Courtney et al. 2001) and high-frequency ventilation (Markhorst et al. 2006; Habib et al. 2002; Weber et al. 2000; Markhorst and van Genderingen 2004; Copnell et al. 2009; Hoellering et al. 2008; Tingay et al. 2006, 2007a). After QDC, a modern RIP device has been found to have a mean relative measurement bias of −2.0 (SD 9 %) during short periods of high-frequency ventilation (HFV) in a piglet model of paediatric lung disease (Markhorst et al. 2006; Markhorst and van Genderingen 2004). This error is less than common commercially available pneumotachographs (Scalfaro et al. 2001; Roske et al. 1998). This study also demonstrated that a k factor of 1.0 was reasonable for most paediatric lung disease states, overcoming some of the difficulties associated with QDC during high-rate, low tidal volume ventilation.
14.1.2.2 Clinical Applications
14.1.2.2.1 Assessment of EELV
The capacity of DC-coupled output RIP to achieve a stable baseline signal offers the potential to reliably measure change in EELV during mechanical ventilation, particularly high-frequency and non-invasive ventilation. Most modern ventilators include continuous airway flow monitoring, allowing RIP to be calibrated easily and frequently during conventional forms of mechanical ventilation.
14.1.2.2.1.1 Conventional Mechanical Ventilation
The first use of RIP to measure EELV was in an adult population after open heart surgery (Valta et al. 1992a, b). In this study, RIP was successfully used to measure the ΔEELV at different PEEP levels. This suggests that RIP may have potential to define an optimal PEEP during conventional mechanical ventilation in the paediatric population. RIP has frequently been used to measure ΔEELV during endotracheal tube suction (Copnell et al. 2009; Hoellering et al. 2008; Choong et al. 2003) (Fig. 14.3). In these studies, RIP has been able to accurately identify small changes in absolute and relative ΔEELV in infants and children ventilated with (Choong et al. 2003) and without (Hoellering et al. 2008) muscle relaxants.
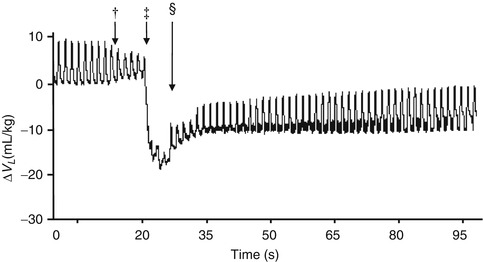

Fig. 14.3
Change in lung volume during endotracheal tube suction using a closed technique in an animal model of paediatric lung disease demonstrating the ability of RIP to document changes in both EELV and V T. Insertion of the suction catheter into the endotracheal tube (†), ‡ application of negative pressure suction and § completion of suction process (Adapted from Copnell et al. (2009). Reproduced with permission © 2009 International Pediatric Research Foundation, Inc)
To date, there are no reports of the use of RIP as a guide to the optimal application of PEEP in the paediatric population, despite the potential RIP offers in this field. Pilot data in preterm lambs suggest that RIP can map ΔEELV very effectively during conventional mechanical ventilation (Fig. 14.4).
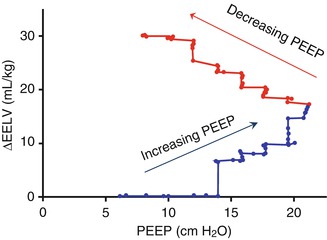

Fig. 14.4
Change in end-expiratory lung volume (mL/kg) during step-wise changes in PEEP in a preterm lamb. Ventilation applied using positive-pressure ventilation with a targeted tidal volume of 7 mL/kg
14.1.2.2.1.2 High-Frequency Ventilation
RIP has found a place in measurement of lung volume during high-frequency ventilation (HFV), in large part due to the difficulties in assessing volumetric change with other devices. The non-laminar gas flow during HFV makes pneumotachographic measurement of tidal volume difficult and measurement of EELV impossible (Gerstmann et al. 1990). RIP measures volume change directly within the thoracic cavity and is unaffected by flow characteristics. RIP thus has the potential to measure both tidal volume and EELV during HFV.
Calibrated RIP has been used to measure changes in lung volume during endotracheal tube suction in a small population of infants receiving HFV (Tingay et al. 2007a). This was achieved by calibrating the RIP voltage change against tidal volume at the airway opening in a series of tidal inflations during conventional ventilation. This technique requires transient discontinuation of HFV and, possibly, disconnection from mechanical ventilation. It is reasonable to conclude that this method of calibration would be accurate for short periods during HFV. Whether the calibration factors remain accurate over longer periods is questionable, especially in states of severe, or changing, lung disease (Tingay et al. 2007b).
Even when uncalibrated, RIP still has clinical potential to measure relative changes in lung volume during HFV and avoids the limitations of calibration (Markhorst et al. 2006). On the bench-top, uncalibrated RIP accurately measures relative change in EELV during HFV between frequencies of 7 and 15 Hz (Brazelton et al. 1999a), with a stable signal for up to 4 h in a thermally constant environment (Brazelton et al. 1999b). Signal stability beyond 3 h has not been confirmed in human studies (Tingay et al. 2006).
Uncalibrated RIP has been shown to be a reliable method of assessing relative change in EELV during HFV in animal models of neonatal lung disease, agreeing with changes in lung volume measured using whole-body plethysmography (Weber et al. 2000), super-syringe-derived pressure-volume relationships (Brazelton et al. 2001; Gothberg et al. 2001) and single-slice chest computed tomography (Authors’ unpublished data).
The first reported use of RIP to record changes in EELV during HFV was by Saari et al. (1984) in which dynamic hyperinflation was demonstrated in seven adult patients receiving high-frequency ventilation. More recently, RIP has been used to describe the relationship between applied P aw and thoracic volume during HFV in animal models of surfactant-deficient lung disease. Identification of lung overdistension during sequential increases in P aw was possible in the healthy and surfactant-depleted piglet lung using RIP-derived static compliance (Weber et al. 2000). In both lung models, the relationship between applied P aw and compliance fitted a second-order sigmoidal model of the pressure-volume relationship (Venegas et al. 1998), with the P aw resulting in overdistension translating to the upper inflection point of the sigmoid curve, suggesting that RIP could be used to describe the inflation limb of the pressure-volume relationship (Weber et al. 2000). The same group has also shown that RIP-derived time constants of the lung can be used to identify the point of optimal ventilation during sequential P aw increases (Habib et al. 2002).
Increasingly, strategies which aim to apply HFV at the lowest possible P aw that maintains lung volume after a recruitment manoeuvre are being advocated (Rimensberger et al. 1999a, b, 2000a, b; van Kaam and Rimensberger 2007; De Jaegere et al. 2006; van Kaam et al. 2003, 2004a, b; Lachmann 1992; Vazquez de Anda et al. 1999, 2000; Froese 1997). Mapping the volumetric response to recruitment is difficult at the bedside, and clinicians are limited to resorting to indirect indicators of lung volume, such as oxygenation. In a piglet model of paediatric acute respiratory distress syndrome (Brazelton et al. 2001) and term and preterm lambs (Gothberg et al. 2001), RIP has been used to demonstrate lung volume recruitment, hysteresis and subsequent optimal P aw on the deflation limb of the pressure-volume relationship of the lung. In both these studies, critical points within the pressure-volume relationship, including total lung capacity, were identifiable. RIP can also demonstrate improvement in the hysteresis of the lung after administration of exogenous surfactant (Gothberg et al. 2001).
RIP has been used to map relative lung volume changes during an open lung recruitment strategy in 15 term to near-term muscle-relaxed infants receiving HFV (Tingay et al. 2006). RIP was used to determine the relationship between EELV and applied pressure, oxygenation and lung mechanics (Fig. 14.5). For the first time, lung recruitment, hysteresis and the closing pressure of the lung could be identified during HFV in infants. In addition, a direct relationship between oxygenation and lung volume was confirmed. This study demonstrated that uncalibrated RIP could be reliably used over prolonged periods (up to 3 h) to track ΔEELV. Subsequently, the authors were able to demonstrate that RIP could determine the time when stable EELV had been achieved after a pressure change (Tingay et al. 2005).


Fig. 14.5
(a) Relationship between mean airway pressure (P AW) and EELV, measured with RIP (V LRIP) during an open lung recruitment strategy in a muscle-relaxed term infant receiving HFOV for meconium aspiration syndrome. Open lung recruitment strategy consisted of a series of step-wise increases in P AW (open diamonds) until total lung capacity, followed by step-wise decreases (closed circles) until the closing pressure of the lung was identified by persistent desaturation (b). (c) Relationship between HFOV tidal volume, measured by RIP (V TRIP) and normalised to the maximum V TRIP identified, during the same open lung recruitment strategy
14.1.2.2.1.3 Non-invasive Ventilation
Similar to HFV, application of non-invasive ventilation is to some extent hampered by a lack of reliable direct measures of lung volume. Despite the increasingly popularity of non-invasive modes of ventilation to treat neonatal and paediatric lung disease, a strategy to define optimal continuous distending pressure (CDP) remains elusive. Interestingly, the use of RIP to measure EELV during CPAP is limited to two studies in preterm infants (Courtney et al. 2001; Elgellab et al. 2001). In both studies, RIP was able to track the relationship between PEEP and EELV during a series of PEEP changes from 0 to 8 cm H2O. One study measured relative ΔEELV using the RIP-determined V T value as a unit of volume (Elgellab et al. 2001). The other calibrated the RIP signal to the pneumotachograph V T during a brief period of spontaneous breathing through a face mask (Courtney et al. 2001), a technique that has been validated previously (Brooks et al. 1997). Both calibration techniques would be clinically reproducible. The results of both these studies suggest that RIP may be useful in determining the optimal CDP during CPAP (Fig. 14.6).
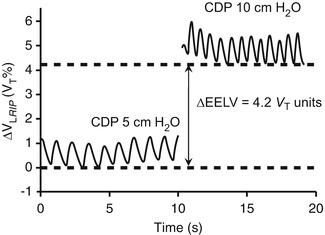

Fig. 14.6
Uncalibrated RIP tracing in a preterm infant receiving CPAP at a continuous distending pressure (CDP) of 5 cm H2O and 10 cm H2O. RIP is able to demonstrate tidal volume, respiratory rate and change in end-expiratory lung volume (ΔEELV). RIP units expressed as a proportion of the average tidal volume during the 5 cm H2O tracing
14.1.2.2.2 Assessment of Tidal Volume and Breathing Patterns
The first use of RIP to assess tidal breathing patterns in spontaneously breathing infants was described by Duffty et al. (1981). Since then, RIP has been used extensively to assess tidal volume, thoraco-abdominal asynchrony and work of breathing in infants (Strömberg et al. 1993; Courtney et al. 2001; Habib et al. 2002; Dolfin et al. 1982; Tabachnik et al. 1981; Stefano et al. 1986; Adams and Zabaleta 1993a, b, 1994). These initial studies demonstrated the accuracy of RIP in measurement of V T, in calibrated and uncalibrated modes, even over long periods of time (Brooks et al. 1997). The accuracy of RIP compared favourably with impedance sensors and strain gauges (Adams and Zabaleta 1993b). Apart from a direct measure of tidal volume, RIP allows the potential to assess the respiratory effort and pattern over time. As RIP is a measure of chest wall and abdominal movement, detection of apnoea is possible (Brooks et al. 1997; Weese-Mayer et al. 2000). During spontaneous breathing, knowledge of the synchrony of the abdominal and thoracic compartments is important as the summated signal constitutes the measured tidal volume. If the two compartments are out of phase (paradoxical breathing), there is the potential for the summated time course signal to indicate no tidal ventilation (Fig. 14.7). Such states of significant asynchrony of thoraco-abdominal motion signify poor lung mechanics and lead to significant diaphragmatic work and fatigue (Musante et al. 2001; Schulze et al. 2001; Guslits et al. 1987).
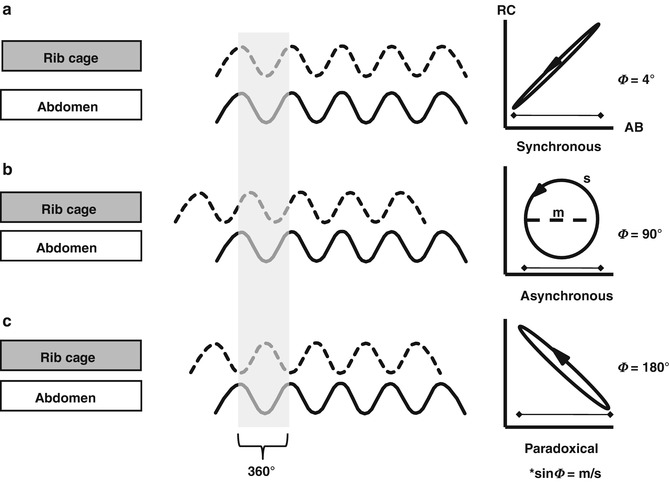

Fig. 14.7
RIP waveforms during tidal ventilation to illustrate synchronous (in phase; a), asynchronous (b) and paradoxical (completely out of phase; c) patterns of thoraco-abdominal motion. The resultant Lissajous plot (Konno-Mead plot) of rib cage (RC) against abdomen (AB) displacement during a single breath (highlighted in grey) shown on the right. Phase angles of 0° indicate perfectly synchronous thoraco-abdominal motion and 180° completely asynchronous motion. Poor lung mechanics and respiratory muscle fatigue is associated with highly asynchronous states (Figure courtesy of Dr Christopher Newth)
14.1.2.2.2.1 Conventional Mechanical Ventilation
Due to the availability, relative ease and reliability of pneumotachographic assessment of tidal volume at the airway opening, there are very few reports of assessment of tidal volume using RIP during conventional mechanical ventilation. RIP has been used to identify improved tidal volume, thoraco-abdominal synchrony and chest wall displacement after transition to proportional assist ventilation from CPAP (Musante et al. 2001).
RIP has been shown to be a reliable alternative to pneumotachography in driving ventilator synchronisation during conventional mechanical ventilation in animal models of the normal and diseased paediatric lung (Schulze et al. 2001). The accuracy of the RIP bands was depended on a reliable calibration of the contribution of each band to the summated signal. This accuracy diminished significantly after body movement, limiting the use of the summated signal for prolonged mechanical ventilation periods in ICU. Schulze et al. have proposed that the use of the abdominal band alone would overcome these difficulties and offer the advantage of being a leak- and dead-space-free method of determining spontaneous respiratory effort (Schulze et al. 2001).
Pneumotachography will be unreliable during states of rapid compliance change or respiratory asynchrony, such as endotracheal tube suction (Copnell et al. 2009; Hoellering et al. 2008) and surfactant administration. During these situations, RIP is likely to be a better indicator of tidal volume change in the thorax.
14.1.2.2.2.2 High-Frequency Ventilation
Assessment of V T during HFV is problematic. Pneumotachographic measures at the airway opening provide an accurate trend of HFV V T in vitro (Scalfaro et al. 2001), but do not correspond with the volumetric changes measurable at the chest wall. The accuracy of pneumotachography during HFV in humans has not been confirmed (Zimova-Herknerova and Plavka 2006); thus, it should be considered at best a proxy for tidal changes more distally in the tracheobronchial tree. In contrast, RIP is a direct measure of chest wall movement during HFV and likely to be a better representative of tidal volume. In an animal model of paediatric acute lung injury, RIP tidal amplitudes could be accurately measured and altered accordingly with changing PEEP and compliance (Markhorst et al. 2005, 2006). RIP tidal amplitude could then be used to identify overdistension during HFV. A similar relationship between volume state of the lung and RIP-derived V T has been found in human infants receiving HFV (Fig. 14.5) (Tingay 2013). In this study, the RIP-derived V T response approximated that of V T measured by pneumotachograph (Tingay 2008).
14.1.2.2.2.3 Non-invasive Ventilation
The early descriptions of RIP in infants related to tidal patterns in spontaneously ventilated subjects (Strömberg et al. 1993; Duffty et al. 1981; Dolfin et al. 1982; Stefano et al. 1986). Compared to pneumotachography, RIP shows good agreement as a measure of V T during CPAP and spontaneous ventilation in preterm infants (Bar-Yishay et al. 2003; Brown et al. 1998). Unlike face mask pneumotachography, RIP offers the ability to monitor tidal ventilation without significant disruption and can determine the synchrony of ventilation using the phase angle between the chest and abdominal tidal signals, sometimes expressed as a laboured breathing index (LBI). RIP has been used to demonstrate the effect of alterations in continuous distending pressure on tidal breathing patterns in preterm infants receiving CPAP. A higher pressure (maximum 8 cm H2O) resulted in a better V T and thoraco-abdominal synchrony and lower LBI, suggesting less work of breathing (Elgellab et al. 2001). Courtney and co-workers also demonstrated an association between increased respiratory rate and greater phase angle with CPAP delivered via nasal cannulae compared with short binasal prongs (Courtney et al. 2001). These small studies suggest that RIP may be useful as a monitoring device during CPAP.
14.1.2.3 Limitations
The most important limitation of RIP is the inability to determine the residual volume of the lung and absolute volume change. Furthermore, change in inductance measured by RIP is linearly related to total thoracic volume rather than gas volume per se. We have noted that RIP detects blood volume change within the chest during intravenous administration of fluid boluses (Authors unpublished data).
Early RIP systems were also susceptible to significant thermal drift, limiting the capacity to accurately monitor ΔEELV (Bhatia et al. 2010). Some modern RIP devices require up to 60 mins to achieve signal stability in a stable ambient temperature (Tingay 2008; Bhatia et al. 2010), but thereafter, signal stability is excellent and, in many cases, better than pneumotachographs (Markhorst et al. 2006; Brazelton et al. 2001; Tingay 2008). Drift appears to be less of an issue in newer RIP systems (Bhatia et al. 2010). The disease state of the lung may also affect the drift of the RIP signal. RIP was found to be unreliable during mechanical ventilation in adults with severe obstructive pulmonary disease (Neumann et al. 1998; Werchowski et al. 1990).
Strict adherence to a standardised method of transducer placement is required to reduce intersubject variability (Landon 2002). The chest and abdomen are most likely to operate with 1° of freedom when transducers are placed at the level of the nipples and at, or just above, the umbilicus (Konno and Mead 1967; Tingay et al. 2006; Brooks et al. 1997; Weese-Mayer et al. 2000). Most reports of RIP during paediatric critical care have equally weighted the chest and abdominal contributions. There is some evidence to support this assumption in paediatric acute lung injury (Markhorst et al. 2006), although it should be noted that this assumption is not universally true and may significantly alter measurement error (Poole et al. 2000).
The greatest hindrance for RIP is the lack of commercially available products specifically for intensive care use. Until RIP devices that measure changes in EELV and V T are integrated into modern monitoring systems, the potential for RIP is limited to a research tool.
14.1.2.4 Future Directions
The use of RIP in the resuscitation of newborn infants has not been described. Birth is a time of significant volume change in the lung. Increasingly, the need to establish adequate aeration is being recognised. Theoretically, RIP may offer promise in this clinical environment. Preliminary data in animal models of prematurity show that RIP can demonstrate tidal and end-expiratory lung volume change during resuscitation at birth (Fig. 14.8). As bedside lung mechanics monitors incorporating airway flow, pressure and RIP measures become available, the potential for RIP to guide newborn resuscitation should be investigated.
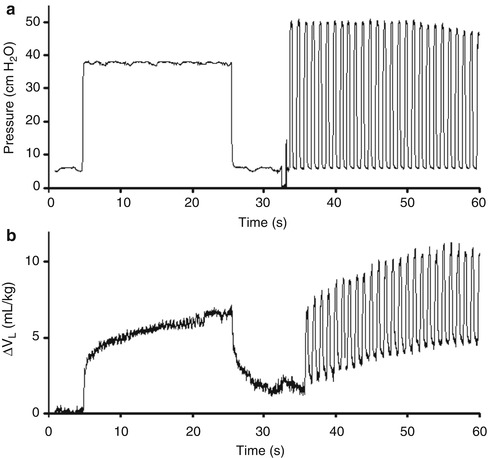

Fig. 14.8
Change in airway pressure (a) and lung volume (calibrated RIP, mL/kg; b) during a sustained inflation applied at birth, followed by positive pressure ventilation, in a preterm lamb
Essentials to Remember
RIP is a non-invasive method of measuring absolute or relative changes in thoracic volume.
RIP is an accurate method of measuring breathing patterns and tidal volume, without the limitations associated with measurements at the airway opening.
More recently, RIP has shown promise as a reliable method of determining ΔEELV in the mechanically ventilated patient.
At present, RIP remains an important tool for respiratory research at the bedside in ICU.
In the future, with development of commercially available RIP units that overcome some of the inherent limitations present in current systems, RIP has the potential to be a valuable monitoring tool in paediatric and neonatal intensive care.
Educational Aims
This chapter aims to give an understanding of:
The plethora of information on the heterogeneity of lung disease, the response to recruitment and the distribution of aeration that has been gained by computed tomography
The value of other imaging techniques, including magnetic resonance imaging and positron emission tomography, in the study of the diseased lung
The limitations of these imaging techniques in ventilated infants and children
14.2 Lung Imaging Methods
Peter A. Dargaville6
(6)
Department of Paediatrics, Royal Hobart Hospital and University of Tasmania, Hobart, TAS, Australia
14.2.1 Computed Tomography
The purpose of this section is to detail the advances in understanding of the diseased lung and its response to ventilation that have been made with the assistance of computed tomography. The use of CT imaging as a diagnostic tool in the ventilated infant and child is not discussed.
14.2.1.1 What Have We Learned from Computed Tomography of the Lung?
Since the earliest reports of the appearances of the lung in a ventilated subject using axial CT imaging (Brismar et al. 1985), a considerable body of knowledge has accumulated regarding the abnormalities of inflation and aeration in the diseased lung. Valuable insights have been gained both from experimental studies in animal models of lung disease and from ventilated humans, most of whom have been adults with acute respiratory distress syndrome (ARDS) (Gattinoni et al. 2001). In view of the radiation hazard, CT imaging specifically for delineation of patterns of aeration has not been performed in any systematic way in ventilated neonates, infants or children, but much of the data obtained in adult humans has direct relevance to even the smallest ventilated subject. The key observations made using CT imaging of the diseased lung are summarised in Table 14.1 and discussed further below.
Table 14.1
Information derived from computed tomography of the diseased lung
Inhomogeneity of lung expansion even with a relatively diffuse disease on plain X-ray |
Effect of superimposed pressure on the dependent regions of the diseased lung |
Presence of aeration “compartments” – non-aerated, poorly aerated, normally aerated and hyperinflated – in the diseased lung |
Changes in lung aeration and recruitment (reduction in non-aerated lung) during ventilatory manoeuvres |
Estimation of the potential for recruitment |
Coincidence of recruitment and hyperinflation during tidal ventilation |
A seminal observation from axial CT imaging in ARDS was that, in the face of relatively diffuse opacification on plain X-ray, lung densities are inhomogeneously distributed on axial CT slices (Fig. 14.9) (Gattinoni et al. 1986, 2001). It is now clear that ARDS is a patchy disease which includes areas of opacification and consolidation interspersed with regions in which relatively normal lung architecture and aeration remain. It is presumed that ARDS in infancy and childhood, as well as a number of neonatal lung diseases (including meconium aspiration syndrome), are similar morphologically. This has implications for the type of ventilation strategy to be used and its potential effectiveness, particularly if there are large areas of consolidation resistant to reinflation that are in juxtaposition with areas of relatively unaffected lung prone to hyperinflation.
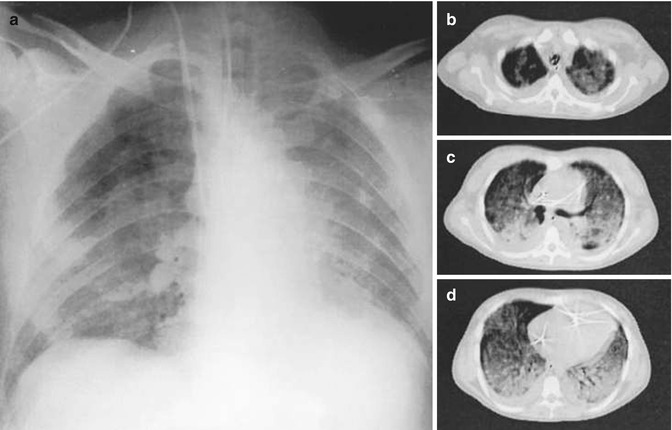

Fig. 14.9
Inhomogeneity of lung densities in acute respiratory distress syndrome. Anteroposterior chest X-ray (panel a) and axial CT scans at the level of the apex (b), hilum (c) and base (d) in a ventilated adult with acute respiratory distress syndrome from sepsis. Images were taken at a PEEP of 5 cm H2O. The chest X-ray shows relatively diffuse opacification, sparing the right upper lung. The CT scans show inhomogeneous disease in both the craniocaudal and sternovertebral gradients (Reproduced from Gattinoni et al. (2001) with permission of the American Thoracic Society. Copyright © American Thoracic Society)
Several descriptions of the morphological pattern of CT densities exist in ventilated patients with ARDS. The densities have been classed as diffuse, lobar or patchy (Puybasset et al. 2000), with the diffuse pattern being associated with a greater response to recruitment (Constantin et al. 2010). The pattern of lung densities has also been recognised to differ based on whether the lung disease is pulmonary or non-pulmonary in origin (Pelosi et al. 2003). In the latter case, the major impairment of compliance involves the chest wall, including the diaphragm, which may be subjected to significant limitation of movement in cases of abdominal sepsis or trauma (Pelosi et al. 2003). Not surprisingly, supra-diaphragmatic lung regions are most prone to atelectasis when there is diaphragmatic splinting of this type. Examples in childhood are a preterm infant with necrotising enterocolitis or a child with acute pancreatitis, but again no systematic CT imaging studies have been performed.
CT imaging in ARDS has also revealed that the inhomogeneous distribution of lung densities is, in part, gravity-related. The potential for superimposed pressure to cause compression atelectasis of dependent lung regions is now understood (Pelosi et al. 1994), as is the heightening of this effect in the diseased lung where the gas to tissue ratio is decreased throughout the lung (Fig. 14.10). CT imaging has shown that dependent atelectasis occurs in the normal lung under anaesthesia (Brismar et al. 1985) and can be identified in the full-term newborn with pan-alveolar disease (Fig. 14.11). Lung regions affected by dependent atelectasis are potentially recruitable with ventilatory manoeuvres, and this form of atelectasis can be counteracted by the use of positive end-expiratory pressure (PEEP) (Gattinoni et al. 1993). For overcoming the effects of superimposed pressure in the most dependent regions, theoretical considerations would suggest that a PEEP level (in cm H2O) equivalent to the anteroposterior diameter of the chest (in cm) is required. This estimate assumes a highly diseased lung with a gas to tissue ratio close to zero (Hickling 2001).
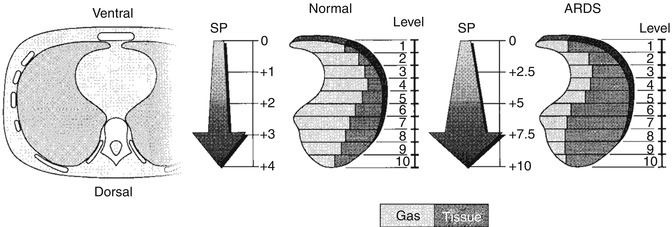
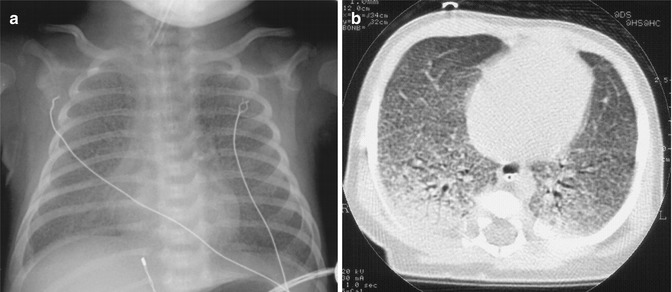

Fig. 14.10
The gradient of superimposed pressure. Increased mass of diseased lung (at right) causes in increased superimposed pressure, which, in turn, leads to a “gas squeezing” from the most dependent lung regions. Superimposed pressure is expressed as cm H2O (Reproduced from Gattinoni et al. (2001) with permission of the American Thoracic Society. Copyright © American Thoracic Society)

Fig. 14.11
Inhomogeneity in the ventral-dorsal axis revealed by CT scanning. Anteroposterior chest X-ray (panel a) and single-slice CT scan (panel b) from a 3-week-old ventilated infant with surfactant protein B deficiency. The chest X-ray shows diffuse reticulogranular opacification, reflecting the pan-alveolar nature of the disease. The CT shows the inhomogeneity of lung expansion in the anteroposterior axis, with dependent atelectasis largely attributable to superimposed pressure
14.2.1.2 Measurements of CT Densities
CT imaging has allowed not only delineation of the morphological pattern of pulmonary densities but also a quantitative analysis of lung aeration and its alteration during ventilatory manoeuvres. The value of CT in this regard is the use of the Hounsfield unit (HU) scale (Fig. 14.12), which allows a gas to tissue ratio and gas volume to be derived for each voxel (CT volume unit) within an axial slice and also allows the lung to be separated into aeration “compartments” (Fig. 14.12). An aeration compartment is the cumulative sum of all lung units in the CT slice having Hounsfield scores within a predefined range: non-aerated (−100 to +100 HU), poorly aerated (−100 to −500 HU), normally aerated (−500 to −900 HU) and hyperinflated (−900 to −1,000) (Gattinoni et al. 2001; Vieira et al. 1998). This information can be represented graphically in a CT histogram (Fig. 14.13), allowing the differences in aeration compartments to be highlighted in a normal and diseased lung.
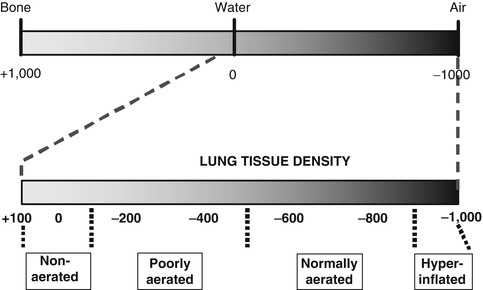
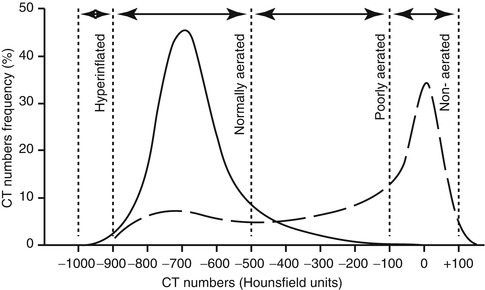

Fig. 14.12
The Hounsfield unit scale. The complete span of values from bone (+1,000) through water (0) to air (−1,000) is shown at top, and below, the range of values found in the normal and diseased lung. The lung parenchyma in a CT slice can be identified on the basis of Hounsfield scores as being non-aerated (+100 to −100), poorly aerated (−100 to −500), normally aerated (−500 to −900) or hyperinflated (−900 to −1,000)

Fig. 14.13
CT histograms. Representative CT histograms from the normal lung (solid line) and a ventilated patient with acute respiratory distress syndrome (ARDS) (dashed line). Lung compartments, as defined by CT numbers, are indicated by the dotted lines. Note the predominance of non-aerated lung in the CT histogram in ARDS (Redrawn from Gattinoni et al. (2001) with permission of the American Thoracic Society. Copyright © American Thoracic Society)
Quantitative CT scanning has been used to measure changes in aeration compartments with ventilatory manoeuvres (Vieira et al. 1998; Crotti et al. 2001; Pelosi et al. 2001a; Albaiceta et al. 2004; Gattinoni et al. 2006; Lu et al. 2006; Pellicano et al. 2009). From these, much information has been gained about the nature of, and potential for, lung recruitment (Crotti et al. 2001; Pelosi et al. 2001b; Caironi et al. 2010), and the distribution of opening and closing pressures of lung units have been plotted (Crotti et al. 2001; Pelosi et al. 2001b). The impact of changes in ventilatory strategy has been demonstrated, including both the resolution of atelectasis at higher PEEP levels (Fig. 14.14) and the potential for overdistension (Vieira et al. 1998). This information has aided considerably in the understanding of application of ventilation to the diseased lung.
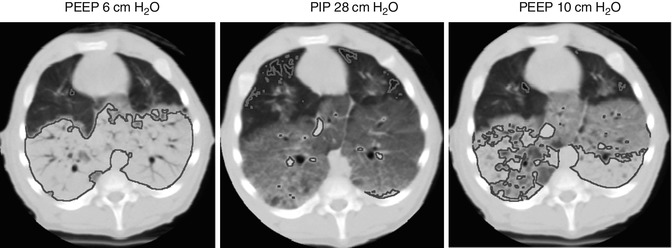

Fig. 14.14
Extremes of regional aeration during mechanical ventilation. Supra-diaphragmatic axial CT images in a 5 kg piglet with lung injury after repeated saline lavage. Areas of non-aerated lung (+100 to −100 HU) are traced in blue, and areas of hyperinflation (−900 to −1,000 HU) in red. At a PEEP of 6 cm H2O, 53 % of the voxels are non-aerated, and only 0.15 % are hyperinflated. After a tidal inflation to a PIP of 28 cm H2O, very little non-aerated lung remains (2 %), but there is demonstrably more hyperinflation (2.5 % of all voxels). Ventilation with a PEEP of 10 cm H2O results in considerable improvement in end-expiratory collapse (22 % non-aerated), with minimal effect on hyperinflation (0.43 %)
14.2.1.3 Limitations of CT Scanning
CT scanning has not been used in ventilated neonatal and paediatric subjects solely for the purpose of evaluating lung aeration and recruitment potential. This is chiefly because of concerns regarding radiation exposure (Mayo et al. 2003), although, with the advent of low-dose thin-section CT, the radiation dose may be 5–10 % of that with conventional CT imaging. Other limitations are lack of availability of CT scanning time and the difficulties and risks of transfer of ventilated neonatal and paediatric subjects to the CT scanning suite. For these reasons, it is unlikely that CT imaging will become widely used as a tool for evaluating regional lung inflation in this group. As discussed elsewhere in this text, there is potential for electrical impedance tomography to give similar information at the bedside of a ventilated subject, and experience with this form of imaging is growing (Frerichs et al. 2001a).
14.2.2 Magnetic Resonance Imaging
The use of magnetic resonance (MR) imaging of the lung parenchyma is essentially limited to quantification of lung water content and its spatial distribution, using proton density-weighted images. Given the relative lack of fat and other hydrogen-bound complexes in the lung, there is a direct relationship between proton density and lung water content. Studies in experimental animals (Schmidt et al. 1986; Viard et al. 2008), as well as human adults (Mayo et al. 1995) and preterm infants (Adams et al. 2002), have confirmed that MR imaging can quantify the water content of the lung and indicate its distribution. A measurable increase in water content has been demonstrated in animals with experimental pulmonary oedema (Schmidt et al. 1986). Gravity-related maldistribution of lung water, with higher water content in the dependent regions, has been observed on MR imaging (Adams et al. 2002). Clearance of lung liquid after birth has been measured in preterm lambs using the technique (Viard et al. 2008).
Stay updated, free articles. Join our Telegram channel

Full access? Get Clinical Tree


