The equation explains the interaction of between the patient’s generated pressure, P mus, and the ventilator’s generated pressure, P appl. These pressures overcome the resistance (R rs) and elastance (E rs) of the respiratory system. In this equation, inertia is negligible, especially in pediatric patients. This interaction is complex and involves numerous feedback pathways. For example, respiratory muscles are affected by the force-length and force-velocity relationship causing a mechanical feedback to the patient’s motor center and spinal nerves from receptors in the airway, chest wall, or respiratory muscles; this has been described as the reflex feedback (Kondili et al. 2003). This relationship between the muscle feedback and reflex feedback is not well studied in mechanically ventilated pediatric patients, especially neonates, where the immaturity of the receptors, controllers, and muscle response may impact these relationships. The variables that can potentially impact the patient-ventilator interaction are also complex and include patient and ventilator factors and the patient’s feedback system. These interactions create a response loop that is affected by this interaction between ventilator (controllers of the ventilator breath, including trigger, gas delivery, and how the breath is terminated) and patient factors (mechanics of the respiratory system and muscular response), which cause a volume change with time, affecting the patient’s muscular response, which in turn is affected by the force-muscle and force-velocity relationship of the respiratory muscles. This volume-time profile influences the patient’s feedback system (chemical, mechanical, reflex, and behavioral) that then determines the muscular response of the patient’s to the ventilator breath. The final influence on these interactions involves the clinician and his choice of the trigger, mode of ventilation, and level of support. Our discussion on monitoring the interaction of spontaneous respiration and mechanical inflation will focus on the identification of asynchrony between the patient controller and the ventilator.
15.2 Response of the Ventilator to Patient Effort
Factors affecting the response of the ventilator to the patient can be subdivided into the ventilator factors affecting the initiation of the breath (trigger variable), how the breath is sustained (gas control variable), and how the breath is terminated (cycle off criterion). Patient-related factors include the mechanics of the patient’s respiratory system and characteristics of the patient-generated muscular response or pressure generated by the patient’s respiratory muscles or P mus. As can be seen in Fig. 15.1, the pressure generated when a patient is spontaneously breathing while receiving positive pressure ventilation is the sum of the pressure generated by the patient’s respiratory muscles (P mus) and that generated by the ventilator (P applied). The proportion of each of these pressures is dependent upon the patient’s respiratory drive, mechanics, and muscular response, the ventilator’s trigger characteristics, and the selected ventilator mode. The mode is dependent upon the control, phase, and conditional variables. Our discussion will first focus on patient and ventilator characteristics followed by a review of when there is inability of the patient and ventilator controllers to act synchronously.
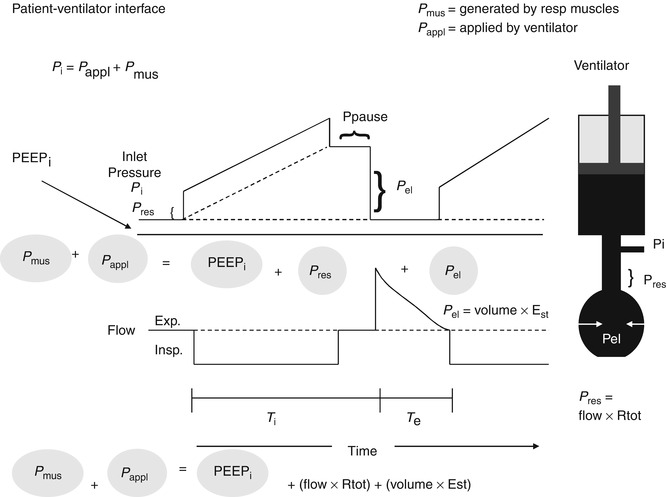
Fig. 15.1
The model on the right is of the respiratory system with the resistive elements represented by the straight tube and the elastic elements represented by the balloon connected to a ventilator represented as a piston. During inflation with a constant flow demonstrated in the lower waveform, there is a stepwise increase in the inlet pressure (P i) that equals the loss of pressure across the resistive elements (P res). Thereafter, P i increases linearly and reflects the mechanical properties of the elastic elements (P el). P i is the sum of P res and P el. P res is the product of the total resistive components and flow. P el is the product of the volume delivered and elastance of the respiratory system. At the end of inspiration, when flow has ceased which reflects the pressure at P pause (insp. pause), P i decreases by an amount equal to P res, P i equals P el during Insp (Modified from figure used with permission from Hubmayer et al. (1990))
15.2.1 Ventilator-Related Factors
The response of the ventilator to a patient’s effort is influenced by ventilator variables including the trigger variable that initiates the breath, pressure delivery, and the cycle variable that terminates the breath.
15.2.2 Trigger Variable
The trigger variable is controlled by either a flow or pressure signal derived from the airway. Figure 15.2 illustrates a comparison of two trigger variables. For pressure triggering, the patient must decrease the pressure in the ventilator circuit, by an isometric contraction of the respiratory muscles, to a preset value to completely open the inspiratory valve and initiate a mechanical breath. In flow triggering, the patient must generate a change in flow, sensed between the ventilator’s inspiratory and expiratory pneumotachographs, by an isotonic contraction of the respiratory muscles. It has been generally believed that there are distinct advantages of flow triggering (Carmack et al. 1995; Branson et al. 1994; Giuliani et al. 1995; Sasson et al. 1994; Heulitt et al. 2000, 2003; Sanders et al. 2001). However, current ventilators are microprocessor controlled, replacing mechanical responses to patient triggering seen in older generation ventilators. The result of the microprocessor controller is a faster response time with decreased trigger delay. This improvement may negate the advantages in adult patients with larger endotracheal tubes and mature respiratory muscles. This does not appear to be true in neonatal and pediatric patients. As can be seen in Fig. 15.2 (Sanders et al. 2001), flow triggering results in a faster response time and decreased effort necessary to trigger in a pediatric-sized animal model during pressure support ventilation. These differences are important because during triggering, the initial phase of patient effort reflects essentially patient work until the inspiratory valve opens completely and delivers gas to the proximal airway. This is illustrated in Fig. 15.3, where a tracing of pressure, flow, and volume is recorded at an animal’s airway during pressure support. In this example, there is a waveform illustrating the opening and closing of the inspiratory valve with a tracing of the animal’s muscular response, illustrated by an EMG tracing of the diaphragm. In a study of pediatric-sized lambs, WOB during flow triggering was reduced by 47 % during pressure support and 19 % in CPAP (Carmack et al. 1995). However, there have been no controlled studies in pediatric and neonatal patients to determine if these differences affect outcome measures such as length of ventilation.
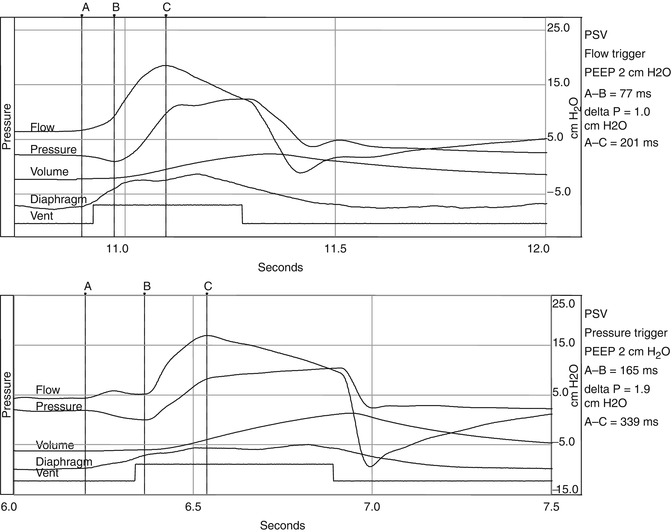
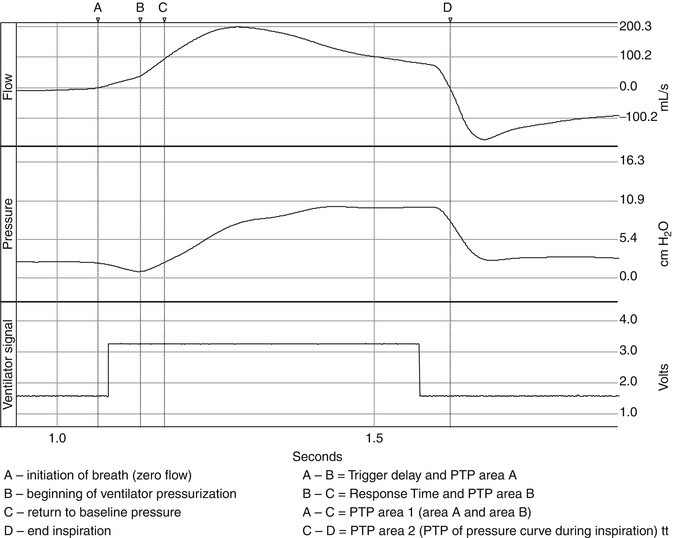
Fig. 15.2
Represents two waveforms. The upper waveform represents a single breath of a spontaneously breathing animal on pressure support being flow triggered. The bottom waveform represents a pressure-triggered breath. The negative pressure generated by the animal during triggering of the pressure-triggered breath is almost double of the pressure necessary to trigger the flow-triggered breath. Also there is evidence of increased trigger delay in the pressure-triggered breath. A initiation of breath, B most negative pressure, C peak flow
Fig. 15.3
Waveforms of flow, pressure, ventilator signal, and diaphragmatic (edi) signal are displayed. A is the begging of the edi signal, B the initiation of the breath where flow is a zero, C is the peak inspiratory flow, D the end of the edi signal. From point B to C, the line represents the slope of the inspiratory flow
It is important to note that despite the differences illustrated in the type of triggering, there are also differences related to the design characteristics of the ventilator. These differences relate to ventilator control algorithms that can affect trigger delay. Trigger delay is the time from the beginning of inspiratory muscle activity and the beginning of mechanical inflation (increase in pressure at the proximal airway). Increased trigger delay has been associated with the design characteristics of the pneumatics and electronics of ventilator system and correlated with respiratory drive (Leung et al. 1997) more time to trigger with less drive. This is especially important in small preterm infants, who have intrinsically short inspiratory times. For instance, if the inspiratory time is 0.2 s and the trigger delay is 100 ms, the patient will be halfway through the inspiratory phase before mechanical assistance is appreciated.
In a study between two microprocessor-controlled neonatal ventilators, it was found that there was a significant difference in trigger delay and work of breathing between these two ventilators (Heulitt et al. 2000) illustrating the role of ventilator design on both work of breathing and triggering. Once triggering occurs, there is pressurization of ventilator circuit and subsequently the patient.
15.2.3 Factors Affecting Pressure Delivery
Control variables include pressure, flow, and volume. Once the trigger variable is met and the inspiratory valve opens fully, there is pressurization of the ventilator circuit by the delivery of fresh gas flow. This pressurization of the system is illustrated in Fig. 15.4. The phase of this pressurization can be subdivided into the inspiratory positive pressure area or area 2 on Fig. 15.4 (Chatmongkolchart et al. 2001), which follows area 1, and is the amount of effort expended to activate the mechanical breath. Area 2 is defined by the start of the inspiratory pressure curve with the return of pressure to baseline and ending at the onset of expiration. Area 2 represents the ability of the ventilator to pressurize the system or the actual area of pressure versus time applied during inspiration. The variables that control the delivered pressure depend upon the mode of ventilation and the controller utilized in that mode. For example, in a mode with a preset tidal volume (e.g., volume assist-control), upon triggering the ventilator operates under a preset flow-time profile for the delivery of the tidal volume, and the ventilator determines the mechanical inflation time. In contrast, in a mode where there is a preset pressure (e.g., pressure support ventilation), the inflation time is influenced by both the patient and the ventilator. MacIntyre et al. (1990) demonstrated that if a rise in flow is not commensurate with the patient’s demand during pressure support ventilation, there may be a too rapid rise in flow, or flow may be inadequate to meet the patient’s effort. In either case patient-ventilator asynchrony can result. Current ventilators also have dual control capability. Some modes (e.g., PAV, PRVC, VS) offer a theoretical compensation for these limitations. Breaths are regulated by one variable to meet a target variable. For example, in PRVC, the clinician sets a target volume and then regulates the delivered pressure between each breath to reach that volume target. In contrast, in PAV the ventilator delivers pressure that is proportional and set by the clinician to instantaneous flow and volume and thus the patient’s own P mus. Thus, depending upon the mode, it may or may not reflect corresponding changes in patient’s effort.
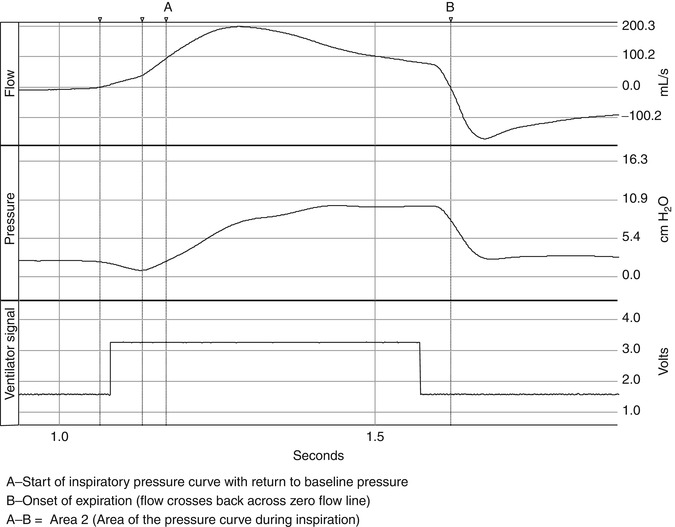
Fig. 15.4
The pressurization of the respiratory system is illustrated in the figure. The phase of this pressurization can be subdivided into the inspiratory positive pressure area or area 2 in the figure (Chatmongkolchart et al. 2001), which follows area 1, and is the amount of effort expended to activate the mechanical breath. Area 2 is defined by the start of the inspiratory pressure curve with the return of pressure to baseline and ending at the onset of expiration. Area 2 represents the ability of the ventilator to pressurize the system or the actual area of pressure versus time applied during inspiration
15.2.4 Cycle Off Variable
The cycle off variable is the variable that controls the end of inspiration. This can be a clinician-controlled variable. As can be seen in Fig. 15.5, the timing of this trigger signal may not correspond to the end of neural inspiration and the peak of diaphragmatic activity or contraction of inspiratory muscles after the close of the inspiratory valve. Thus, if flow stops either before or after the patient’s own inspiratory flow, expiratory flow occurs before the end of inspiratory effort. In this situation, P mus continues to increase even though inspiratory flow is zero (inspiratory valve closed) or is revered, and the muscle tension is applied to the elastic recoil of the respiratory system rather than obtaining further inspiratory flow. Thus, at the end of mechanical inspiration, P mus continues to increase the muscle tension applied to overcome elastic recoil of the respiratory system causes a short mechanical inflation and low elastic recoil at end-inspiration and can promote re-triggering or ineffective triggering. The effects of asynchrony depend on the type of asynchrony present (Georgopoulos and Roussos 1996) and will be discussed further below. In the newborn, use of flow cycling is important in achieving expiratory synchrony because of the rapidity with which the respiratory time constant can change.
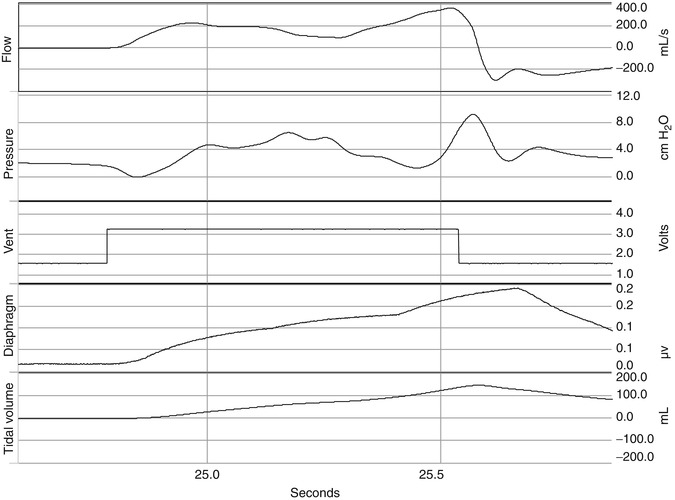
Fig. 15.5
Signals for flow, pressure, ventilator trigger, diaphragm EMG, and delivered tidal volume are displayed. The timing of this trigger signal may not correspond to the end of neural inspiration and the peak of diaphragmatic activity or contraction of inspiratory muscles after the close of the inspiratory valve. Thus, if flow stops either before or after the patient’s own inspiratory flow, expiratory flow occurs before the end of inspiratory effort. In this situation, P mus continues to increase even though inspiratory flow is zero (inspiratory valve closed) or is revered, and the muscle tension is applied to the elastic recoil of the respiratory system rather than obtaining further inspiratory flow. Thus, at the end of mechanical inspiration, P mus continues to increase the muscle tension applied to overcome elastic recoil of the respiratory system which causes a short mechanical inflation and low elastic recoil at end-inspiration and can promote re-triggering or ineffective triggering
15.2.5 Patient-Related Factors
15.2.5.1 Mechanics of the Respiratory System and Characteristics of P mus Waveform
Factors that affect flow because of the mechanical properties of the respiratory system and tubing can affect the pressure delivered by the ventilator (P aw) independent of P mus and may lead to asynchrony. This is usually seen when there is dynamic hyperinflation, where ineffective triggering, increased trigger delay, or prolonged inflation are common.
However, the pattern of the P mus waveform can affect P aw in several ways, depending upon factors related to both the patient and the ventilator. If the patient has decreased drive, P mus increases slowly, and the time between the onset of the patient’s inspiratory effort and ventilator triggering increases, causing trigger delay with subsequent asynchrony. In contrast if the patient’s inspiratory effort is vigorous and longer than mechanical inflation time, double triggering can occur.
15.2.5.1.1 Response of the Patient Effort to the Ventilator-Delivered Breath
Normal reflex responses to changes in chemical, mechanical, or receptor stimulation may cause physiologic changes that may be difficult to interpret by the clinician. For example, it is important to understand the role that mechanical feedback plays in the patient’s response to a mechanically delivered breath. The mechanical feedback is related to the delivered lung volume (length of muscular contraction) and flow (velocity of the contraction) delivered. Thus, when lung volume and flow are greater, P mus will be less. The exact role of mechanical feedback is not well understood and may play only a small role in patient-ventilator interactions, but in a situation of high ventilator demands with hypercapnic hyperventilation, P mus may underestimate neural output to respiratory muscles and can be reduced by up to 15 % (Georgopoulos and Roussos 1996).
Another feedback mechanism involves the response of the respiratory system to PaO2, PaCO2, and pH or chemical feedback. In normal subjects in both wakefulness and sleep, chemical feedback determines respiratory motor output. In mechanical ventilation, it is theorized that neuromuscular output is tightly linked to carbon dioxide tension and not to load reduction on the respiratory system (Georgopoulios 1997). Thus, during mechanical ventilation, chemical feedback remains an important determinant of P mus. However, these effects may differ substantially between wakefulness and sleep or sedation during mechanical ventilation.
During mechanical ventilation in a subject who is conscious, the effects of PaCO2 cause an increased P mus (respiratory effort) with no change in respiratory rate. However, respiratory rate increases if PaCO2 increases considerably. In contrast, when the drive to breathe from wakefulness is reduced during sleep or sedation, the dependence of the respiratory rhythm upon PaCO2 is increased (Skatrud and Berssenbrugge 1983; Younes 1989). Thus, any increase in V T may induce periodic breathing and apnea. In patients with lung diseases such as pneumonia or ARDS, other inputs to the respiratory controller may prevent chemical feedback from diminishing the tendency to increase neural inspiratory time and decrease neural expiratory time to a greater extent, resulting in a higher breathing frequency.
Stay updated, free articles. Join our Telegram channel

Full access? Get Clinical Tree


