Fig. 8.1
transvaginal ultrasound of a T-shaped uterus in the sagittal plane (a), the transversal plane (b) and the coronal plane (c)
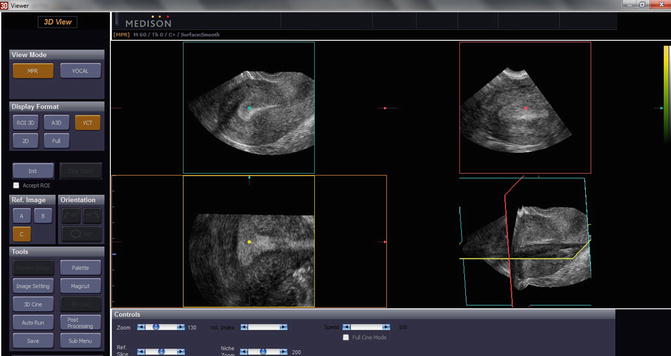
The image volumes can be examined in different modes: three perpendicular planes are depicted on one screen next to the 3D image, of which the ‘box’ can be defined during examination. By rotating the three perpendicular axes (x, y and z) and scrolling through the reference slices the examiner can visualize the region of interest in every possible plane (Fig. 8.2). In the rendered (not directly scanned) planes there is some loss of resolution. Multislice technology enables the ultrasonographer to perform a tomographic analysis of the images. To measure volumes the Virtual Organ Computer-aided Analysis (VOCAL) software is used, which is explained elsewhere in this chapter. In obstetrics the use of 3D US is popular because of the surface mode, which enables visualizing the fetal face.
Although in gynaecology solid proof of the additional value of 3D US is lacking, there is some evidence that submucous fibroid classification is more accurate in 3D than in 2D [13, 14]. Given the unfamiliarity of gynaecologists with retrospective 3D image analysis it is important to formulate strict criteria on interpretation in order to improve reproducibility and accuracy [15].
Power Doppler
The changing wavelength of sound from a moving surface or reflected by it is discovered by Andreas Doppler in 1842, a phenomenon which is named after him. In this way vessels can be visualized and characteristics of fluid flow can be evaluated. Two parameters can be measured in Doppler ultrasound (PDUS): the wavelength shift and the amplitude (power). Measurement of the wavelength shift expresses the velocity and the direction of the beamed particles, e.g. blood cells, while the amplitude expresses the volume of the moving particles. By measuring the velocity in the pulsating blood flow the resistance in a vessel can be assessed as well as the related pulsatility. Moving pixels are depicted in colour, where the colour represents the direction and the velocity of flow. The flow characteristics such as resistance index, pulsatility index and peak systolic velocity of single vessels can be measured (Fig. 8.3). In Power Doppler Ultrasound (PDUS) the processor time consuming wavelength shift is not calculated and movement is only visualized in terms of amplitude, which expresses the intensity of flow. PDUS is more sensitive in detecting blood flow in small vessels and is increasingly used to assess vascularity in tumours, also in gynaecology.
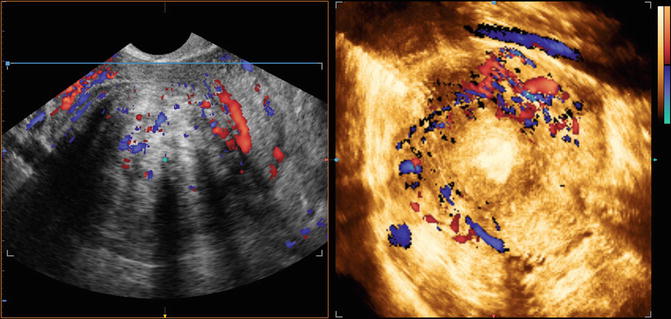
Fig. 8.3
Vessels around a fibroid with ultrasound greyscale combined with colour doppler
3D Power Doppler Ultrasound
In three dimensional Power Doppler (3D PD) moving particles are depicted in colour and the intensity (amplitude) of flow is measured in a sampled volume of the region of interest. The coloured flow in the vessels enables the sonographer to evaluate the vessel pattern which can be related to the nature of the tumour. Moreover, by dividing the colour voxels (smallest ultrasound volume unit) by the total number of voxels, 3D PD estimates the vascularity and intensity of flow in the tissue expressed as vascularity index (VI), flow index (FI) and vascular flow index (VFI) [16]. The conventional power Doppler which is based on echo amplitude, allows better visualization of low flow than colour Doppler, but there are still blooming artefacts. To circumvent these disadvantages a new Doppler ultrasonographic technique, known as high-definition flow (HDF), has recently been introduced [17]. HDF has the potential benefits of better axial resolution, fewer blooming artefacts, and improved sensitivity to small vessels compared with colour and power Doppler. The main aspect of HDF is the use of short broadband pulses, which considerably improves the axial resolution. Recent software improvements allow calculation of these 3-dimensional (3D) indices using HDF rather than power Doppler imaging [18]. The validation of 3D PD is under way, but not self-evident. Differences in systolic and diastolic blood flow, the ultrasound machine settings (e.g. gain) and the definition of the region of interest all affect the reliability and validity of the measurements [18].
Saline or Gel Infusion Sonography (SIS or GIS) or Sonohysterography
In order to enhance contrast of the uterine cavity with the endometrial lining, the cavity can be instilled with saline or gel. The surface of the cavity is clearly depicted and the diagnostic accuracy of SIS in detected focal lesions such as polyps and fibroids is comparable with that of hysteroscopy [19]. In addition SIS has the advantage to look into the myometrial wall and gives more information about other (uterine) abnormalities. In transvaginal 2D scanning it has been shown that the intracavitary position of fibroids can be overlooked if compared with SIS [20]. Recently the saline was replaced by gel which sustains the distension of the uterine cavity for at least 10 min [21]. The 3D SIS of the uterine cavity enables thorough inspection of the cavity wall and is referred to as ‘virtual hysteroscopy’ [22] (Fig. 8.4).
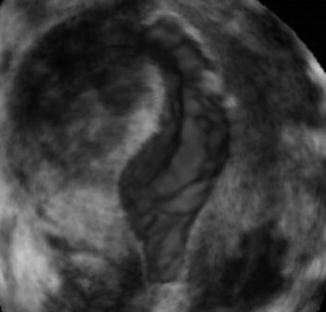
Fig. 8.4
3D image of saline infusion sonography (SIS) in uterus with submucous fibroid
Contrast Enhanced Ultrasound (CEUS)
As power Doppler is not able to pick up blood flow in vessels below 2 mm diameter, it is not suitable to estimate micro vascularity in the tissue. To assess micro vascularity the CEUS technique, although still experimental, is more appropriate [23]. In CEUS imaging micro bubbles contrast agents are injected intravenously. The micro bubbles measure 2–6 μm, have a wall thickness of 10–200 nm are filled with gas (perfluorocarbon or sulphur hexafluoride). After rupture of the micro bubbles the gas is exhaled after 10–15 min, while the shell components are metabolised by liver or kidney. By high-transmit-power insonation the micro bubbles can be destructed. Progressive refilling of the imaged volume is used to discriminate between contrast and tissue.
The results of CEUS in fibroid imaging are preliminary and show a possible beneficial effect evaluating and optimizing treatment effect of fibroid ablation or uterine artery embolization [24, 25]. Also CEUS may help to discriminate leiomyosarcomata from fibroids [26] (Fig. 8.5).
Fig. 8.5
Contrast Enhanced UltraSound (CEUS) of 7-cm symptomaticuterine fibroid. (a) B-mode ultrasound shows a hypoechoic mass in the uterus. (b) CEUS confirms rich vascularization inside the mass. (c) B-mode US 6 months after percutaneous RFA: the treated fibroid appears nonhomogeneous and reduced in size. (d) CEUS confirmed a huge area of necrosis with a peripheral rim of enhancement in a normal uterus without any residual disease [71] (With kind permission from Springer Science + Business Media)
Elastography
Elastography, first described by Ophir in 1991 [27], estimates differences in tissue stiffness or elasticity and could therefore be considered as image guided palpation. In physics the elasticity is expressed as Young’s modulus (stress/strain). However in ultrasound elastography only strain is measured as the applied stress within the tissue is more or less the same. Strain is the distance between two positions of a predefined point in the tissue with and without compression. Compression is generally applied with the ultrasound probe, although also pulsating vessels or a vibro-acoustic stimulus may be used as a compression source. A color, according to the registered strain, is overlaying the ultrasound grayscale image. In this way it is comprehensible that a stiff nodulus becomes visible (dark or blue) in soft fatty tissue (yellow or red). Promising results have been reported in abnormalities in assessment of tumors in the breast, the prostate and the liver. In gynaecology elastography is reported in patients with fibroids, adenomyosis and cervical cancer [28, 29]. Elastoscanning may particularly be useful in patients with presumed fibroids, since it can depict number, outline and relation of the fibroid to cavity and serosal surface, making the fibroid classification more reliable (Fig. 8.6).
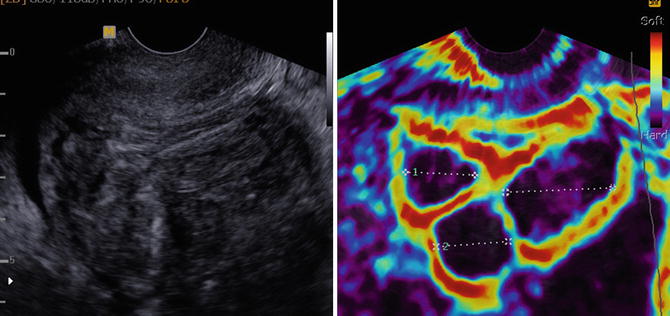
Fig. 8.6
Uterus with three fibroids visualized by elastography and greyscale ultrasound
Drawback of the technique is the lack of standardization or calibration as it is impossible to deliver the same amount of compression during examination. This makes it impossible to compare elastographic results between different sessions in the same patient or between patients.
Magnetic Resonance Imaging (MRI) Scan
A good description of how Magnetic resonance imaging (MRI) works is published by Berger [30]. MRI uses the body’s natural magnetic properties to produce detailed images form any part of the body. For imaging purposes the hydrogen nucleus (a single proton) is used because of its abundance in water and fat. The patient in the MRI is placed in a strong magnetic field which creates a magnetic vector as all protons’ axes line up. Additional energy (radio wave) causes the hydrogen nuclei to resonate. When the radiofrequency source is switched off, the magnetic vector returns to its resting state which causes emission of a radio wave signal. This signal is used to create MR images. Two types of MRI are used depending on the tissue, T1 and T2 where T1 produces signal intensity of fat and blood and T2 of fluid and mucus. As Computed (Axial) Tomography (C(A)T) scan is able to produce a scan in several minutes visualizing bony structures as well as soft tissues, the MRI shows much higher detail in soft tissue imaging and is used in brain, spinal cord, tendons and ligaments and the pelvic organs. In gynaecology MRI is particularly useful for depicting fibroids, endometriosis and adenomyosis.
Positron Emission Tomography (PET) Scan
In a PET scan a gamma probe measures the positron emission of the tissue and visualizes it. Hereto a radionuclide is injected. A radionuclide is a radioactive tracer tagged to a natural chemical, such as glucose, water or ammonia. The natural chemical is selected for its metabolization in the tissue of interest. As malignancies in general consume much glucose, the radionuclide fluorodeoxyglucose (FDG) is used for the depiction of the malignant tissue. The gamma radiation is produced when the radionuclide is broken down by emitting the positrons. The computer analyses the gamma rays and uses the information to create an image map of the organ or tissue being studied. In modern machines the 3D PET images overlay a CT scan to properly localize the structure of interest. PET scanning is used to rule out or monitor treatment of brain disorders as neoplasms, Alzheimer’s disease, Parkinson’s disease, but also disseminated cancer and to assess myocardium perfusion.
Also in gynaecology PET scanning is used e.g. in order to identify the nature of uterine tumours [31].
Diagnosis of Fibroids
Especially in case of intended conservative treatment of fibroids with medication, ablation or myomectomy or in case of intended morcellation, it is important having ruled out leiomyosarcoma or Smooth Muscle Tumour of Uncertain Malignant Potential (STUMP). As it is the professional standard to remove malignant tumours completely, it is not in the interest of cure to offer minimal invasive or conservative treatment of suspect lesions. Also the distinction between fibroid and adenomyoma is essential information because the latter is ill defined and can usually not be removed surgically without severe damage to the uterus. Imaging of the fibroids will therefore contribute to the proper diagnosis.
Leiomyosarcoma and STUMP
Uterine sarcoma is a mesenchymal tumor that can originate from smooth muscle cells (leiomyosarcoma) or from endometrial stroma (mixed Müllerian tumor or endometrial stroma sarcoma). The leiomyosarcoma (LMS) may appear similar to the leiomyoma (fibroid) and is therefore a confusing element in the diagnosis of fibroids. In general it was hypothesized that LMS is not originating in a fibroid but develops from a primary malignant cell line, but recently four cases of LMS originating in a normal fibroid were reported [32]. The risk of finding a sarcoma in a presumed fibroid ranges from 0.2 to 0.49 %. See Table 8.1 [33–37].
Table 8.1
Prevalence of sarcoma in presumed fibroids
Author | Year | No. of fibroids | No. of sarcomas | % |
|---|---|---|---|---|
Seki | 1992 | 1,886 | 7 | 0.37 |
Parker | 1994 | 1,332 | 1 | 0.23 |
Leibsohn | 1999 | 1,492 | 7 | 0.49 |
Seidman | 2012 | 1,091 | 2 | 0.2 |
The most important criterion in the diagnosis of LMS is the number of mitoses found in active parts of the smooth muscle tumor. A common cut off level is over 5 mitoses in 10 high power (400×) fields [32, 38]. Other common characteristics of LMS are tissue necrosis, nuclear pleomorphism and vascular invasion. Patients with LMS are more often older and have larger tumours which are mostly solitary compared to patients with fibroids. Rarely the diagnosis is made with endometrial tissue sampling, but only so in case of abnormal uterine bleeding. Contrary to common belief, rapidly growing uterine tumours bear no additional risk of LMS as was reported by Parker in 1994 [35].
Ultrasound greyscale imaging of potential LMS is focussed on the lesion’s margins and the presence of lacunae, which is a sign of necrosis (Fig. 8.7a). With these criteria up to 95 % of cases was reported to be detected [39]. The 2D power Doppler criteria pulsatility and resistance index and the peak systolic velocity, though changed in sarcomata, seem to have poor prognostic value [40]. However the finding of increased periferal and central vascularisation resulted in high sensitivity (100 %) at the cost of specificity (88 %), resulting in a high negative predictive value (100 %) and a predictive value of a positive test of 18 % [41] (Fig. 8.7b). The 3D PD has not yet been studied in the distinction between LMS and fibroids, but in a recent report the vascular indices correlated with cellularity in the fibroid, which may be associated with LMS and STUMP [43].
Fig. 8.7
(a) Greyscale ultrasound scan of uterus with leiomyosarcoma. The endometrial thickness is measured between the markers. 1 and 2 show the measurement of both endometrial layers. Besides fluid in the uterine cavity several lacunae can be seen. (b) Ultrasound greyscale image of leiomyosarcoma (same patient as in a) with color doppler. Note the abundant vascularity of the LMS, which is highly unusual in leiomyomas. (c) MRI image of large leiomyosarcoma with areas of necrosis (by courtesy of Thierry van den Bosch)
The value of MRI in the diagnosis of LMS is well established although absolute certainty cannot be achieved. As the incidence of LMS is low, most clinical studies of the diagnostic accuracy of MRI are underpowered. In general LMS shows more high signal areas on the T2 (Fig. 8.7c) than fibroids and a characteristic of LMS is the well demarcated, unenhanced pockets in dynamic MRI with the use of contrast. This feature was seen in 9/12 patients with LMS or STUMP and in 0/12 patients with fibroids [43].
The Positrone Emission Tomography has a place in the diagnostic armentarium of presumed fibroids. In PET scanning a radionuclide (tracer) on a biologically active molecule is visualized. In imaging of fibroids usually fluodeoxyglucose (FDG) is used, but also other molecules, such as deoxyfluorothymidine (FLT) or alphafluorobetaoestradiol (FES) have been reported. In general the uptake of FDG in a fibroid is associated with the estrogen status, cellularity and the presence of malignancy. The result of the PET-scan is displayed in a three dimensional image, often combined with a CT overlay and expressed in Standard Uptake Value (SUV) (Fig. 8.8). In one study the mean SUV in fibroids was higher (1.39 ± 0.65) than in myometrium (1.24 ± 0.33) [44]. In another study [45] of 5 sarcomas the mean SUV was 4.5 ± 1.3. Generally a SUV of 2.0–3.0 is considered the cut off level for presumed fibroid becoming suspicious for sarcoma. FES may be more accurate in distinguishing LMS from fibroids than FDG, with an accuracy of resp. 93 and 81 % [46]. By calculating the rate between two different uptake molecules, e.g. FDG and FES, the test characteristics of PET can improve as well [47]. Only the retrospective study of Umesaki [45] compares different imaging techniques in case of suspected uterine sarcoma. Of the 5 sarcomata all were detected by FDG PET, 4 by dynamic MRI and 2 by Power Doppler ultrasound. Nevertheless, in case of clinical suspicion of uterine sarcoma the less invasive imaging modalities are first choice: grey scale ultrasound, dynamic MRI and PET. The role of image guided biopsies is not completely clear. Although the predictive value of a negative biopsy might be expected to be low because of the large area’s of necrosis, an excellent negative predictive value is reported using MRI guided needle biopsies and Bell’s classification on histology [48] with a cut off level of 2 [49]. No data are found on the possible spreading of sarcoma cells by multiple puncturing of the sarcoma.
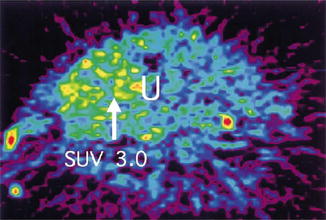
Fig. 8.8
PET scan of leiomyosarcoma. With a Standard Uptake Volume (SUV) of 3.0 (white arrow) malignancy has become more likely [44] (With permission from Elsevier)
Adenomyosis
Adenomyosis consists of endometrial glands in the myometrium that do not communicate with the uterine cavity. The endomyometrium is more hypoechoic than the periferal myometrium and is called the junctional zone. Diffuse adenomyosis is characterized by a thickened junctional zone (cut off level in general >12 mm) around the uterine cavity (Fig. 8.9). The uterine adenomyoma is a mass of focal adenomyosis not necessarily making contact with the junctional zone. The adenomyoma in particular may sometimes difficult to distinguish from the uterine fibroid as it has a similar appearance (Fig. 8.10). It may cause similar symptoms as heavy menstrual bleeding and features such as enlargement of the uterus and deformation of the uterine cavity. Adenomyosis is a common cause of failure of the endometrial ablation and of myomectomy if mistaken for a fibroid. It has been reported that 28 % of hysterectomy specimens in premenopausal patient contain adenomyosis [50, 51]. Patients with symptomatic adenomyosis have a high risk of hysterectomy and ideally the diagnosis should be made before any minimal invasive therapeutic attempt is undertaken.
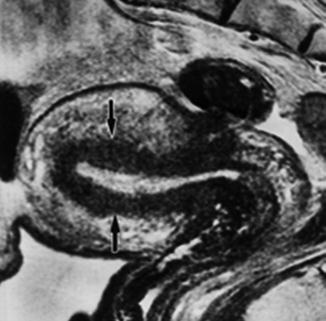
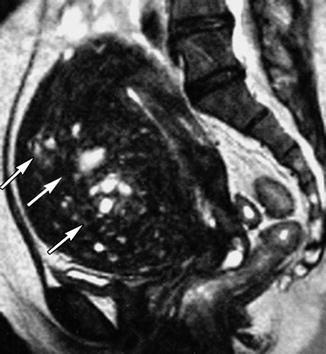
Fig. 8.9
T2 MRI of uterus with diffuse adenomyosis (black arrows)
Fig. 8.10
T2 MRI of uterus with focal adenomyosis in the anterior wall (white arrows)
No imaging technique can diagnose adenomyosis with absolute certainty. Ultrasound, including elastography and MRI however may demonstrate the different features of the adenomyoma and the fibroid.
The typical features in imaging of the uterine fibroid comprise a homogenous structure with circumscript smooth borders and often a round shape and a distinct vascular capsule, which is visible in power Doppler as well as in elastoscan as a soft rim. The vascularity within the fibroid – not in the capsule – is generally lower than in the myometrium. In contrast, adenomyosis in ultrasound imaging is characterized by ill-defined margins, by heterogeneity with typical hypoechoic striation caused by echogenic foci next to hypoechogenic elements formed by pockets of blood (‘lacunae’) [52, 53]. The shape is often not round but ellipsoid and there is little mass effect on the uterine cavity if any. The lesion is conjunct to the junctional zone that may be variably thickened if diffuse adenomyosis is present. In the coronal plane with 3D ultrasound a higher sensitivity for adenomyosis is reported (cut off level 8 mm) than in the sagittal and transversal plane in 2D ultrasound [54]. The myometrium is asymmetrically thickened [53] or the uterine configuration may be globular. With power Doppler (PD) ultrasound random like vessels are seen in the adenomyotic lesion as in the myometrium but in higher numbers. The use of intracavitary contrast with saline or gel may give more accurate information on the protrusion of the myometrial lesion and support the distinction of adenomyosis and submucous fibroids as the latter tend to protrude more into the cavity [55]. In elastography the amount of pressure applied by the probe affects the brightness and colouring of the acquired images. A steady state image should be obtained to interpret an elastography image. A steady state image of the ute‑rus is established when a clear delineation of the serosa is visible. Adenomyosis is in general softer than myometrium, visualized as several bright colours within the dark myometrium (i.e. bright yellow, green or light blue) (Fig. 8.11). While fibroids are clearly delineated, the shape of adenomyosis is irregular. The feasibility of elastography for the discrimination of intrauterine fibroids and adenomyosis, has been reported in literature [29, 56]. There are certain artefacts the examiner has to be aware of. A probe contact artefact is visible in most elastographic images and shows an illuminated area at the point of contact with the ultrasound transducer mimicking softer areas. This bright (yellow) area should not be confused with the presence of adenomyosis. Due to this artefact it is difficult to study the existence of adenomyosis in the low anterior part of the uterus.
Fig. 8.11
Retroflected uterus with adenomyosis in the anterior wall demonstrated by greyscale and elastography
In case of excessive pressure or movements of the uterus bright colours will appear in the image defined as movement artefacts. Various bright colours on different locations can be induced even in normal myometrium resembling the appearance of adenomyosis. Both the arcuate plexus and the AV malformations are visible with power and colour Doppler and should not be confused with adenomyosis [28, 56, 57].
In those studies that compare transvaginal ultrasound and MRI in the diagnosis of adenomyosis no significant difference in diagnostic accuracy could be demonstrated [58, 59].The sensitivity and specificity are ranging from 70 to 89 % resp. 65 to 98 % in both techniques. The area under the curve (AUC) for the diagnostic performance of MRI in the detection of myomas and adenomyosis is reported 0.81 and 0.73, respectively [57].
Stay updated, free articles. Join our Telegram channel

Full access? Get Clinical Tree


