Hematopoeisis
Charles T. Quinn
Because birth represents one temporal event in the development of the infant, the interpretation of the blood picture in the newborn requires an understanding of the maturational processes that precede it.
—Frank A. Oski, MD1
DEVELOPMENTAL CHANGES IN THE SITES OF BLOOD FORMATION
 YOLK SAC
The anatomic sites of hematopoiesis change during the development of the embryo and fetus (Fig. 429-1). Red blood cell (RBC) formation first occurs within the yolk sac at 2 weeks’ gestation. In this primitive phase of hematopoiesis, clusters of cells called blood islands form in the yolk sac. The peripheral cells of these blood islands differentiate to become the walls of blood vessels, whereas the central cells become primitive blood cells or hemocytoblasts. Similar blood islands are seen throughout the body stalk at 4 weeks’ gestation. This primitive, intravascular phase of hematopoiesis declines by 6 weeks’ gestation and is no longer observed after the third month.
 LIVER AND SPLEEN
Blood formation begins to shift to the sinusoids of the liver at the fifth week of gestation. The liver is the first site of definitive hematopoiesis where leukocyte precursors and megakaryocytes (platelet precursors) are also produced. Erythroid elements are the predominant cell type, however. The liver is the main site of hematopoiesis from the third to the fifth month of fetal life (Fig. 429-1) and declines thereafter, although continuing to produce blood cells until the first week of postnatal life. A smaller amount of definitive hematopoiesis also occurs in the spleen during this phase.
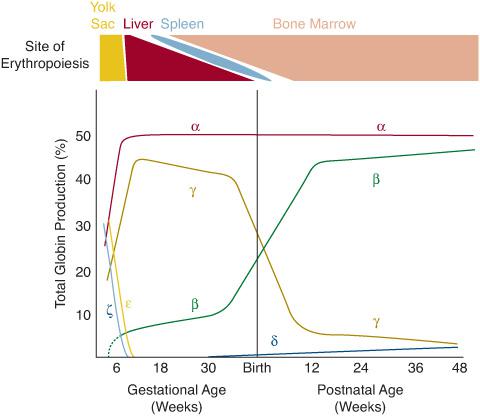
FIGURE 429-1. Production of blood and hemoglobin throughout development. Top: Changing sites of erythropoiesis throughout development. RBC formation starts in the yolk sac in the embryo. Erythropoiesis then transitions to the liver and, to a lesser extent, the spleen during fetal life. The bone marrow is the sole normal site of erythropoiesis from shortly after birth and throughout the remainder of life. Bottom: Simultaneous changes in globin production that occur as the site of blood formation changes. The main Hb of the fetus is Hb F (α2γ2). The predominant Hb after about 3 months of life is Hb A (α2β2).
 BONE MARROW
Hematopoiesis in the bone marrow begins in the third and fourth months of gestation, and it becomes the predominant site of hematopoiesis by the sixth month and remains so thereafter—throughout the rest of gestation and extrauterine life (Fig. 429-1). The bone marrow is also the site where significant myeloid hematopoiesis (production of white blood cells [WBCs] and platelets) begins. During the last trimester, most blood cells are produced in the marrow. The cellularity of the bone marrow becomes maximal at 30 weeks’ gestation. In the newborn and during early infancy, red or hematopoietic marrow fills the bony cavities of the entire axial skeleton, the long bones, and many membranous bones. With advancing postnatal age, hematopoietic tissue gradually moves to the vertebrae, sternum, pelvis, scapulae, and proximal ends of the long bones. The rest of the marrow space becomes fatty. 
RBC production in the bone marrow is regulated by the hormone erythropoietin. During fetal life and early in postnatal life, erythropoietin is produced mainly in the liver, but its production switches to the kidney after birth. Erythropoietin binds to a high-affinity receptor expressed on the surface of erythroid progenitors called burst-forming units–erythroid (BFU-E) and colony-forming units–erythroid (CFU-E) to induce their division and differentiation. The production of erythropoietin is regulated by the degree of tissue oxygenation. Decreasing tissue oxygenation increases erythropoietin production in compensation.
DEVELOPMENTAL CHANGES IN HEMOGLOBIN PRODUCTION
As the site of hematopoiesis changes from the yolk sac to the liver and to the bone marrow, there are simultaneous changes in the types of hemoglobin (Hb) that are produced by RBC precursors (Fig. 429-1). Hb is the oxygen-carrying protein within RBCs. It accounts for more than 95% of the total protein and about 90% of the dry weight of the RBC. Hb is composed of four globular protein subunits, called globins, and four oxygen-binding heme groups, which are attached to each globin. The two main types of globins are the α-globins and the β-globins, which are made in essentially equivalent amounts in precursors of RBCs. Normal adult Hb (Hb A) has two α-globins and two β-globins (α2β2). There are also distinct embryonic, fetal, and minor adult analogs of the α-globins and β-globins, all of which are encoded by separate genes. The α-globin and its embryonic analog, the ζ-globin, are encoded in a cluster of genes on chromosome 16 (Fig. 429-2). The β-globin and its embryonic, fetal, and minor adult analogs—the  -, γ-, and δ-globins, respectively—are encoded in a cluster of genes on chromosome 11 (Fig. 429-2).
The earliest Hbs to be produced are the embryonic Hbs, Hb Gower-1 (ζ2 2), Hb Gower-2 (α2
 2), and Hb Portland (ζ2γ2). These Hbs predominate in embryos from 4 to 8 weeks of gestation, but disappear by 8 to 12 weeks. Fetal Hb (Hb F) (α2γ2) quickly replaces these embryonic Hbs as ζ- and
  -globin production rapidly falls. After the eighth week of gestation, Hb F is the main Hb, and at 6 months, it accounts for about 90% of the total. Thereafter, the percentage of Hb F decreases slowly as Hb A (α2β2) synthesis progressively increases. Small amounts of Hb A can be detected even in embryonic life. By the sixth month of gestation, there is about 5% to 10% Hb A, and it steadily increases to reach about 30% at term. At birth, the proportion of Hb F is about 70%.
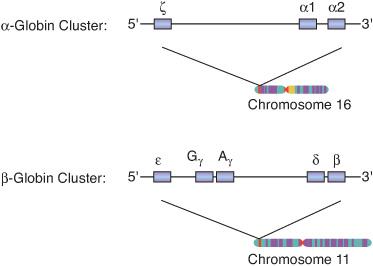
FIGURE 429-2. Globin genes: a simplified schema of the α-globin and β-globin gene clusters on chromosomes 16 and 11. The thick horizontal lines represent strands of DNA, and the boxes represent genes along the strands of DNA. The embryonic analog of α-globin is the ζ-globin. There are two α-globin genes (α1 and α2) that function throughout fetal and adult life. The embryonic analog of β-globin is the
-globin. The fetal analog of the β-globin is γ-globin, which is encoded by two distinct genes (γG and γA). There are two adult β-like globins: the major β-globin and the minor δ-globin. Combinations of these globins produce Hb F (α2γ2), Hb A (α2β2), and Hb A2 (α2δ2) at appropriate times during development.
At the time of birth, there is an abrupt decrease in γ-globin synthesis. Consequently, the proportion of Hb F (α2γ2) falls to less than 20% by 4 months of age and less than 2% at 1 year of age, which is the normal proportion in older children and adults. The rate of decline in Hb F is slower in individuals with β-hemoglobinopathies and β-thalassemias (see Chapter 434), in which higher proportions of Hb F may persist throughout life. Other conditions in which Hb F is elevated include hereditary persistence of fetal Hb (HPFH) (see Chapter 434) and the bone marrow failure syndromes (see Chapter 432).
The production of the minor adult Hb, Hb A2 (α2δ2), begins in late gestation and makes up only a small fraction of the total Hb, even in adult life. Hb A2 accounts for about 2% to 3% of total Hb after the first few months of postnatal life. Hb A2 is elevated in β-thalassemia trait (see Chapter 434).
DEVELOPMENTAL CHANGES IN OXYGEN TRANSPORT
Hb is an oxygen-transport protein. It must have a high enough affinity to oxygen to bind it in the lungs, but also a low enough affinity to oxygen to release it to the tissues. This reversible binding of oxygen is described by the oxygen-Hb dissociation curve (see Fig. 434-4). This curve describes the relationship between the percent oxygen saturation of Hb within a suspension of RBCs and the oxygen tension (pO2) of the solution. The p50 is the oxygen tension (pO2) at which Hb is 50% saturated, and it is a measure of the oxygen affinity of Hb. In the normal adult, the p50 is approximately 27 mm Hg. An increased p50 indicates a lower oxygen affinity, which shifts the oxygen-Hb dissociation curve to the right (see Fig. 434-4). A reduced p50 indicates higher oxygen affinity, which shifts the curve to the left. The affinity of Hb to oxygen is a function of the particular Hb (eg, Hb A or Hb F), but it is also regulated by physiologic feedback mechanisms, including the production of the organic phosphate 2,3-bisphosphoglycerate (2,3-BPG). Binding of 2,3-BPG to Hb decreases its oxygen affinity. These developmental and physiologic dynamics allow the body to adapt to changing environments. A key environmental change occurs at the time of birth when the body transitions from the relatively low-oxygen environment of the uterus to a high-oxygen extrauterine environment.
The p50 of fetal blood is about 20 mm Hg. This high oxygen affinity, relative to blood of older children and adults, allows the extraction of oxygen from the maternal circulation. The high affinity is largely a function of Hb F, which binds less avidly to 2,3-BPG than Hb A. The relatively high total Hb concentration of the fetus, which increases total oxygen-carrying capacity, helps maintains oxygen delivery to the tissues despite the high oxygen affinity of the Hb. Although the high oxygen affinity of fetal blood suits the conditions of the intrauterine environment, it limits the proportional release of oxygen to tissues after birth.
The extrauterine environment is relatively oxygen rich, so it is not necessary to maintain the high oxygen affinity needed for the intrauterine environment. Therefore, the p50 decreases appropriately after birth mainly as a result of the concomitant fall in Hb F concentration and rise in Hb A concentration. Relative to Hb F, Hb A is more sensitive to the effects of 2,3-BPG, so p50 increases as Hb A production increases. The postnatal decline in the p50 of infants to normal adult values takes 2 to 3 months.
DEVELOPMENTAL CHANGES IN BLOOD VOLUME
In term newborn infants, the average blood volume is 85 mL/kg. Premature newborns have an average blood volume of 90 mL/kg body weight. The blood volume increases to a mean of 105 mL/kg during the first few days of life and then decreases during the first few months. After these initial postnatal adjustments, blood volume maintains a relatively constant relationship to body weight throughout the remainder of life. The average blood volume of infants after 6 months of age is 75 to 77 mL/kg, similar to older children and adults.
DEVELOPMENTAL CHANGES IN THE NUMBERS AND RELATED MEASUREMENTS OF BLOOD CELLS
 EMBRYO AND FETUS
The mean Hb concentration progressively increases throughout gestation. It is 6 to 9 g/dL at 10 weeks’ gestation, 14 g/dL at 24 weeks, and 16.5 g/dL at term. The RBC count increases simultaneously from about 0.5 to 1.5 × 10¹²/L at 10 weeks’ gestation to 4.7 × 10¹²/L at term. Embryonic and fetal RBCs are much larger than those from newborns, children, and adults. The mean corpuscular volume (MCV) decreases from 250 fL at 10 weeks’ gestation to 107 fL at term. Thus, in neonates, the normal MCV is much higher than in older individuals. Moreover, many nucleated red blood cells (NRBCs) and reticulocytes are normally present in the peripheral blood of embryos and fetuses.
Stay updated, free articles. Join our Telegram channel

Full access? Get Clinical Tree


