Electrocardiography
George F. Van Hare
Normal electrical activation of the heart begins pacemaker activity in the sinoatrial node, and the wave of activation spreads through the right and left atria (Fig. 493-1). In the right atrium the wave of depolarization passes inferiorly, and the left atrium is activated via Bachmann bundle, which also triggers an inferiorly directed activation front. These activation fronts generate a potential that is detected on the body surface as the P wave. The impulse is delayed at the atrioventricular (AV) node, producing the PR interval. This allows ventricular filling to be completed before ventricular contraction begins. Beyond the AV node, the impulse moves rapidly down the bundle of His into the right and left bundle branches. As the impulses pass down the septum, they activate septal muscle predominantly from the left side, so that the initial ventricular vector passes from left to right, anteriorly and superiorly (Fig. 493-2), and begins the Q wave in lead V6 or the first part of the R wave in lead V1.1 After reaching the apex, the impulse activates the ventricular free walls from endocardium to epicardium and from apex toward the base, thus inscribing the R and S waves; the last part of the heart to be activated is the posterior ventricular muscle just under the AV ring. In adults and older children, there is more left than right ventricular muscle, so the major cardiac vectors point to the left and posteriorly and produce a tall R wave in V6 and a deep S wave in V1. In a normal newborn infant with a thick right ventricle, the major cardiac vectors pass to the right and anteriorly and produce a dominant R wave in V1 and a large S wave in V6. After depolarization has occurred, there is slower repolarization that produces the T wave. 
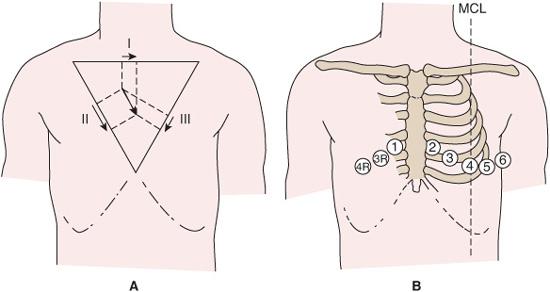
The “scalar” electrocardiogram is a recording of voltage against time, usually made at a paper speed of 25 mm/s, with 1 mV giving 10 mm of deflection.  The limb leads (I, II, III, aVR, aVL, aVF) represent forces in the frontal plane, and the precordial leads essentially represent forces in the horizontal plane (Fig. 493-3B); of these, the right chest leads (V4R,V3R,V1,V2) indicate anteroposterior forces, and the left chest leads (V5,V6) indicate left-to-right forces. Furthermore, certain parts of the left ventricle can be roughly reflected in certain groupings of leads: leads V1 and V2 show activity in the anteroseptal muscle; V2 to V5 in the anterior wall; V5 and V6 in the apex; I and aVL in the anterolateral wall; and II, III, and aVF in the inferior (diaphragmatic) wall.
APPROACH
The routine pediatric electrocardiogram involves the recording of 15 leads, the standard 12 plus leads to the right of V1 (V3R, V4R), and at least 1 lead (V7) to the left of V6; if no Q wave is seen in V7, then leads to the left of V7 should be recorded as well. Ideally, the electrocardiogram should be interpreted knowing the history; physical examination; drug therapy; and heart size, shape, and position as seen on the chest roentgenogram, as part of the standardized cardiac evaluation. However, the electrocardiographer often does not have access to this information. At a minimum, the reason for the study should be given.
It is best to read the electrocardiogram systematically. First, measure atrial and ventricular rates and define the rhythm. Then record the PR interval, QRS duration, and QT interval. Measure the frontal-plane mean axes of the P waves, QRS complex, and T waves. Finally, look for abnormalities of pattern in the waves and their interconnecting segments and note the voltages of P, Q, R, S, and T waves.
The electrocardiogram can provide information about arrhythmias, hypertrophy of cardiac chambers, electrolyte changes, myocar-dial or pericardial infections, and myocardial ischemia and infarction. Specific electrocardiogram (ECG) patterns occur in certain congenital heart diseases. The electrocardiogram gives little information about myocardial function or ventricular cavity size.
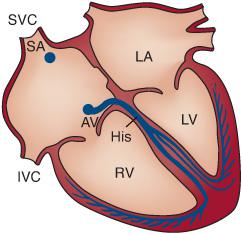
FIGURE 493-1. Diagram of conduction system. AV, atrioventricular node; His, bundle of His, dividing into right and left bundles; LA, left atrium; RV and LV, right and left ventricles; SA, sinoatrial node; SVC and IVC, superior and inferior venae cavae.
 MEASURING THE QRS AXIS
To evaluate the mean frontal plane QRS axis, the following features must be noted:
• Lead I records electrical activity from the left to the right arm; by agreement, a deflection passing toward the left arm is positive, and a deflection passing away from it is negative (Fig. 493-4A).
• Leads II and III are at 60° to each other and to lead I, and they can be superimposed on a common center (Fig. 493-4B). Note that the lower half of the frontal plane is assigned positive numbers and the upper half negative numbers.
• Lead aVF records electrical activity from the legs up to the heart and thus lies in the axis +90° to 90° (Fig. 493-4C). An impulse passing toward the leg thus gives a positive deflection.
• Leads aVR and aVL record electrical activity from the right and left shoulders, respectively, to the heart (Fig. 493-4D), and their axes are at 120° to each other and to lead aVF. Because they are unipolar leads, an impulse passing toward either shoulder will give a positive deflection despite the negative angles associated with the superior ends of the axes in the figure.
• All 6 leads may be superimposed on a central point (Fig. 493-4E) to give axes that are at 30° to each other.
• To use this hexaxial reference frame, first decide whether lead I is predominantly positive or negative. In general, this can be determined from the heights of the R and S waves. However, because it is actually area that is assessed, a tall but narrow R wave might contribute less positivity than the negativity contributed by a short but wide S wave; if the Q wave is large, it should also be included in the assessment. If the result is positive, the net vector is passing to the left; if it is negative, the net vector is passing to the right. If the net voltage is zero (that is, equiphasic R and S complexes), the vector must be passing up at 90° or down at +90° (Fig. 493-4A). Next, examine aVF for its net voltage: if positive, the vector is passing down; if negative, it is passing up; if zero, it is passing directly right or left (Fig. 493-4C). These 2 leads can be quickly integrated to assign the vector to 1 of 4 quadrants (Fig. 493-4F). Lead I+, aVF+ indicates the left lower quadrant; lead I+, aVF− indicates the left upper quadrant (left axis); lead I−, aVF+ indicates the right lower quadrant (right axis); lead I−, aVF− indicates the right upper quadrant, sometimes termed the northwest quadrant. The axis can be measured more closely by referring to the remaining leads; on modern electrocardiograms, the frontal plane axis is computed and reported in the ECG print-out.
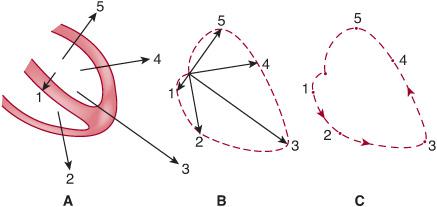
FIGURE 493-2. Normal ventricular depolarization, starting with 1 and ending with 5. A: Section through ventricles with thicker-walled left ventricle and thinner-walled right ventricle. Arrows are vectors, indicating direction and magnitude of electrical forces at each time. B: Vectors are superimposed on common center, and their tips are joined by a dashed line. C: The dashed line remains to give a vector loop. The vector at any moment would be a line joining the central point to the corresponding part of the loop. The arrows represent the direction of movement of the instantaneous vectors. In practice, direction is indicated by having each dash shaped like a teardrop, with the blunt end leading, and the dashes occur every 0.0025 second of the cardiac cycle.
• Occasionally, the R and S waves are almost equiphasic in several limb leads, perhaps in 4 or in all 6. This implies that the QRS vector is mainly perpendicular to the frontal plane and in the frontal plane forms a rough circle so that there is no true mean axis. This is sometimes termed an indeterminate frontal plane axis. It has little specific clinical importance except insofar as it prevents the accurate determination of a mean QRS axis.
• The mean frontal axis of the P and T waves can be calculated in the same way.
 MEASURING THE QT INTERVAL
By convention, the measured QT interval is reported as well as the “corrected” interval, termed the QTc, which is the raw QT divided by the square root of the R-R interval. 
P WAVE
In normal sinus rhythm, the right atrium is activated before the left atrium so that the first part of the P wave is right atrial, the last part is left atrial, but forces from both atria make up the middle of the P wave. With right atrial hypertrophy, the duration of the P wave is not typically lengthened, but the P waves become taller and peaked, especially in lead II, and exceed the normal upper limit of 0.25 mV (2.5 mm at full standardization). In lead V1, too, there may be a large biphasic P wave. With left atrial hypertrophy, the initial part of the P wave is unaltered, but the later part is larger and often lasts longer, so that the P waves are wider than normal and bifid, with a large second component.
The normal P frontal plane axis is about +30° to +60°; any marked change from this axis suggests an abnormal focus of atrial activation. 
The PR interval, from the beginning of the P wave to the onset of the QRS complex, is about 0.13 second in newborns; it increases to about 0.16 second at 16 years of age and can be up to 0.21 second in adults. 
Q WAVE
Because ventricular activation begins in the septum and generates a septal vector that normally passes to the right, anteriorly, and superiorly, a Q wave is normally present in V6 and absent in the right chest leads. A Q wave in right but not in left chest leads may indicate septal activation from right to left because of left bundle branch block or ventricular inversion (L-transposition of the great arteries).
Stay updated, free articles. Join our Telegram channel

Full access? Get Clinical Tree


