Introduction
Elliott Proctor Joslin presented his experience with diabetes in pregnancy in the Boston Medical and Surgical Journal in 1915 (7 years prior to the discovery of insulin). He described 10 pregnancies among seven women with three surviving children and four maternal deaths due to diabetic ketoacidosis, pyelonephritis, tuberculosis and a suicide after two failed pregnancies [1]. Following the introduction of insulin, maternal mortality dropped rapidly to 1–2% by the 1950s but perinatal outcome improved much more slowly.
Dr Joslin brought pediatrician Priscilla White to the New England Deaconess Hospital to care for “diabetes in youth.” As the girls she followed became pregnant young women, Dr White focused on the complications of pregnancy associated with diabetes, developing the system of classification of diabetes complicating pregnancy that bears her name. The system was intended to both guide physicians in their care of individual patients and facilitate comparisons of outcomes across diabetes centers. Her original classification did not recognize what we now call “gestational diabetes,” her “Class A” has been dropped and a class for women with kidney transplants was added later. Although less important now to guide treatment, her classification system is still useful and widely used (Box 11.1). Gestational diabetes is far more common than diabetes antedating pregnancy but the two are the most common and important medical and metabolic complications of pregnancy.
Maternal energy metabolism and the role of insulin
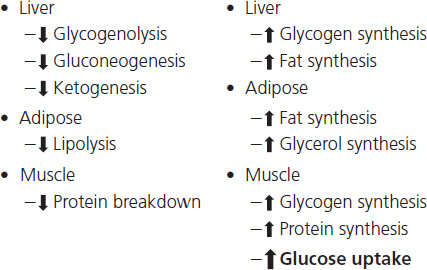
Glucose is central to energy metabolism and is the preferred energy source for most cells. It comes from three sources: ingested food, release from glycogen (glycogenolysis), stored mostly in the liver, and synthesis from smaller molecules (gluconeogenesis) in the liver. Almost all aspects of glucose metabolism and energy homeostasis are controlled by insulin and glucagon. Insulin is released from pancreatic beta cells directly into the portal circulation; thus it reaches the liver in very high concentration but is much more dilute when it reaches peripheral target tissues, including muscle and fat cells. Before it even leaves the pancreas, insulin exerts an important action in suppressing pancreatic alpha cell glucagon production. In the liver, it stimulates glycogen synthesis and suppresses hepatic glucose production by suppressing both glycogenolysis and gluconeogenesis (Figure 11.1). In the periphery the majority of insulin-stimulated glucose uptake is into muscle cells and to a much less extent into adipocytes. Within muscle cells insulin antagonizes protein catabolism, promotes nitrogen retention and protein synthesis and promotes both glycolysis, resulting in energy production, and glycogen synthesis.
Fundamentally different mechanisms control blood glucose levels in the fed and fasting states. The fasting blood glucose level is controlled by the rate of glucose production from the liver, whereas postprandial blood glucose levels are controlled by the rate of disposal of glucose absorbed from the gut into muscle cells.
When carbohydrate calories are plentiful in the fed state, insulin levels are high and the liver contains its normal glycogen stores. In the fasting state, insulin levels fall, glucagon levels rise, and the liver is quickly (over 12–24 hours depending upon caloric demand) depleted of glycogen. Low insulin levels permit muscle protein catabolism, releasing amino acids (primarily alanine) into the circulation which are taken up in the liver to be used as substrate for gluconeogenesis. That glucose is then sent out into the circulation to meet total body energy needs. As continued muscle catabolism to meet daily energy needs would ultimately be maladaptive, other mechanisms serve to maintain glucose levels in a more prolonged fasting state. Specifically, four key counter-regulatory hormones, glucagon, cortisol, epinephrine and growth hormone, mobilize fatty acids from triglycerides stored in adipocytes. These fatty acids are transported to the liver where they are converted into ketone bodies (mainly acetoacetate and beta-hydroxybutyrate) which are exported to be used by most tissues, including brain, to help meet total body energy requirements. Within the liver, fatty acid oxidation fuels hepatic gluconeogenesis.
Box 11.1 Classification of diabetes in pregnancy
Gestational diabetes mellitus noninsulin requiring (GDMNI): abnormal carbohydrate tolerance with onset or first diagnosis during pregnancy, not requiring insulin.
Gestational diabetes mellitus insulin requiring (GDMI): abnormal carbohydrate tolerance with onset or first diagnosis during pregnancy, requiring insulin.
Class A: abnormal carbohydrate tolerance in the nonpregnant state identified prior to the present pregnancy that does not require insulin either prior to or during the pregnancy.
Class B: onset of insulin-requiring diabetes after 20 years of age, with duration of less than 10 years.
Class C: onset of insulin-requiring diabetes between ages 10 and 20 with duration of less than 20 years, or duration 10–20 years regardless of age of onset.
Class D: onset of insulin-requiring diabetes prior to age 10 years, or duration greater than 20 years regardless of age of onset, or insulin-requiring diabetes with chronic hypertension, or insulin-requiring diabetes with benign retinopathy.
Class F: insulin-requiring diabetes with diabetic nephropathy (proteinuria of greater than 500 mg in a 24-hour urine collection).
Class R: insulin-requiring diabetes with proliferative retinopathy.
Class T: insulin-requiring diabetes with renal transplant.
Class H: insulin-requiring diabetes with coronary artery disease.
Pregnancy is associated with pancreatic beta cell hyperplasia and increased serum insulin levels in both the fasting and fed states. During pregnancy, fasting glucose levels are 10–15% lower than in the nonpregnant state, while postprandial levels are slightly higher. Early pregnancy is associated with slightly improved insulin sensitivity but as pregnancy progresses, women become increasingly insulin resistant. The insulin resistance is due to the effects of increased levels of several hormones including cortisol, growth hormone and human chorionic somatomammotropin (HCS, also known as human placental lactogen, HPL). Hepatic glycogen stores are reduced in pregnancy and are therefore more rapidly depleted than in the nonpregnant state. During a fast, pregnant women accomplish the switch from the use of hepatic glycogen for daily energy needs to lipolysis and ketone body production quickly and without going through the intermediate stage of protein catabolism and amino acid use for gluconeogenesis described above. This rapid transition from fed physiology to starvation physiology has been termed the “accelerated starvation of pregnancy.”
Glucose is transported across the placenta down a concentration gradient by facilitated diffusion in a nonenergy-requiring process. Fetal glucose levels are generally approximately 80% of maternal levels. Amino acids are actively transported across the placenta against a gradient in an energy-requiring process that results in fetal levels of some amino acids that are as much as 140% of maternal serum levels. Mechanisms clearly exist for transport of essential fatty acids, long chain polyunsaturated fatty acids and arachidonic acids across the human placenta but they are not yet fully understood [2].
Gestational diabetes was originally defined by O’Sullivan in a group of pregnant women in Boston in the 1960s as a degree of glucose intolerance greater than two standard deviations from the mean on a 100 g oral glucose tolerance test. By definition, therefore, 2.5% of women were identified as “abnormal.” Gestational diabetes is now defined as “glucose intolerance of variable degree with onset or first recognition during pregnancy” [3]. This broad definition inevitably includes some women with undiagnosed type 2 diabetes prior to pregnancy, and a few women who coincidently develop acute type 1 diabetes during pregnancy. The majority of patients diagnosed with gestational diabetes, however, have normal to marginal carbohydrate tolerance prior to pregnancy and are pushed into glucose intolerance by the hormonal changes of advancing gestation that antagonize insulin action.
Since hyperglycemia during pregnancy can increase the risks of both maternal and fetal complications, women should be screened for gestational diabetes, and it should be treated when diagnosed [4]. Few concepts of the dichotomy of “diseased” versus “nondiseased” have evolved as rapidly as the concept for gestational diabetes.
Almost all aspects of the diagnosis and management of gestational diabetes, including whom to screen, how to screen and when to screen, have been controversial. These controversies are not reviewed in detail here but a reasonable consensus representing the recommendations of the American Diabetes Association (ADA) and the American College of Obstetricians and Gynecologists is presented.
Although assessment for risk factors for gestational diabetes mellitus (GDM) should begin at the first prenatal visit, only a minority of women need a biochemical screen for diabetes in early pregnancy. However, there are several historic factors associated with an increased risk for early pregnancy gestational diabetes (Box 11.2). Anyone with any of these risk factors should be screened biochemically as early in pregnancy as possible. Most other patients (and those high-risk patients who pass the early pregnancy screen) should have a biochemical screen at 24–28 weeks gestation. The ADA recommends that all women except those who meet all the criteria for low risk (Box 11.3) should be screened biochemically [5]. Some investigators have reviewed large numbers of women in their practices and found that the ADA criteria eliminate so few women (approximately 10%) from biochemical screening that the difference between universal screening and selective screening on these criteria is trivial [6,7]. Temporal trends in the US, including increasing maternal age, increasing obesity and, especially in major cities, increasing numbers of women in high-risk racial or ethnic groups, will only further reduce the percentage of low-risk women who do not need to be screened. Women who require biochemical screening should be tested at 24–28 weeks gestation. High-risk women (e.g. Body Mass Index (BMI) greater than 30, age greater than 40, with a history of GDM or fetal macrosomia in a prior pregnancy) should be screened as early in pregnancy as possible. Those who pass an early pregnancy screen should be retested at 24–28 weeks.
Box 11.2 Historic risk factors
- “Marked” obesity
- Personal history of GDM
- Strong family history of diabetes
- Glycosuria
Box 11.3 American Diabetes Association 2009 Practice recommendations
Women who meet all these criteria do not need to be screened for gestational diabetes.
1. Are ≤25 years of age
2. Are a normal bodyweight
3. Have no family history (i.e. first-degree relative) of diabetes
4. Have no history of abnormal glucose metabolism
5. Have no history of poor obstetric outcome
6. Are not members of an ethnic/racial group with a high prevalence of diabetes (e.g. Hispanic American, Native American, Asian American, African American, Pacific Islander)
The precise values to be used for “abnormal” results are still debated. As with any screening test, the value chosen as the threshold for “abnormal” will determine both the sensitivity and specificity of the screen. These test performance characteristics and the prevalence of the “disease” in the population tested determine the positive and negative predictive values of the screen. This principle applies to both the 50 g oral glucose loading test (GLT) used as a screen for an abnormal “diagnostic” 100 g 3 hour oral glucose tolerance test (GTT) and the “diagnostic” 75 g 2 hour or 100 gram GTT as a “screen” for the complications of pregnancy associated with diabetes. A major conceptual advance in recent years has been the demonstration that there is no clear glycemic threshold for the risks of pregnancy complications associated with increasingly poor glucose tolerance, but rather a continuum of risk [8]. Although these observations may lead to the use of lower glycemic values to identify “abnormal” carbohydrate tolerance, on glucose tolerance testing and as treatment goals, it remains to be proven whether changing these thresholds will reduce pregnancy complications and long-term morbidity in the offspring.
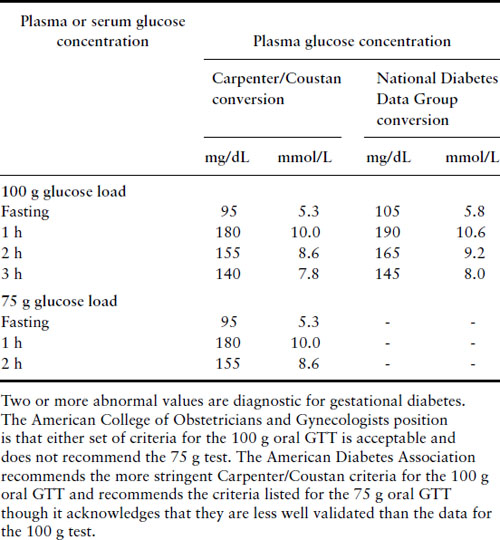
Currently the two-stage 50 g 1 hour GLT screen followed by a 100 g 3 hour GTT strategy is used in the US but most of the rest of the world uses a one-stage testing scheme with a standard WHO 75 g 2 hour GTT. Using a threshold GLT value of 130 or 140 mg/dL to proceed to a 100 g 3 hour oral GTT is acceptable. Criteria for normal test results are listed in Table 11.1.
Table 11.1 Diagnosis of GDM with a 100 g or 75 g oral glucose load
Patients who meet criteria for gestational diabetes should be placed on appropriate diets and have their fasting and 2 hour postprandial capillary blood glucose levels checked regularly. If glucose levels normalize on diet alone, then patients can be managed as normal obstetric patients. If the fasting glucose levels are in excess of 95 mg/dL or the 2 hour postprandial levels are greater than 120 mg/dL, then generally the patient should start insulin therapy and be managed as a diabetic patient. The potential role of oral agents in this situation is discussed below.
Effects of diabetes on the fetus and neonate
In 1937, White noted in the American Journal of Obstetrics and Gynecology that the three major complications of the neonatal period for infants of diabetic mothers (IDM) were “congenital defects, hypoglycemia and asphyxia” [9]. She regarded congenital defects as “doubtless beyond our therapeutic control” and proceeded to discuss the other two problems in detail. At that time, when the stillbirth rate was 25%, the 9% incidence of congenital malformations aroused less concern. Subsequently the stillbirth rate has fallen by two orders of magnitude, and overall perinatal mortality rate has fallen by one order of magnitude, but the incidence of major congenital malformations is virtually unchanged.
Early pregnancy effects
Congenital malformations
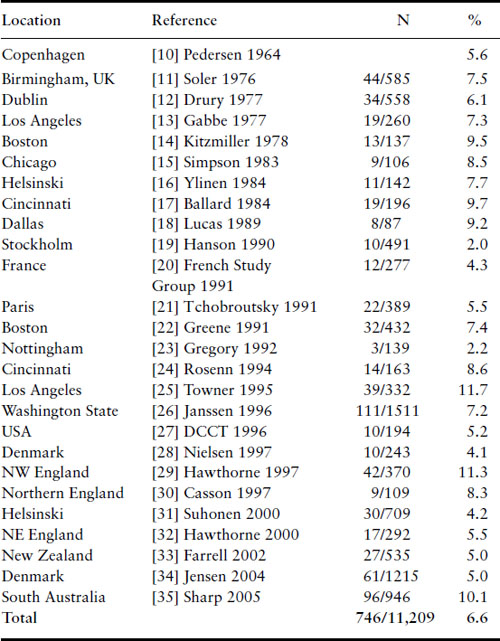
The rates of major congenital malformations in some large reported series of IDM are listed in Table 11.2 in chronologic order [10–35]. With the notable exception of a few low rates reported from some series from Europe in the mid-1990s, the incidence of major congenital malformations among IDM remains at 6–9%. Particularly disappointing are the findings of regional surveys from England indicating rates of 8–11% [29,30]. Gabbe observed that the decrease in stillbirth rate and minimal change in rate of major malformations have moved major malformations to first place among all causes of perinatal mortality for IDM, accounting for approximately 50% of the total [36].
Table 11.2 Malformations among infants of diabetic mothers
The first hint that congenital malformations among IDM might be related to the degree of metabolic control during organogenesis in the first trimester came from Leslie et al. [37]. They noted that three out of five diabetic patients in poor metabolic control delivered babies with major congenital malformations. At about that time, measurement of glycosylated hemoglobin became available. Hemoglobin Alc (Hb Alc) is a glycosylated hemoglobin species with a glucose moiety bound to the N terminal valine of the beta globin chain. Its concentration is proportional to the level of blood glucose seen by red blood cells. Its measurement is a useful tool for retrospectively assessing the degree of metabolic control during the previous 8–12 weeks. Miller et al. [38] took advantage of these Hb A1c determinations during the first trimester to provide the first reasonably large data set, documenting a relationship between metabolic control and major malformations. They examined Hb A1c values in a series of 116 consecutive patients enrolling for prenatal care prior to 14 weeks. These patients were then rank ordered according to their first-trimester Hb A1c values. The 58 patients in the lower half with better control had a 3.4% incidence of major malformations, while the 58 patients in the upper half with poorer control had a 22.4% incidence of major malformations. This difference was highly statistically significant.
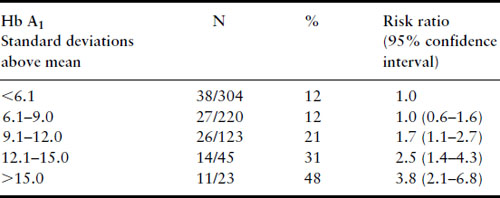
Several years later, much larger series were published from the Joslin Diabetes Center in Boston, again confirming the relationship between first-trimester Hb A1 levels and risk of major malformation (Table 11.3) and risk of perinatal mortality from major malformations (Table 11.4) [39,40]. Studies that have examined the potential relationship between first-trimester metabolic control and risk for major malformation are summarized in Table 11.5. Not included in the table is the study of Nielsen et al. [41] because it used a composite outcome measure of spontaneous abortions, induced abortions, and major malformations but it too confirms the relationship between poor first-trimester metabolic control and early adverse pregnancy outcome. All studies have found a relationship except the Diabetes In Early Pregnancy (DIEP) study of the National Institutes of Child Health and Human Development (NICHD) [42]. The DIEP was a multicenter study that enrolled diabetic women either prior to conception or within 21 days of conception. The reason why the DIEP failed to find the relationship between poor control during organogenesis and risk of major malformation was that 86% of the DIEP patients were enrolled prior to conception, with the remaining 14% enrolled within 21 days of conception. This yielded a rather homogeneous group of patients with relatively good metabolic control. Ninety-three percent of their patients had first-trimester glycohemoglobin values less than seven standard deviations above the mean. The best evidence suggests that the risk for major malformations does not begin to rise in a statistically significant manner until Hb A1 values are well beyond seven standard deviations above the mean [40,41]. Thus, the vast majority of the DIEP study subjects were not at increased risk for major malformations. Not surprisingly, therefore, no increase in risk was found. All the existing data are consistent with the hypothesis that poor metabolic control during organogenesis as evidenced by elevated first-trimester glycohemoglobin values is associated with an increased risk for major congenital malformations among IDM.
Table 11.3 Major malformations and Hb A1, Joslin Diabetes Center 1984–1992
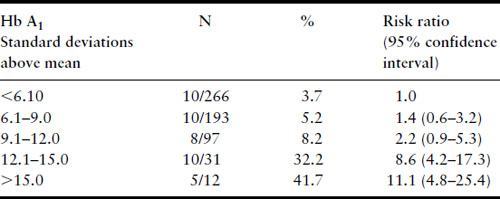
Table 11.4 Fatal malformations according to first-trimester Hb A1 level, Joslin Diabetes Center data through 12/31/92
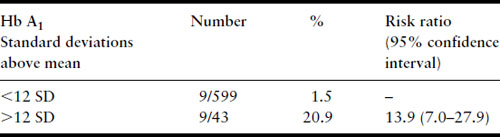
Table 11.5 Studies of relationship between first-trimester metabolic control and major malformations
| Study (ref) | Relationship found |
| Miller [38] | Yes |
| Ylinen [16] | Yes |
| Mills [42] | No |
| Greene [75] | Yes |
| Hanson [19] | Yes |
| Kitzmiller [104] | Yes |
| French Study Group [20] | Yes |
| Rosenn [24] | Yes |
| Towner [25] | Yes |
| Casson [30] | Yes |
Molsted-Pedersen et al. suggested in 1964 that the risk of major malformation might be further increased by the presence of microvascular disease [10]. However, data from the Joslin Diabetes Center have not supported such an association, demonstrating no significant increase in risk of major malformations for patients with nephropathy or proliferative retinopathy, as compared with those without. Moreover, women in the Joslin cohort who delivered nonmalformed livebirths actually had diabetes for a significantly longer time prior to pregnancy than women who delivered babies with major malformations (mean 13.4 versus 8.9 years). Because the prevalence of microvascular disease among patients with diabetes increases with increasing duration of illness, this finding further argues against an association between microvascular disease and the risk of major malformations.
Spontaneous abortion
There has been debate as to whether diabetic women have an increased incidence of spontaneous abortion in the first trimester. Early studies suggested that the rate was approximately equal to that in the nondiabetic population [43]. Later studies suggested that the rate was higher than for nondiabetic patients [44,45] but these studies could have been biased by differential ascertainment of miscarriages in diabetic and nondiabetic women. Wright et al. found a 17% first-trimester spontaneous abortion rate among 58 consecutive diabetic pregnancies and demonstrated that the patients who miscarried had significantly higher first-trimester glycohemoglobin levels than those who did not [43]. The DIEP found an increasing risk of spontaneous abortion associated with increasing first-trimester glycosylated hemoglobin levels [46]. The risk of spontaneous abortion in the best controlled diabetic patients was between 10% and 17%. Those patients who entered the first trimester with glycosylated hemoglobin values of more than six standard deviations above the mean for their nondiabetic controls had a twofold increase in risk to about 28%. Data from the Joslin Diabetes Center confirmed the finding of an increasing risk of spontaneous abortion associated with increasing first-trimester Hb A1 values (Table 11.6) [39]. The risk of spontaneous abortion does not rise statistically significantly until greater than nine standard deviations above the mean for the nondiabetic population. This is consistent with the data from the DIEP, but they did not have enough patients at higher glycohemoglobin values to determine whether the risk truly rises at greater than nine standard deviations above the mean or between six and nine.
Table 11.6 Spontaneous abortions and Hb A1, Joslin Diabetes Center 1984–1992
Defining the phenotype of the diabetic embryopathy
The anomalies found among IDM span the range of the anomalies found in the nondiabetic population. Kucera compiled a series of 7100 IDM from the literature from nine countries spanning 30 years and compared the 340 anomalous fetuses among them to a control group of 7100 anomalous fetuses from 431,000 nondiabetic women from a WHO database [47]. Ten malformations were sixfold more common among the IDM; most strikingly, caudal regression syndrome was 200-fold more common than among offspring of nondiabetic mothers. Kucera considered these “very probably” specific for diabetes.
A case–control study from the Metropolitan Atlanta Congenital Defects Program found an odds ratios of 15 for neural tube defects and 13 for congenital heart disease [48]. A Spanish case–control study found relative frequencies of 66 for defects of the spine and ribs, 53 for caudal dysgenesis, 2.9 for CNS defects and 2.8 for congenital heart disease [49]. A case–control study of congenital heart disease in metropolitan Baltimore and Washington DC found a strong association between both congenital heart disease in general and fatal congenital heart disease and maternal diabetes [50]. A Hungarian case–control study found maternal diabetes to be associated with a prevalence odds ratios of 14.8 for renal agenesis or dysgenesis, 5.0 for multiple anomaly syndromes, and 3.4 for congenital heart disease, but no significant association of maternal diabetes with neural tube defects [51]. In a British cohort study of 609 liveborn IDM, 22 (3.6%) had cardiovascular malformations compared to the 0.74% incidence in 192,000 controls, resulting in an odds ratio of 5.0 [52]. Maternal diabetes, like other environmental teratogens, interacts with genetic factors to result in congenital malformations. Allowing for some geographic and likely genetic differences among study populations, the congenital malformations that emerge as most likely specific to maternal diabetes are renal agenesis/caudal dysgenesis syndrome, congenital heart defects and neural tube defects.
Summary of the relationship between metabolic control and first-trimester events
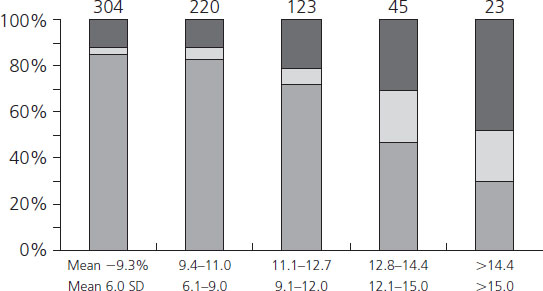
Synthesis of the available data permits several conclusions. Women with diabetes mellitus who are in good metabolic control in the first trimester do not have a risk for spontaneous abortion higher than the general population, when the control group is comparably recruited and studied. However, women with well-controlled diabetes cannot be glibly reassured that their risk for major malformations is not increased above that for the nondiabetic population. The finding of the DIEP study that even well-controlled diabetic women have an increased risk of major malformations above that for the nondiabetic population seems inescapable. The range of metabolic control over which the risks for abortion and major malformations do not rise is fairly broad. Very poor metabolic control during the first trimester, however, does result in increased risks for both first-trimester spontaneous abortions and major malformations. The mechanism behind the modestly increased risk of major malformations for IDM despite good maternal metabolic control followed by a plateau in risk with fair control and a very high risk with very poor control is not known. Figure 11.2 displays the Joslin Diabetes Center data for spontaneous abortions, major malformations and nonmalformed births graphically by first-trimester Hb A1 values and standardized to 100%, with the actual number of observations in each group at the top of each bar. This makes it very clear that for diabetic women, the risks for spontaneous abortion and major malformation do not increase significantly for Hb A1 values up to nine standard deviations above the nondiabetic mean. However, with very poor metabolic control (Hb A1 values greater than 12 standard deviations above the nondiabetic mean), diabetic women are approximately equally likely to have a spontaneous abortion, a fetus with a major malformation, and a nonmalformed birth. Although simple hyperglycemia alone does not appear to be the mechanism responsible for teratogenesis, the precise molecular mechanism remains unknown.
Figure 11.2 Data from the Joslin Diabetes Center, January 1 1984 to December 31 1992, for 715 consecutive pregnancies with first-trimester HbA1 values available. This stacked bar graph demonstrates the relative probabilities of a nonmalformed livebirth, a major congenital malformation and a first-trimester spontaneous abortion according to first-trimester HbA1 values and standardized to 100%. Reproduced from Greene [40] with permission from Thieme Medical Publishers.
Late pregnancy fetal and neonatal effects
Respiratory physiology and fetal demise
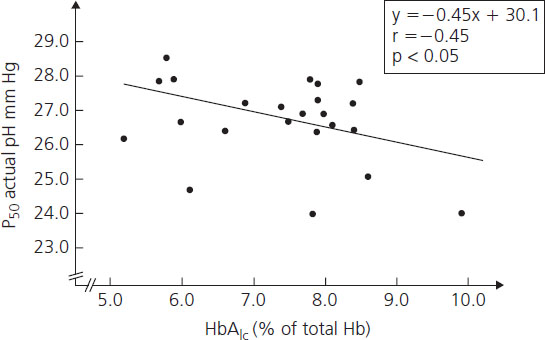
Hemoglobin Alc concentrations among diabetic women may be 2–3 times higher than nondiabetic individuals. Beyond being a useful clinical tool for assessing recent metabolic control, the glycosylation of hemoglobin has physiologic implications for oxygen transport. As the percentage of glycosylated hemoglobin rises, the amount of oxygen, molecule for molecule, carried by hemoglobin falls (Figure 11.3) [53]. The avidity with which the oxygen is bound is also changed. The affinity of hemoglobin for oxygen is normally modulated by binding with 2,3-diphosphoglycerate (2,3-DPG) so that in the presence of 2,3-DPG the P50 rises (P50 is a measure of hemoglobin affinity for oxygen and reflects the partial pressure of oxygen at which hemoglobin achieves 50% saturation). When P50 rises, the oxygen is less firmly bound. Hemoglobin A1c changes its P50 only minimally in the presence of 2,3-DPG, resulting in an inverse correlation of the P50 with the concentration of Hb A1c (Figure 11.4). The displacement of oxygen from native hemoglobin that is facilitated by 2,3-DPG binding is also associated with the acceptance of a proton (H+) by the deoxygenated hemoglobin (the Bohr effect) and thus contributes to the buffering capacity of blood. Hb Alc, with its more tightly bound oxygen, releases the oxygen less well at areas of reduced oxygen tension, such as the placental intervillous space. Diabetic patients who are chronically poorly controlled will have high levels of Hb A1c that will carry less oxygen, release it less well to cross the placenta, and buffer acid less well.
Figure 11.3 Correlation between Hb A1c and arterial oxygen saturation in diabetic and nondiabetic women. Reproduced from Madsen & Ditzel [53] with permission from Elsevier.
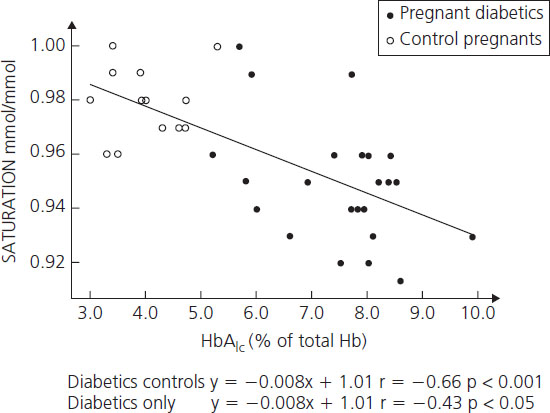
Figure 11.4 Correlation between Hb A1c and P50 at actual pH in diabetic women. Reproduced from Madsen & Ditzel [53] with permission from Elsevier.
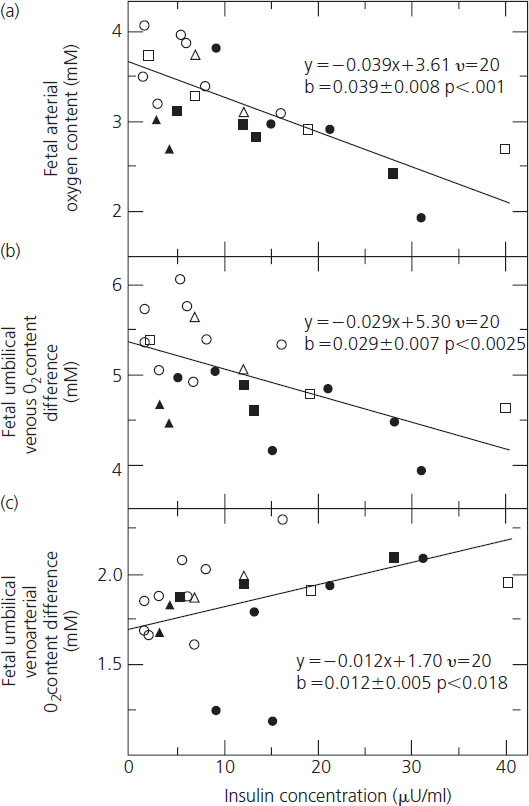
The adverse effects of chronic hyperglycemia on the oxygen-carrying and buffering properties of maternal hemoglobin are exacerbated by fetal hyperinsulinemia. Fetuses of diabetic mothers in poor metabolic control are chronically hyperinsulinemic and develop pancreatic beta cell hyperplasia; fetal hyperinsulinemia is further exacerbated by acute episodes of maternal hyperglycemia. Fetal hyperinsulinemia increases the oxygen requirement of the fetus. Fetal oxygen consumption rises in direct proportion to the insulin concentration, resulting in falls in both venous and arterial oxygen contents (Figure 11.5A,B) [54]. Oxygen supply is unable to keep pace with demand, resulting in fetal hypoxemia reflected in a progressive rise in the arteriovenous oxygen difference between the umbilical artery and vein (Figure 11.5C) and acidosis [54]. These mechanisms, combined with compromise to perfusion of the intervillous space resulting from hypertension and maternal vascular disease, were likely responsible for the late fetal demises that were so common through the 1960s. Over the past 40 years there have been many improvements in the care of pregnant diabetic women, making it impossible to isolate and attribute the reduction in the risk of late fetal demise to any one. It is most likely that improved metabolic control and modern surveillance for fetal well-being are together largely responsible for the dramatic reduction in incidence of stillbirth to rates comparable to the nondiabetic population by the 1990s [55].
Figure 11.5 The association between fetal plasma insulin concentration and fetal (a) arterial oxygen content, (b) venous oxygen content, and (c) umbilical venoarterial oxygen content difference. Shown in each frame is the regression line as determined by analysis of co-variance. Also shown are the regression equations as well as the slopes with their standard errors and P values. Reproduced from Milley et al. [54] with permission from Elsevier.
Fetal growth
Excessive fetal growth has long been recognized as an important complication of maternal diabetes. According to the expanded Pedersen hypothesis, elevated maternal levels of glucose and possibly other insulin secretagogues like certain amino acids readily cross the placenta, resulting in fetal hyperinsulinemia. Fetal hyperinsulinemia acts as an anabolic stimulus, leading to enhanced accretion of fat, bone and muscle mass. Supporting this hypothesis is the finding that macrosomic fetuses of diabetic women have high C peptide levels and are at increased risk for neonatal hypoglycemia [56].
Early attempts to correlate a variety of indices of glycemic control (e.g. mean daily glucose levels and Hb A1c levels) with fetal growth had limited success. Furthermore, occasional case reports have described the birth of markedly macrosomic infants despite excellent glycemic control by all known parameters. A potential explanation for these apparently conflicting observations was provided by the finding that insulin could cross the placenta from the maternal to the fetal circulation in the form of insulin–anti-insulin antibody complexes [57]. The level of these antigen–antibody complexes was proportional to fetal weight at birth. An increasing body of evidence indicates that there is a relationship between fetal size at birth and maternal glycemia that extends down through the normal, “nondiabetic” range with no “threshold” for excessive growth [8,58,59]. The finding in a UK case series that there was a dramatic reduction in fetal demise, but not in the risk of excess fetal size at birth, with lower glucose levels [55] suggests that the degree of metabolic control needed to minimize the risk for excessive fetal growth is likely to be much more stringent than that needed to reduce the risk of fetal demise. The term “macrosomia” has been used variably to describe fetal weight in absolute terms as greater than 4000 g, or greater than 4500 g, and in relative terms as greater than the 90th centile at any gestational age. Excessive fetal growth is undesirable because it is associated with increased rates for cesarean delivery, birth trauma, stillbirth, neonatal hypertrophic cardiomyopathy and hypoglycemia.
Fetal lung maturation
It has been recognized for more than 30 years that, after controlling for gestational age, the incidence of respiratory distress syndrome (RDS) among IDM is 5–6-fold higher than the incidence among infants of nondiabetic women [60]. Fetal lung development is an extremely complex process involving hundreds of intercellular signaling events to bring vasculature and airways together and then differentiate the airway epithelium into an efficient respiratory epithelium for gas exchange [61]. The ultimate steps in development of the alveolar epithelium that permit expansion of alveolar spaces with air at birth and that resist collapse are proliferation and maturation of type II pneumocytes that produce surfactant. This process is under endocrine control with glucocorticoids and thyroxin promoting type II pneumocyte proliferation and surfactant production. Both insulin and androgens inhibit surfactant production in mammals [62]. The inhibitory effect of androgens on surfactant production helps to explain the well-known difference between the sexes in respiratory distress syndrome. The inhibitory effect of insulin and the hyperinsulinemia of most fetuses of diabetic mothers help to explain the increased incidence of RDS in IDM. Stillborn male IDM commonly demonstrate Leydig cell hyperplasia in their testes [63]. The cord blood of male IDM demonstrates higher HCG and testosterone concentrations than the cord blood of male infants of nondiabetic mothers [64]. These higher testosterone levels during fetal development further slow fetal lung maturation.
Polycythemia and hyperviscosity syndrome
Polycythemia defined as hematocrit greater than 65% has long been known to be more common among IDM. In a series of 34 IDM paired with 34 infants of nondiabetic women, the rates of polycythemia were 29% and 6%, respectively [65]. However, recent series of IDM born to very well-controlled diabetic women have shown no increase in risk compared to infants of nondiabetic women. The incidence of polycythemia is proportional to fetal insulin levels. Insulin directly stimulates erythroid progenitors in the marrow to make more red cells [66], possibly by cross-reacting with the receptors for insulin-like growth factor 1 (IGF-1) [67]. Elevated levels of insulin also stimulate erythropoiesis indirectly by stimulating elevated levels of erythropoietin (EPO), which stimulates erythropoiesis [68,69]. Insulin also stimulates synthesis of hypoxia-inducible factor 1 (HIF-1) which, under relatively hypoxemic conditions, stimulates synthesis of a number of proteins, including transferrin and IGF-1 receptor protein, further stimulating erythropoiesis [70].
Mild polycythemia may contribute to the increased incidence of hyperbilirubinemia seen in IDM, but severe polycythemia can place the neonate at risk for hyperviscosity syndrome, including ischemia, thrombosis and infarction. This may require treatment by phlebotomy to reduce the hematocrit.
Neonatal hypoglycemia
Chronic stimulation by elevated levels of transplacental glucose and possibly other insulin secretagogues such as branched chain amino acids results in fetal pancreatic beta cell hyperplasia. When the umbilical cord is cut at delivery, the transplacental supply of glucose stops abruptly. As many as one-quarter of all IDM have difficulty downregulating insulin production promptly, resulting in neonatal hypoglycemia (defined as blood glucose less than 40 mg/dL). Not surprisingly, because chronic fetal hyperglycemia causes beta cell hyperplasia and hyperinsulinemia, which in turn cause both macrosomia and neonatal hypoglycemia, macrosomic babies are at greater risk for hypoglycemia than appropriately grown babies. Just as strict metabolic control during pregnancy reduces but does not eliminate macrosomia, the same is true for neonatal hypoglycemia. Before hypoglycemia was recognized as a common problem, it was a frequent cause of neonatal seizures and occasionally death. Modern pediatric care now usually includes routine heel stick capillary blood glucose measurement at about 30 minutes of age and regularly thereafter until stable. Hypoglycemia is treated with glucose feedings or intravenous infusions as necessary. The problem is self-limiting and usually resolves within 48 hours of birth.
Other metabolic abnormalities
Hypocalcemia and hypomagnesemia are both rather common among IDM, each approximately 20–30%, and usually asymptomatic. Routine screening is not recommended, although these conditions should be considered if a baby remains unusually “jittery” despite normal glucose levels. Hyperbilirubinemia occurs with similar frequency in IDM. As noted above, it is more frequent in infants with polycythemia, perhaps due to an increase in red cell fragility and immaturity of conjugation enzyme systems.
Hypertrophic cardiomyopathy
Hypertrophic cardiomyopathy is rarely, if ever, seen among IDM in the absence of macrosomia. It can present along a continuum of severity from frank congestive heart failure to clinical respiratory distress with tachypnea, nasal flaring, grunting, retractions and cyanosis to asymptomatic [71]. Given that many babies discovered to have the echocardiographic signs of hypertrophic cardiomyopathy are asymptomatic, the incidence of the problem varies widely with the frequency with which echocardiograms are done in these babies. The echocardiographic hallmark of the condition is hypertrophy of the interventricular septum and to a much lesser extent the ventricular free walls. The degree of the hypertrophy correlates reasonably well with symptomatology at clinical presentation. Ventricular function is well preserved, although most infants developing congestive failure have some degree of hypertrophic subaortic obstruction. Among infants presenting with respiratory distress, there is frequently evidence of persistent pulmonary hypertension of the newborn. In rare cases, the condition can be lethal in the newborn period but babies who survive generally recover without sequelae and, on echocardiographic follow-up typically remodel their myocardium to normal appearance within 2–12 months [72]. In addition to the almost universal macrosomia in these babies, severe and prolonged hypoglycemia is common, adding to the impression that fetal hyperinsulinemia is etiologic [73]. The more severe end of this spectrum of disease has all but disappeared in recent years, likely due to generally improved metabolic control throughout pregnancy.
Prematurity
There is an increased risk of premature birth among IDM. Mimouni et al. reported a 31% incidence of preterm labor among 164 women with insulin-dependent diabetes as compared to a 20% incidence in nondiabetic control women [74]. Of the diabetic women diagnosed with premature labor, 72% actually delivered prematurely for an overall incidence of preterm birth of 22.5%. In a series of 420 pregnancies from the Joslin Diabetes Center, the incidence of preterm birth was 26% compared with a 9.7% rate among 9368 control nondiabetic women [75]. In that series, the single most important cause of preterm birth, 33% of the preterm births, was deliveries indicated due to pre-eclampsia. The other important causes of preterm birth were preterm premature rupture of the membranes 25%, deliveries indicated for nonreassuring fetal evaluation 14%, and spontaneous onset of labor 13%. There was a strong relationship between the presence of diabetic nephropathy and preterm delivery. Among the 59 women entering pregnancy with nephropathy, 39 (66%) developed hypertension during pregnancy and 31 (52%) of the total delivered prematurely. A series of 461 pregnancies among women with pregestational diabetes was reported from the NICHD Maternal Fetal Medicine Unit Network [76]. They too found a statistically significantly higher incidence of preterm birth among their diabetic women, 38%, as compared to 13.9% among 2738 control women. In that study, 42% of the preterm births were spontaneous while 58% were indicated, the majority of those for pre-eclampsia.
Long-term neurodevelopmental outcome
The NIH Collaborative Perinatal Project enrolled more than 50,000 mother/infant pairs with the primary purpose of determining the prenatal causes of cerebral palsy and mental retardation. Diabetic women were matched to nondiabetic controls and their offspring were compared using the Bayley Mental and Motor Development Tests and the Binet IQ Test at 4 years of age [77]. The offspring of diabetic women who experienced acetonuria (acetone is one of the ketones) during pregnancy performed statistically significantly less well on all testing than their nondiabetic controls. These differences were not seen in the offspring of diabetic women who were not acetonuric during pregnancy nor did they find any neurodevelopmental disadvantage among the offspring of diabetic women who experienced more insulin reactions. A second study from that same cohort did not find any developmental disadvantage to the offspring of acetonuric, starved, nondiabetic women who failed to gain weight adequately [78]. These observations suggested that there was something particularly disadvantageous to the ketosis of poorly controlled diabetes as compared to simple starvation ketosis.
Some years later a cohort study of 89 women with pregestational diabetes, 99 women with gestational diabetes and 35 nondiabetic control women found significant adverse consequences for neurodevelopmental testing results at 2, 3, 4 and 5 years of age related to elevated serum levels of the ketone beta-hydroxybutyrate in the third trimester [79]. There were no significant correlations between intelligence scores and second- or third-trimester fasting plasma glucose levels, Hb A1c levels or hypoglycemic episodes. Continued testing for this cohort at 6–9 years of age confirmed the deleterious neurodevelopmental consequences of late pregnancy elevations of maternal serum beta-hydroxybutyrate levels [80]. Thus there is the strong suggestion that elevated serum levels of ketoacids in diabetic women in late pregnancy are associated with adverse neurodevelopmental consequences for their offspring. Compared to the sons of nondiabetic women, sons of diabetic women were slightly but statistically significantly more likely to be rejected for Danish military service based upon an intelligence test administered to all potential conscripts [81]. A subgroup analysis of the intelligence test scores for those men for whom data were available regarding their mothers’ Hb A1c levels during pregnancy showed that the scores for the men whose mothers’ Hb A1c values were less than 7% were similar to the sons of the nondiabetic women.
Perinatal mortality
Although major improvements in the care of pregnant diabetic women over the past 80 years have reduced the perinatal mortality rate by an order of magnitude, it still remains higher than that for the offspring of nondiabetic women. Through the 1960s the rate of near-term fetal demise for diabetic women was nearly 10%. This led to the practice of routine delivery at 36–37 weeks resulting in neonatal morbidity and mortality due to hypoglycemia and RDS. During the 1970s, improved metabolic control facilitated by capillary blood glucose monitoring and routine surveillance for fetal well-being using electronic fetal heart rate monitoring and ultrasound reduced the rate of near-term fetal demise. This, coupled with recognition of the toll of neonatal morbidity and mortality of RDS in IDM and development of fetal lung maturity testing, gave obstetricians both the courage and the motivation to continue pregnancies of diabetic women to 39 weeks, dramatically reducing perinatal mortality due to fetal demise and neonatal RDS. By 1978 Gabbe et al. observed that 4/9 perinatal mortalities among 322 IDM were due to major congenital malformations, replacing RDS as the main cause of neonatal death in IDM [82].
Twenty-five years later the Confidential Enquiry into Maternal and Child Health for March 2002 through February 2003 in Great Britain found the perinatal mortality rate among IDM to be 32/1000, nearly four times higher than the 8.5/1000 rate for the rest of Great Britain [83]. Consistent with Gabbe’s observation, 42% of the 129 perinatal mortalities were due to major congenital malformations. A regional survey in Great Britain 1990–1994 [84], a nationwide survey in Denmark 1993–1999 [85] and a provincial population-based cohort in Nova Scotia 1988–2002 [86] have all reported similar findings. A review of the available studies confirms the impression that the overall risk of perinatal mortality is related to the degree of glycemic control [87].
Risk of diabetes in the offspring
One of the questions most frequently asked by women with diabetes is “Will my child have diabetes?” There are clearly strong hereditary and environmental influences on the development of both type 1 and type 2 diabetes. A major fraction of the risk for type 1 diabetes is strongly associated with the HLA system in a group of genes on chromosome 6p21 and several other chromosome regions [88]. There are undoubtedly also environmental influences, however, including the possibility that a variety of viral infections could serve as triggers in genetically susceptible individuals. The risk of insulin-dependent diabetes by 20 years of age is inherited asymmetrically from mother (1.3%) and father (6.1%) [89]. Furthermore, the risk is inversely related to maternal age at delivery, being approximately 3% for diabetic women under age 25 and 1% over age 25 [90]. The inheritance pattern for type 2 diabetes has been more difficult to discern, with strong associations discovered on genome-wide association studies (GWAS) for mutations in many sites, some of which are in unsuspected genes and outside coding regions [91,92]. The importance of classic clinical risk factors such as a family history of the disease, increased BMI, elevated liver enzymes, current smoking status, and reduced measures of insulin production and action was emphasized by the fact that they were more strongly predictive of the disease than variants in 11 alleles known to be risk factors from GWAS [93]. Some of the variant alleles are associated with impaired beta cell function rather than insulin resistance [94]. Another clue to the mechanisms involved is that the risk for gestational diabetes, as a proxy for type 2 diabetes or pre-pregnancy type 2 diabetes, is inherited asymmetrically from mother and father. Among 232 women with either GDM or type 2 diabetes, 11% had a mother with diabetes while only 5% had a father with diabetes and for the women with two diabetic parents, there was no greater risk of diabetes than with a diabetic mother alone [95]. This suggests a possible epigenetic mechanism to the inheritance.
Pre-pregnancy care
The main purpose of pre-pregnancy care is to identify any maternal conditions that might pose a risk to mother or fetus during a pregnancy. Once identified, the woman should be counseled about the potential risks presented and she should be treated as necessary.
Women presenting for pre-pregnancy care and counseling should have a complete history taken with special attention paid to:
- age of onset and duration of diabetes
- assessment of type (1 or 2) of diabetes
- history of diabetic ketoacidosis and precipitating circumstances
- history of severe hypoglycemia, hypoglycemic seizures and ability to reliably perceive hypoglycemia
- retinopathy, proliferative retinopathy and laser photocoagulation therapy for retinopathy
- proteinuria and nephropathy
- hypertension
- neuropathy including symptoms suggestive of gastroparesis
- cardiovascular disease.
A complete physical examination should be sure to include assessments of BMI (height and weight), blood pressure and thyroid examination. A dilated retinal examination should be considered based upon duration of diabetes, time elapsed since last examination, and history of retinopathy on prior examinations.
Laboratory evaluations should include blood for Hb A1c
Stay updated, free articles. Join our Telegram channel

Full access? Get Clinical Tree


