Cardiac Catherization
Phillip Moore
The role of cardiac catheterization for children with congenital heart disease has changed dramatically over the past 10 years. Improved anatomic imaging of complex congenital heart disease with echocardiography, computerized tomography (CT), and magnetic resonance imaging (MRI) has made catheter-based angiography nearly obsolete for many common conditions. Today, most surgical patients with intracardiac lesions are diagnosed by echocardiography and undergo surgery without cardiac catheterization. MRI or CT has supplanted cardiac catheterization as the preoperative imaging modality for aortic arch abnormalities and coronary anomalies in many institutions, and MRI is the primary modality for measuring ventricular volumes and semilunar valve insufficiency. Transesophageal echocardiography supplements direct visualization during surgery and identifies residual abnormalities that can be promptly addressed intraoperatively, reducing the need for postoperative cardiac catheterization. Cardiac catheterization remains the primary test for evaluating complex physiology in children with abnormal pulmonary vascular resistance and reactivity, complex single ventricle anatomy, multiple obstructions in the right or left heart, or lesions of peripheral pulmonary arteries not seen well with other imaging modalities. Patients may need cardiac catheterization to assess residual defects soon after surgery when surface echo-Doppler studies may be less accurate.
Cardiac catheterization can rarely lead to serious complications, including arrhythmias, arterial obstruction, reactions to contrast medium, hemorrhage, cardiac perforation, hypoxemic episodes, infections, and death. The mortality rate is 0.2%, with the highest risk occurring in premature infants, critically ill term neonates, and those patients undergoing complex interventional catheterization procedures. Older children at particular risk of death are those with a very high pulmonary vascular resistance and no means of shunting. Pulmonary hypertensive crises or vagal episodes may decrease systemic output and cause death during or soon after catheterization in such patients. About 3% of children may have significant but nonfatal complications. Radiation exposure is a concern, especially in children with complex disease requiring repeat catheterizations. However, the few longitudinal studies done in children after cardiac catheterization in childhood have not shown an increased rate of cancer in adult years.
TECHNIQUE
The most commonly used vessels for cardiac catheterization are the femoral, internal jugular, and subclavian veins and the femoral artery. The catheters are inserted percutaneously. Local infections and arterial complications are extremely rare, and the same vessels may be used repeatedly. In patients with congenital heart disease, the femoral approach often permits passage of a venous catheter into the left side of the heart through a patent foramen ovale or atrial septal defect, avoiding the use of the artery. Patients who have many repeat catheterizations may develop obstruction of the femoral or internal jugular veins, prohibiting their future use. If needed, vascular access can be safely obtained through percutaneous cannulation of the hepatic veins, called a “transhepatic approach”  . Some centers use carotid artery cut down with direct sheath placement and surgical repair for access for balloon valvuloplasty for critical aortic valve stenosis or for stent placement in the patent ductus arteriosus in a neonate with pulmonary atresia.
Catheter manipulation is performed under fluoroscopy, with image intensification and pulsed radiation to reduce radiation exposure. Catheters, long thin plastic tubes with one or more holes at the end, come in many sizes, shapes, and materials. Angiographic catheters have multiple holes at their tip to allow rapid injection of contrast medium for angiography. Directional catheters come in many preformed shapes, have a single end hole, and are made out of stiff materials to provide excellent control (ie, “steerability”) to facilitate manipulation into specific chambers and vessels. Balloon-tipped catheters have soft shafts and, with the balloon inflated, tend to follow the course of blood flow.
DIAGNOSTIC CATHETERIZATION
Measurements during the catheterization include oxygen saturations and pressures in the cardiac chambers and great vessels. This information is used to calculate blood flows, intracardiac shunts, and vascular resistances. Angiography in one or more chambers or vessels is then done to define the cardiac anatomy.
 OXYGEN SATURATIONS
A small blood sample for oximetry is taken from each of the major vessels and cardiac chambers. Saturations are currently measured by spectrophotometry based on the difference between the maximal wavelength absorption of hemoglobin bound to oxygen (600 nm) versus deoxygenated hemoglobin (506.5 nm). Shunts are diagnosed by comparing oxygen saturations in great veins, chambers, and great vessels. This information must be interpreted with caution, as streaming may influence saturations, especially in the vena cavae and right atrium. For example, hepatic venous blood with medium saturation mixes poorly with highly saturated renal streams and less saturated femoral venous streams in the inferior vena cava. The lowest oxygen concentrations are found in coronary sinus blood, and because the coronary sinus enters just above the tricuspid valve, a sample in the right ventricle may be a little less saturated than one in the right atrium. Normally saturations should vary little through the right heart, less than 4%, so any increase in saturation of greater than 5% indicates a significant left to right shunt. An increase in oxygen saturation at a given level may be the result of a shunt at that level, a shunt at a more proximal level with streaming, or a shunt at a more distal level with regurgitation.
Although noninvasive methods, including echocardiography with color Doppler and nuclear medicine shunt studies, can be used to quantify cardiac shunts, calculation from oxygen saturation data remains the gold standard. Saturation data may be of limited use in quantifying multiple cardiac shunts. A patient with a large left-to-right atrial shunt has blood with very high oxygen saturation entering the right ventricle. A second shunt of equal magnitude at the ventricular level produces a relatively small additional increase in oxygen saturation. Consequently, multiple cardiac shunts are best delineated by using both oxygen saturation data and angiography.
Normal right-sided oxygen saturations range between 65% and 80%, depending on cardiac output and hemoglobin concentration. In patients breathing room air, left-sided saturations are usually 95% to 98%. This mild left-sided desaturation results from normal right-to-left shunting of desaturated pulmonary bronchial blood into the pulmonary veins.
 FLOWS, SHUNTS, AND RESISTANCES
Flows and shunts may be calculated by the Fick (oxygen content) method or by indicator dilution techniques that today are done with room temperature saline and thermistor catheters. The thermodilution technique is accurate and reliable except in patients with significant pulmonary or tricuspid regurgitation, or a significant intracardiac shunt. This technique is therefore primarily used in heart transplant patients, those with isolated pulmonary hypertension or isolated obstructive lesions, such as aortic stenosis or coarctation. Because shunts and regurgitation are common in congenital heart disease, the Fick method, using oxygen saturation and blood hemoglobin concentration, is much more widely used. It makes use of the fact that flow through an organ can be estimated by measuring the concentration of a substance (indicator) in arterial blood flowing to that organ, the amount of that substance added to or removed from blood as it passes through that organ, and the concentration of the substance in venous blood leaving that organ. 
 p =
p =  O2/Cpv–Cpa)
Where  P is pulmonary flow (L/min),
  O2 is oxygen consumption (mL/min), Cpv is pulmonary venous oxygen content (mL/L of blood), and Cpa is pulmonary arterial oxygen content (mL/L of blood).
Note that the calculation uses oxygen content, not oxygen saturation. Oxygen saturation refers to the percentage of hemoglobin in blood that is combined with oxygen, and is independent of hemoglobin concentration. In contrast, oxygen content refers to the total amount of oxygen in a volume of blood and includes physically dissolved oxygen in addition to that bound to hemoglobin. It is expressed as either milliliters of oxygen per deciliter (dL or 100 mL) or liter of blood or as volume percent. Clearly, the oxygen content of blood with 50% oxygen saturation and a hemoglobin concentration of 20 g/dL is nearly twice that of blood with 50% oxygen saturation and a hemoglobin concentration of 10 g/dL. 
With no right-to-left shunting, an aortic sample is preferable to a pulmonary venous sample because it is a mixture of blood from all four pulmonary veins. Similarly, with no left-to-right shunting, a pulmonary arterial sample is the best representative mixture of systemic venous blood.
In a steady state, the amount of oxygen utilized in the tissues is equal to the amount taken into the lungs, and systemic flow is calculated with the same equation and oxygen consumption. Without shunts the systemic arterial-venous (AV) oxygen difference is the same as the pulmonary AV oxygen difference, and the calculated pulmonary flow ( p) equals the systemic flow (
 s) or cardiac output. If there are shunts, then pulmonary and systemic flows must be calculated separately, the former from oxygen contents in pulmonary veins and pulmonary artery, the latter from aortic and mixed systemic venous blood.
PRESSURES
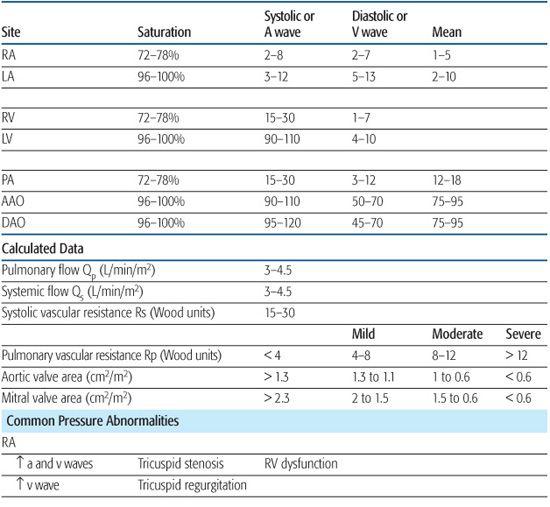
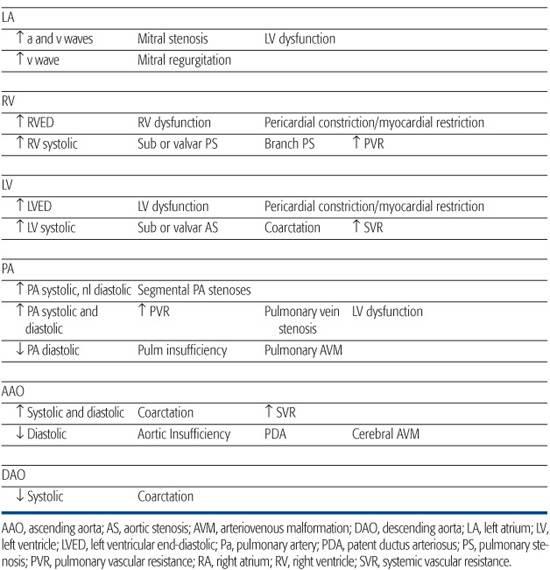
Pressures are recorded in each chamber and vessel entered and are monitored continuously during catheter manipulation to assist in determining catheter position. The volume of blood in a chamber or vessel, the size of the chamber or vessel, and the compliance of the walls will determine the pressure. Abnormalities in cardiac pressures can be used to diagnose congenital cardiac disease, so an understanding of normal physiology is key to recognizing abnormalities. Pressure signals from the transducers are sent to a recording device that displays them on a monitor and records them digitally for future reference. Normal pressures and common abnormalities are shown in Table 496-1. 
 VASCULAR RESISTANCE
The resistance to blood flow in the pulmonary and systemic circulations is calculated from the equations:
Rp = (mean PA pressure − mean PV or LA pressure)/ p
p
Rs = (mean Ao pressure − mean RA pressure)/ s
s
where PA and PV are pulmonary artery and vein, respectively, LA and RA are left and right atria, respectively, Ao is aorta, RP is pulmonary vascular resistance (mm Hg/L per min/m2 commonly known as resistance units/m2 or Wood units),  p is pulmonary flow (L/min/m2), RS is systemic vascular resistance (resistance units/m2), and
  s is systemic flow (L/min/m2). Most of the resistance to flow is at the arteriolar level, and the calculated resistance is inversely related to the cross-sectional area of the arteriolar lumen. In the systemic circulation, the calculated resistance is the combined value across several vascular beds in parallel. The normal systemic vascular resistance varies between 15 and 30 units/m2. Although high at birth, the pulmonary vascular resistance reaches values near low adult values after 2 to 4 weeks. So that these values can be compared at different ages, they are usually related to surface area. Normal values in children and adults are 1 to 3 units/m2. Elevation to 12 units/m2 suggests mild to moderate pulmonary vascular disease. Marked elevation to greater than 12 units/m2 often suggests significantly elevated pulmonary vascular resistance, which is unlikely to return to normal with vasodilators (“fixed” pulmonary vascular disease). When pulmonary vascular resistance is elevated patients are given inhaled pulmonary vasodilators (100 % oxygen, 40 ppm nitric oxide, or iloprost 2.5 to 5 mcg) in the catheterization laboratory and repeat pulmonary vascular resistance measured to determine vascular reactivity and the minimal pulmonary resistance. This information is often used to determine suitability for surgical repair or heart transplant, plan postoperative management, or to guide outpatient vasodilator therapy.
Stay updated, free articles. Join our Telegram channel

Full access? Get Clinical Tree


