The growth plate of the distal femur provides more to the longitudinal growth of the lower limb than any other growth plate, and the physis of the proximal tibia is the next most important. The specifics of the histology and microscopic anatomy of the physis, both similarities and differences, are beyond the scope of this chapter. However, the orthopedic surgeon involved in the care of skeletally immature patients with knee injuries, and particularly those performing surgery about the knee, should be well aware of some basic facts regarding the anatomy of, development of, and risk of injury to these growth areas.
Distal femoral physeal injuries comprise approximately 2% of all physeal fractures.1–3 The most common complication of distal femoral physeal fracture is growth disturbance with resultant angular growth abnormality or leg length discrepancy.2,4–6 The distal femoral physis possesses less stability against traumatic displacement and injury than the physis of the proximal tibia, which has a rate of traumatic injury approximately half that of the distal femur.2,7 The shape of the proximal tibial physis, with the anterior and distal projection of the tibial tubercle as well as the spanning collateral ligaments, and the buttress provided by the proximal fibula are thought to be protective against potentially injuring forces.2,7
Angular deformity or shortening have been reported in 39% to 50% of all patients sustaining a distal femoral physeal fracture.2,8–10 Patients from ages 2 to 12 years appear to be at highest risk of these complications.2 The specific mechanism of injury, the type of fracture by Salter classification, as well as the amount of potential growth remaining each play a role in this risk. In addition, there is a change in the anatomy of the distal femoral physis with increasing patient age that may contribute to this increasing rate. The gross anatomy of the distal femoral physis has been shown to be essentially “flat” up until approximately 2 years of age. After that time, the growth plate develops a more undulating course that puts more of the germinal zone of the physis at risk of injury, even in the face of a seemingly radiographically benign fracture pattern.
REVIEW OF ASSESSMENT OF SKELETAL GROWTH—DETERMINATION OF SKELETAL AGE
Management of orthopedic conditions in the face of a constantly changing skeleton is one of the fundamental issues facing the pediatric orthopedic surgeon as well as any physician involved with the care of musculoskeletal problems in children. As such, it is important to be familiar with the methods of assessing current and potential amounts of growth, as well as general development, in children. Many of these require the use of the skeletal (bone) age of the patient rather than the chronologic age. There are multiple methods available to generate this value.11
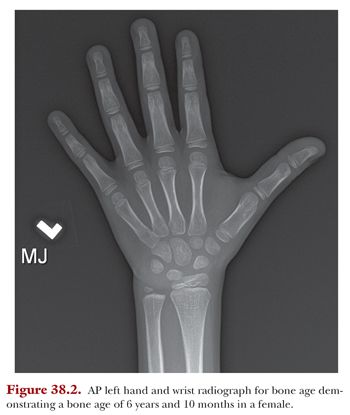
The Greulich and Pyle12 Atlas of Skeletal Development was published originally in 1950 and was based on Todd’s works that were published in 1937. Todd obtained multiple extremity images of 1,000 patients at 3-month intervals during the first year of life, every 6 months from 1 to 5 years of age, and then annually until skeletal maturity. Greulich and Pyle used these radiographs in their atlas to generate a standard for skeletal development of children based on radiographic changes that occur over time in the bones of the hand and wrist, as seen on a left hand and wrist anteroposterior (AP) radiographs (Fig. 38.2). A set of radiographs is provided for males and females due to the differences in skeletal development based on gender. The standard film that most closely resembles that of the patient in question is reported as the skeletal, or bone, age. Concerns exist regarding the validity of assumptions based on radiographic images obtained from patients with health and diet significantly different than found in modern pediatric patients. However, it is difficult to imagine a similar longitudinal radiographic study being generated at this time. Overall, the Greulich and Pyle atlas method is used most commonly at this time to determine skeletal age in pediatric orthopedic surgery.

This method is similar to the Greulich and Pyle technique in that the bone age determination is generated through examination of left hand and wrist AP radiographs of the patient in question.11 Specific bones are considered as “regions of interest.” These areas are then divided into epiphysis, metaphysis, and diaphysis. A numerical score is generated for each area, and then an overall maturity score and bone age are determined. There is some evidence that the Tanner and Whitehouse method may be more accurate and reproducible than the Greulich and Pyle technique.13 However, the relative complexity and time-consuming nature of the Tanner-Whitehouse method compared to the Greulich and Pyle atlas limits its use by orthopedic surgeons in clinical practice.
THE SHORTHAND BONE AGE ASSESSMENT
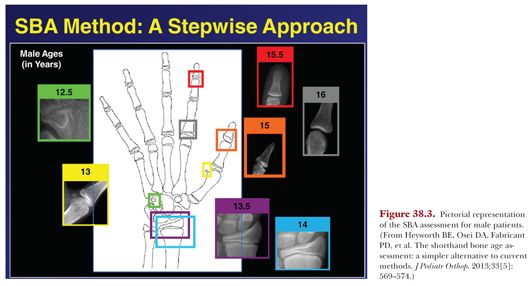
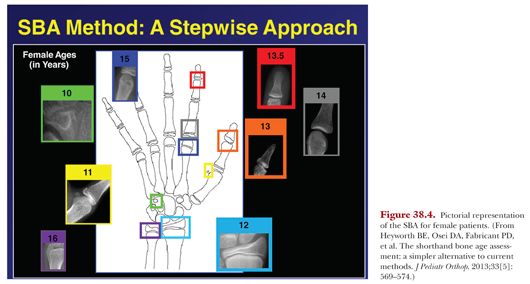
This method was developed over a number of years of clinical practice at the Hospital for Special Surgery (HSS) in New York and reported in the literature in 2013 by Heyworth et al.14 The shorthand bone age (SBA) assessment was derived from the Greulich and Pyle method in an attempt to simplify the determination of bone age and skeletal maturity for male patients between the ages of 12.5 and 16 years and for females between 10 and 16 years. Clinicians at HSS noted that certain specific radiographic findings on the bone age images appeared to correlate highly with specific ages within this patient population.
Briefly, the SBA uses a single radiographic finding, rather than multiple findings on the hand/wrist bone age image, that appear to correlate with skeletal age in patients around the time of puberty. This single radiographic finding correlated with bone age can then be separated by gender in a table or single sheet format (Figs. 38.3 and 38.4), which is easier to access and use than the Greulich and Pyle atlas.


Heyworth, et al.14 compared the SBA method with the use of the Greulich and Pyle atlas. They found substantial agreement between the two techniques with excellent intra- and interobserver reliability. As such, they felt that the SBA was a simple, valuable, and effective alternative to the use of the Greulich and Pyle method.
DETERMINATION OF LEG LENGTH AND POTENTIAL LEG LENGTH DISCREPANCY
Multiple methods exist to assist in prediction of leg length and possible leg length discrepancy. Each has its own value, and it is important to have some idea of the use of each technique. As the vast majority of the longitudinal growth of the lower limb occurs through the distal femoral and proximal tibial growth plates about the knee, these are the areas involved in the determination of limb length and potential limb length discrepancy. As such, manipulation of these growth plates through timed epiphyseal arrest is one of the primary interventions to address existing and predicted discrepancies.
Menelaus15 described a simple method that allows determination of growth remaining in the growth plates about the knee. It is based on a number of assumptions that hold true in most cases. These include the following:
1. Boys continue to have skeletal growth up to age 16 years and girls up to age 14 years.
2. The distal femoral growth plate provides ⅜ in (9 mm) per year of growth and the proximal tibial growth plate ¼ in (6 mm) per year.
By using this method, it is possible to generate reasonably accurate determinations of growth potential without specialized graphs and with simple calculations. However, it is limited by assumptions regarding chronologic and skeletal age and fails to take into account the fact that the growth rate of the physis is not constant. Overall, this method is useful in providing a reasonable estimate, but other methods are more accurate.
THE ANDERSON-GREEN (GROWTH REMAINING) METHOD
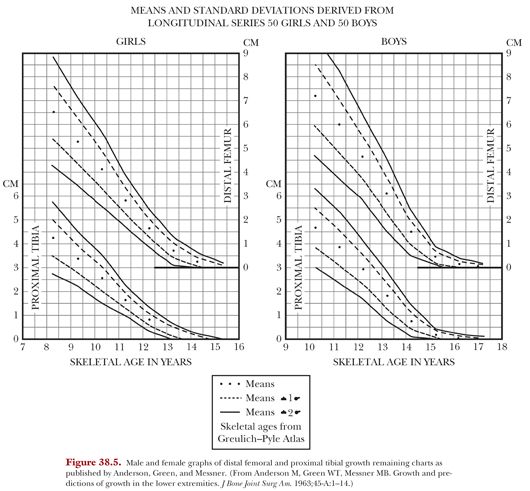
Anderson, Green, and Messner16 published longitudinal growth data on 100 children in 1963. They gathered data on the subjects once per year over the 8 years prior to cessation of growth. This data included orthoroentgenograms for bone length and left hand and wrist films for bone age, which was then determined using the Greulich and Pyle atlas. This information was used to generate a series of charts that depicted rates of growth of overall stature as well as growth of the femur and tibia in these patients. The data was further analyzed to generate graphs that provided growth remaining of the individual physes about the knee when reported against skeletal or bone age. These graphs are depicted in Figure 38.5.


