Summary and recommendations for research and practice
- Definitions distinguish between monitoring and screening. Monitoring is purposive, systematic measuring to determine trends over time, variation between populations or places, and so on. Screening is purposive, systematic measurement as well but its purpose is case finding, not the determination of population trends.
- The purpose (trends, differences in populations) and value (measuring leads to action, especially if it is local data fed back to local agencies) need to be considered.
- Childhood obesity does not meet the criteria for screening (mainly because of lack of evidence of effectiveness of interventions).
- There is debate about the obligations and value of feeding (interpreted) anthropometry information back to parents (and for adolescents to them individually).
- The methodology used for monitoring is poor in most cases and, therefore, should be a priority for establishing monitoring systems.
In this chapter I define monitoring as purposive, systematic measuring to determine trends over time, variation between populations or places, and so on. I define screening as purposive, systematic measurement as well, but its purpose is case finding, not the determination of population trends.
In many cases also the term surveillance is used interchangeably with monitoring. According to the Webster’s dictionary, clinical surveillance refers to the monitoring of diseases or public health-related indicators by epidemiologists and public health professionals. The differences between monitoring and surveillance are often obscure, although in many instances monitoring pertains to observations and surveillance comprises observations and actions. Surveillance, for instance, includes systems to detect “events” such as infectious disease out breaks. Frequently, however, a monitoring system is thought to be much more than just collecting and interpreting series of routinely collected data.
For instance, according to the United Nations Populations Fund a monitoring system consists of five critical elements1
1. definition of essential data to collect, including case definitions;
2. systematic collection of data;
3. organization and analysis of data;
4. implementation of health interventions based on the data; and
5. Re-evaluation of interventions.
According to the World Health Organization Framework Convention on Tobacco Control (WHO FCTC) surveillance is systematic ongoing collection, collation and analysis of data and the timely dissemination of information to those who need to know, so that action can be taken.2 Tobacco control surveillance includes prevalence of tobacco use, its health and economic consequences, its socio-cultural determinants and tobacco control policy responses and tobacco industry activities.
The WHO STEPwise approach to Surveillance (STEPS) is another example of standardized international monitoring activities of risk factors for chronic diseases. It is described as a standardized method for collecting, analysing and disseminating data in WHO member countries.3
By using the same standardized questions and protocols, all countries can use STEPS information not only for monitoring within-country trends, but also for making comparisons across countries. The approach encourages the collection of small amounts of useful information on a regular and continuing basis.3
This chapter does not use the term “surveillance” but rather addresses systematic collection and analysis of data as “monitoring”, and identifies individuals for interventions as “screening”.
Monitoring of obesity trends; prediction of future prevalence and health impact
The common form of monitoring is the analyses and interpretation of routine cross-sectionally collected data on indicators of overweight and obesity. These include weight and height derived indices such as BMI or waist circumference.
The monitoring (repeated prevalence data) of BMI in children could lead to the following benefits:4
- describing trends in weight status over time among populations and/or subpopulations at a school, district, state or nationwide level;
- creating awareness among school and health personnel, community members, and policy makers to the extent of weight problems in specific populations;
- driving improvement in policies, practices and services to prevent and treat obesity;
- monitoring the effects of school-based physical activity and nutrition programs/policies;
- monitoring progress toward achieving national health objectives or relevant state or local health objectives related to childhood obesity.
Well-known examples of monitoring systems that have included indicators of obesity are the National Health and Nutrition Examination Survey s (NHANES) in the United States.
NHANES has been an exemplary system historically as well as currently and has some unique features so it is described in some detail. Since its inception in 1959, eight separate Health Examination Surveys have been conducted and over 130,000 people have served as survey participants.
The first three National Health Surveys—National Health Examination Survey (NHES) I, II, and III—were conducted between 1959 and 1970. In 1969 it was decided that the National Nutrition Surveillance System would be combined with the National Health Examination Survey, thereby forming the National Health and Nutrition Examination Survey, or NHANES.
Five NHANES have been conducted since 1970. NHANES I (1971–1975), NHANES II (1976–1980), the Hispanic Health and Nutrition Examination Survey (HHANES 1982–1984), NHANES III (1988–1994).
Beginning in 1999, NHANES became a continuous survey. In 1999, 64% of the US population was overweight or obese, while the prevalence of obesity among children and adolescents had more than doubled during the previous two decades. Since then, further moderate increases have been observed, but there now seems to be a gradual leveling off in the trends.
The NHANES surveys have very high response rates (94–97%) and are based on measured weights and heights rather than being self-reported. For example, the Behavioral Risk Factor Surveillance System is the basis for the maps of the USA with states changing color over time indicating an increasing prevalence of obesity. In this Survey, which is based on self-reported heights and weights in adults in a nationwide telephone survey, it was found that the prevalence of obesity in 1999 was 18.9%. 5 At the same time, the prevalence of obesity in the NHANES was 30.5%.6 This profound difference illustrates that sampling and methodology may have important implications for assessing the problem of obesity. Misreporting of weight and heights are not only problems in surveys in adults. It has been shown that one quarter to one half of overweight adolescents would be missed if based exclusively on self-reported data.7 Actual and perceived body size are correlated with underreporting of overweight.8
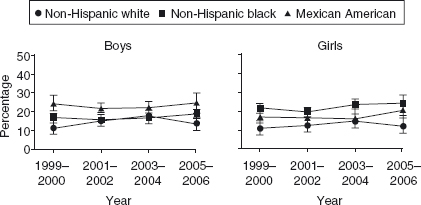
Figure 1 shows the time-trends of overweight and obesity in the period 1999–2006. The analyses showed no significant changes in the prevalence of obesity over the last seven years and it remained high at an overall figure of 16.3%.
Figure 21.1 Body Mass Index for Age at or Above the 95th Percentile in the United States by Race/Ethnicity in the period 1999–2006. 9

Globally there are few examples of continuous monitoring systems such as NHANES. In most countries data on obesity trends are available from either a series of unrelated surveys using different sampling methods as well methodologies, or from national heath interview survey data with usually relatively low response rates and based on self-reported heights and weights. It has been shown that correction for self-reporting bias is not appropriate unless reporting bias has been assessed in the population that is being studied.10
Good examples of systematic surveys in Europe are the National Child Measurement Programme (NCMP).11 The NCMP is one element of the government’s work program on childhood obesity, and is operated jointly by the Department of Health (DH) and the Department for Children, Schools and Families (DCSF). The NCMP was established in 2005. Every year, as part of the NCMP, children in Reception and Year 6 are weighed and measured during the school year to inform local planning and delivery of services for children; and gather population-level surveillance data to allow analysis of trends in growth patterns and obesity. The NCMP also helps to increase public and professional understanding of weight issues in children and is a useful vehicle for engaging with children and families about healthy lifestyles and weight issues. To encourage engagement, parents can request their child’s results from their Primary Care Trusts (PCTs).
In the school year 2007/2008, 973,073 valid measurements were received for children, in England, in Reception and Year 6—about 88% of those eligible. Using sex- and age-specific percentiles to define over-weight (85–95th percentile) and obesity (>95th percentile), it was observed that 14.3% and 18.3% of the children aged 10–11 (Year 6) were overweight and obese, respectively. Only 1.4% of the children could be considered underweight.
There has been a plea for an ongoing national population monitoring system covering selected ages at preschool, primary school and secondary school age in Australia.12
A good example of a long-standing systematic survey in Asia is the National Nutrition Survey in Japan (J-NNS),13 an annual nationwide survey on the nutrition and diet of the Japanese people. J-NNS was started in the Tokyo Metropolitan area in 1945 following the end of the Second World War. The survey area was expanded nationwide in 1948. The current survey obtains data from more than 12,000 persons of approximately 5,000 randomly selected households. The survey consists of three parts: a physical examination, a dietary intake survey and a dietary habit questionnaire. The physical examination includes anthropometric measurements and a blood test, the dietary intake survey examines nutrient/food intake with a semi-weighed recording method, and the dietary habit questionnaire monitors nutrition/diet-consciousness and dietary habits.13 Recent analyses of BMI distribution curves in Japanese women over six decades of surveys showed both decreases and increases over time, depending on the different age-groups.14
Critical elements of appropriate monitoring
Critical elements of monitoring are:
- Representativeness of the target sample. Selected samples in towns, regions or even neighborhoods or social strata can be difficult to interpret in terms of national prevalence data.
- Size of the sample (i.e. how fine-grained the data are for analyses by subgroups of age, sex, social class, etc).
- Frequency of measurements. For some estimate of secular trends at least three measures are needed (preferably more). If a survey is done every five years this implies that 15 years will have passed before any judgement regarding time trends is possible. Continuous monitoring systems are, therefore, preferable also because the continuity of methods is more easily realized when done continuously compared to measurements with relative long time intervals.
- Participation rate and selection bias. The characteristics of non-responders are usually difficult to determine but the possibilities exist that overweight and obese children are less likely to participate in health surveys (particularly when they are also used for case finding). This may be explained by their weight status directly but also of variables related to both overweight and participation such as socio-economic status.
- Validity of measurements. The validity of self-reported heights and weights is low, thus leading to misinterpretation about body composition, fat distribution and health risks.
Monitoring of (potential) determinants and consequences of obesity
Cross-sectional analyses of associations between potential determinants or consequences of obesity may lead to interesting hypotheses but usually inferences about temporal relationships or causation should be made with caution. There are, however, examples of evaluations of interventions using monitoring systems. The interpretations become easier if, for instance, sharp changes in determinants (e.g. physical activity or diet) occur in one part of the population but not in others and are followed by changes in the health outcome (e.g. obesity prevalence) in the part of the population where the determinants changed.
Dietary habits and physical activity patterns may not only cause weight gain and obesity but obese people may also change their habits as a result of their weight status. This, for instance, can produce associations between dieting and obesity but the causal relationships are unclear. An example of this can be found in the study in adolescents in New Zealand by Utter et al.15 Examination of the nutritional correlates of BMI in the total population found inverse relationships between BMI and consumption of high-fat/high-sugar foods and positive relationships between BMI and eating five or more fruits and vegetables a day (all significant after controlling for age, sex and ethnicity). For example, students who drank the most soft drinks or ate fruit and vegetables infrequently had the lowest mean BMI. Students ’ attempts to change their weight significantly moderated the relationships between most nutritional behaviors and BMI. In most cases, among students not trying to change their weight, expected relationships were observed; among students trying to lose weight, unexpected or no relationships were observed. The authors conclude that among this population of predominately overweight students, solely relying on cross-sectional findings between nutrition behaviors and BMI would misinform intervention strategies.15
In addition, other factors may affect associations between potential determinants and obesity. For instance, it is frequently observed that, in cross-sectionally collected survey data, increasing age is associated with higher BMI and obesity until the age of about 60–65, when it levels off, and even older ages are associated with lower BMI and obesity levels. This, as has been argued elsewhere16 may reflect premature mortality among obese people but also true decreases in obesity in old age due to weight loss from illnesses or age-related loss of appetite. It may also reflect that older people in a survey have a different life history (i.e. they may have been born and raised in times when obesity was much less common than today). This latter explanation is called a cohort effect. In fact, Nooyens et al recently showed that older people do have lower mean BMI compared to middle-aged people but, when followed prospectively, also, older people gain weight.17 This example is taken from data in adults but clearly, age-period-cohort effects are also present in children and adolescents.
There are many methodological pitfalls to consider in the interpretation of secular trends in overweight and obesity, as well as risk factors and disease incidence. The associations between these trends usually depend on the strengths of the association between obesity and a particular disease, and the time lag between the onset of obesity and the incidence of disease. For instance, the rise in the prevalence of type 2 diabetes is usually related to an increase in the prevalence of obesity because of the strength of the association between the two.18 Time trends in obesity, on the other hand, may not be related to trends in the incidence of cardiovascular disease19,20 or cancer.21 This is because of the relatively low risk associated with obesity, the importance of many other risk factors for these diseases that may be unrelated to changes in obesity and the long lag-time between obesity and the incidence of cardiovascular disease endpoints and different types of cancer. This means, for instance, that there is a decreasing secular trend observed in cardiovascular risk factors and the incidence of cardiovascular disease when at the same time there is an increase in the prevalence of obesity. 19,20 This is despite the fact that, on an individual basis, there is a significant association between measures of overweight such as BMI and cardiovascular risk.19,20
As population characteristics change over time, these changes may have an influence on relative risk estimates of obesity for diseases, such as cancer, for other exposures because of effect-measure modification. The impact of population changes on comparability between epidemiologic studies can be kept to a minimum if investigators assess obesity-disease associations within strata of other exposures, and present results in a manner that allows comparisons across studies. Effect-measure modification is an important component of data analysis that is needed to obtain a complete understanding of disease etiology.22
Monitoring determinants and consequences of obesity can, therefore, lead to interesting hypotheses about potential explanations of associations but are usually weak in their level of evidence for causal relationships. These methodological problems also hamper the evaluation of effectiveness of policy interventions on obesity and health.
Screening—measuring children for obesity case finding
When heights and weights are routinely monitored, there is will be individuals who meet the criteria for overweight or obesity. If the data are subsequently reported to the children and/or their parents, or are followed by referral to interventions, this would bring monitoring into the realms of screening. In essence, it would be screening for individuals who may benefit from interventions aimed at weight gain prevention or weight management, even though the primary purpose of the measurement may have been for monitoring population trends
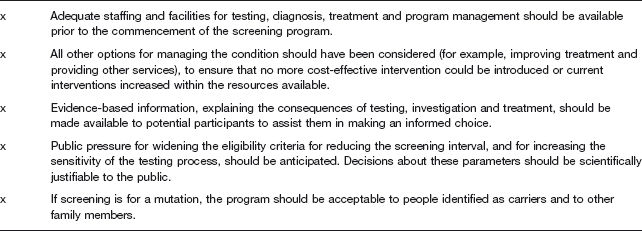
Following the original criteria for screening by Wilson and Jungner23 and published by WHO in 1968, there have been more extensive lists of criteria for the viability, effectiveness and appropriateness of a screening programme (see below) (Table 21.1).
Table 21.1 Criteria for appraising the viability, effectiveness and appropriateness of a screening programme 2003 by the UK National Screening Committee.24 ( condition met; p condition partially met; x condition not met (rating from reference4).


Stay updated, free articles. Join our Telegram channel

Full access? Get Clinical Tree


