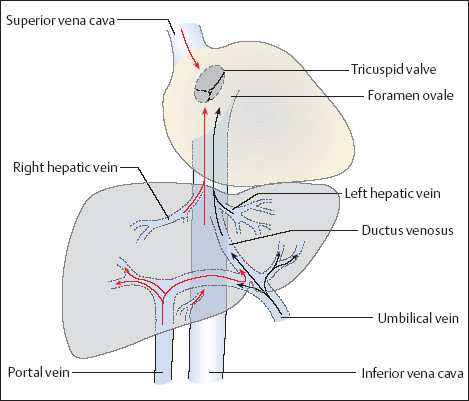
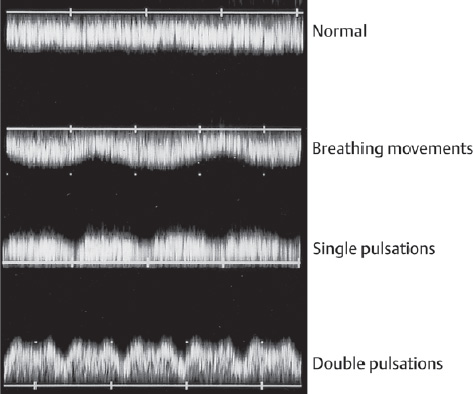
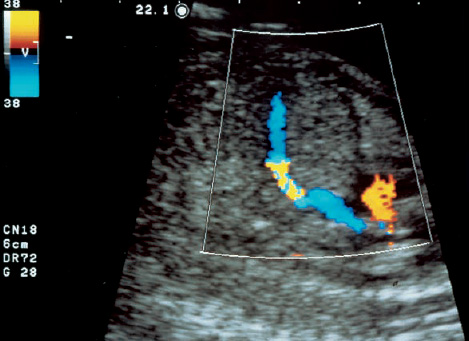
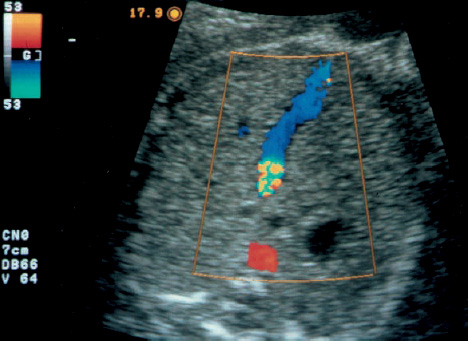
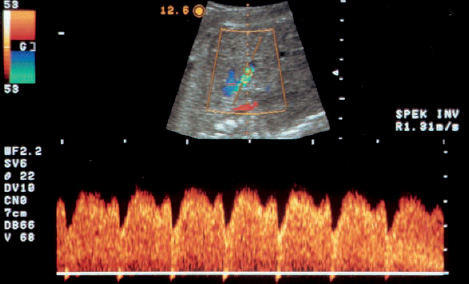
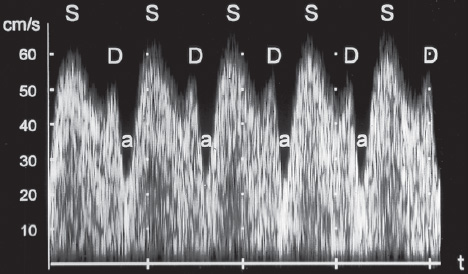
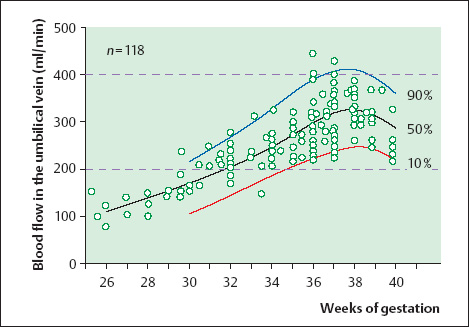
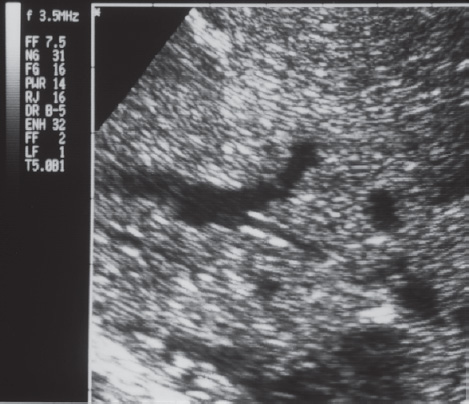
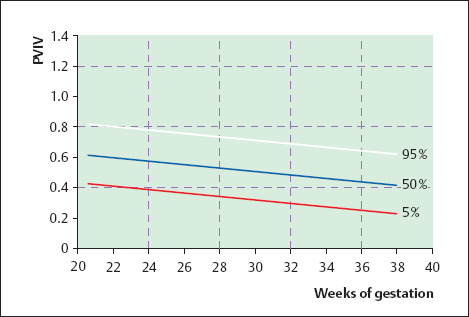
16 Venous Doppler Sonography Since its initial description by Fitzgerald in 197713, the Doppler ultrasound assessment of the fetomaternal vascular system has become widely utilized in the surveillance of high-risk pregnancies. In the past, scientific and clinical attention was focused primarily on examination of the uteroplacental vascular system and on the arterial system of the fetus. In recent years, there have been increasing numbers of Doppler ultrasound studies of the physiological and pathophysiological changes in the fetal heart and circulatory system, with special emphasis on the cardiac and venous vascular systems. Although Doppler studies of volume flow in the intrahepatic umbilical vein were already being done in the early 1980 s, this method has not become widely established because of its poor reproducibility11,12,18,19,20,35,36,41. With technical advances in ultrasound instrumentation and especially the advent of color Doppler sonography, it became possible to make a detailed evaluation of the fetal venous system. Besides the umbilical vein, inferior vena cava, and hepatic veins, Doppler examination of the ductus venosus has become a particular object of current scientific interest. Streaming effect. The ductus venosus represents the first of three specific shunts in the fetal circulation and appears to be an important regulator in the distribution of oxygen-enriched blood. Studies in experimental animals have demonstrated the existence of two different directions of blood flow (streaming effect) in the thoracic portion of the inferior vena cava9. Studies in fetal lambs showed that approximately 50% of oxygenated umbilical venous blood flows through the ductus venosus. The narrow ductal lumen causes marked acceleration of the blood flow, creating a stream in the left dorsal portion of the inferior vena cava with the preferential direction of flow through the foramen ovale into the left atrium and left ventricle. This streaming mechanism ensures an optimum oxygen supply to the brain and myocardium. The considerably slower blood flow in the distal inferior vena cava forms a stream in the right ventral portion of the inferior vena cava that is directed into the right atrium and then into the right ventricle (Fig. 16.1). This streaming effect appears to be supported by the crestlike caudal border of the foramen ovale9. Similar findings were made in color Doppler studies of human fetuses42. An approximately 70% increase of blood flow through the ductus venosus was documented in response to hypoxemia in fetal lambs10. The exact pathophysiological mechanism of this effect is still uncertain. Quantitative determination of blood flow. Eik-Nes and Gill11,18 used Doppler ultrasound to evaluate fetal blood volume in the early 1980 s. They found a relatively constant mean volume flow of 110–125 ml/(kg min) in the third trimester, which decreased to 90 ml/(kg min) toward the end of pregnancy11,12,18 (Fig. 16.2). The following formula (equation 1) is used for the quantitative determination of blood flow in the umbilical vein47: Fig. 16.1 “Streaming effect” demonstrated by experimental studies in fetal sheep9. QVU = V × (D/2)2 × π × 0.6 ml/min Venous umbilical blood flow in this equation (QVU) is dependent on the blood flow velocity (V) and the vascular crosssectional area (D/2)2 × π. The quantitative analysis of umbilical blood flow is problematic, however, in that even slight deviations in the vessel diameter lead to a large scatter of flow values47. Because of its poor reproducibility, this quantitative method of blood volume determination is not widely utilized12. Fig. 16.2 Mean volume flow in the umbilical vein during pregnancy19. Fig. 16.3 Normal and abnormal umbilical venous Doppler spectra. Locating the umbilical vein. Doppler spectra are recorded from either the intra-amniotic or intrahepatic segment of the umbilical vein. The intrahepatic segment is preferred for its better reproducibility11,12,18. It is sampled by imaging the fetal abdomen in a transverse plane and placing the sample volume at an acute angle (<30°) in the central part of the intrahepatic umbilical vein11. Findings. The umbilical venous waveform generally shows a monophasic pattern with a mean flow velocity of 10–15 cm/s. Under physiological conditions, umbilical vein pulsations occur until the end of the first trimester or in response to fetal breathing movements33,58 and normally are no longer seen after 13 weeks’ gestation. Umbilical vein pulsations in the second or third trimester may signify a cardiac anomaly or congestive heart disease, or they are commonly associated with absent end-diastolic flow in the umbilical artery as a result of chronic placental insufficiency22,49 (Fig. 16.3). Umbilical vein pulsations in these cases show a temporal correlation with atrial systole and are an expression of myocardial insufficiency. Pulsations in the umbilical vein may take the form of single pulsations, double pulsations, or a triphasic Doppler spectrum1,3,22,49. A markedly increased mortality rate of 50–60% is reported when these flow patterns are detected22,33,49. Locating the ductus venosus. The ductus venosus and its flow pattern can be demonstrated with two-dimensional real-time ultrasound and also with color Doppler (Fig. 16.4). Of all the precardial veins, the ductus venosus yields the best and most reliable information on the myocardial hemodynamics and function of the fetal heart, with good reproducibility of the Doppler spectra61. Doppler signals are recorded most easily and quickly when the fetus is in a dorsoposterior lie. For rapid venous orientation, the intrahepatic portion of the umbilical vein should be imaged first. The best view is obtained in either a midsagittal plane or oblique transverse plane of the fetal abdomen24,30,42,43. The entry of the intrahepatic umbilical vein into the ductus venosus is located in continuity with the vein. The diameter of the ductus venosus rarely exceeds 2 mm and shows a slight funnel-shaped expansion up to 20 mm long44. A marked difference in blood flow velocities between the umbilical vein and ductus venosus can be recognized with color Doppler. The 3–4 times higher flow velocity in the ductus venosus causes aliasing, which appears as an area of color reversal (Figs. 16.5, 16.6). Flow signals are acquired by positioning the Doppler sample volume directly at the entrance to the ductus venosus, at the site of the color reversal24,42 (Fig. 16.7). The width of the sample volume should just cover the vessel lumen to avoid detecting signals from the adjacent hepatic veins and umbilical vein. The use of color Doppler makes it much easier to locate the ductus venosus and accurately position the sample volume. Owing to the funnel shape of the ductus venosus, the flow velocities directly at the entrance are higher than at the outlet53. An insonation angle less than 30° (or 50°) is recommended to obtain an optimum waveform44. The wall filter should be set as low as possible—between 125 Hz and 100 Hz, depending on the type of equipment used. Waveforms and indices. A sonographer experienced in Doppler ultrasound can obtain clear Doppler signals from the ductus venosus in 94% of cases24. The normal velocity waveform of the ductus venosus exhibits continuous, triphasic forward flow throughout the cardiac cycle. Absent or low pulsatility is noted in 3% of cases and is considered a normal variant44; a brief waiting period is recommended in these cases. The maximum flow velocities in the ductus venosus are the highest in the venous system and appear to be responsible for the “streaming effect.” As in the arterial system, the flow velocities in the ductus venosus are dependent upon gestational age, fetal breathing and body movements, and the fetal heart rate44. The maximum blood flow velocity rises on average from 65 cm/s to 75 cm/s between 18 and 40 weeks’ gestation44. The blood flow velocity in the ductus venosus can rise to double or triple the normal value during inspiration, depending on the intensity of the breathing movements. Fig. 16.4 B-mode image of the portal sinus with the origin of the ductus venosus. Dorsoposterior lie (27th week). Fig. 16.5 Midsagittal scan through the fetal abdomen demonstrates the course of the umbilical vein (blue) and its junction with the ductus venosus (yellow). The color reversal (aliasing) marks the site where the flow velocities are highest. Dorsoposterior lie (30th week). Fig. 16.6 Oblique transverse scan through the fetal abdomen (34th week) demonstrates the course of the umbilical vein (blue) and its junction with the ductus venosus (yellow). Fig. 16.7 Color recording of the Doppler spectrum at the entry of the umbilical vein into the ductus venosus shows the typical triphasic, antegrade flow pattern. Fig. 16.8 Normal triphasic waveform of the ductus venosus: maximum antegrade blood flow velocities during ventricular systole (S), early ventricular diastole (D), and atrial contraction (a). The quantities that are determined for ductus venosus waveform analysis are the maximum flow velocities during ventricular systole (S), ventricular early diastole (D), and ventricular late diastole (atrial contraction [a]) (Fig. 16.8). Hemodynamically, these phases reflect the rapidly time-varying pressure gradient between the umbilical vein and right atrium. The highest pressure gradient between the ductus venosus and right atrium occurs during ventricular systole. This gradient is produced by the descent of the atrioventricular (AV) valve plane, resulting in antegrade flow that fills the atria. Subsequent early diastole is marked by opening of the AV valves and passive filling of the ventricles. This phase corresponds to the E component of the biphasic atrioventricular waveform. During atrial contraction, which coincides with the A component of the atrioventricular waveform, the foramen ovale closes and the rest of the atrial blood volume is actively pumped into the right ventricle. By analyzing these patterns, the sonographer can obtain information on the end-diastolic right ventricular pressure and the central venous pressure. The angle-independent parameters listed in Table 16.1 are used for the qualitative assessment of pulsatility. These parameters can be used to evaluate the cardiac preload8. Fig. 16.9 Ductus venosus. Preload index (S–a)/D of Hecher (1994). PVIV = peak velocity index for veins. Normal and abnormal changes during the course of pregnancy. The end-diastolic ventricular pressure declines with advancing gestational age as a result of placental maturation processes that lower the placental resistance. This decrease is manifested by a decline of venous pulsatility and falling preload indices and is due mainly to the rising flow velocity during atrial contraction (Figs. 16.9, 16.10). A rise in the preload indices reflects an increased end-diastolic ventricular pressure in the heart. In a healthy fetus, the umbilical venous pressure during atrial contraction is higher than the central venous pressure. When there is severe centralization of the fetal circulation due, for example, to chronic placental insufficiency or hypovolemia, a hypoxia-induced myocardial insufficiency develops, leading to a rise of central venous pressure in the fetal right heart. The result is a fall of maximum flow velocities in the ductus venosus or even reverse flow during atrial contraction (Fig. 16.11)23,25,27,46,62. Complete cardiac exhaustion and decompensation are manifested by sinus bradycardia, which is marked by a decrease in systolic and early diastolic antegrade flow velocities and an increase in retrograde late diastolic flow velocities.
Historical Development
Physiology
Umbilical Vein
Ductus venosus
| Index | Author |
|---|---|
| a/S | Kanzaki (1990)37 |
| S/D | Huisman (1991)29 |
| (S–a)/S | De Vore (1993)8 |
| (S–a)/D | Hecher (1994)24 |
| (S–a)/Tamx | Hecher (1994)24 |
S = systole, D= diastole, a = atrial contraction, Tamx = time-averaged maximum velocity.
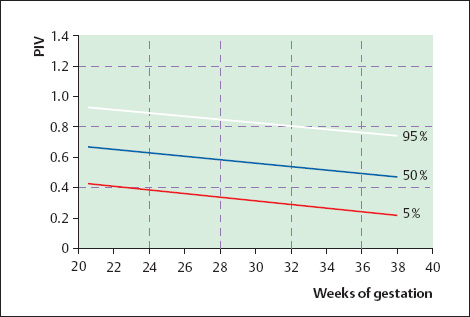
Fig. 16.10 Ductus venosus. Preload index (S–a)/Tamx of Hecher (1994). PIV = pulsatility index for veins.
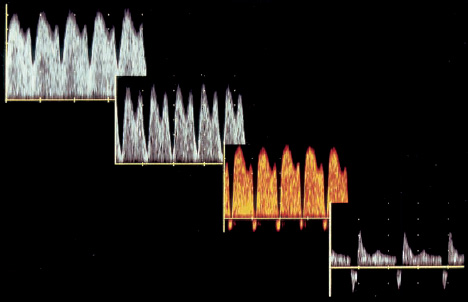
Fig. 16.11 Normal and abnormal ductus venosus Doppler spectra in fetuses with severe asymmetrical intrauterine growth retardation due to chronic placental insufficiency. The increase in pulsatility caused by a slowing or reversal of flow during atrial contraction reflects the increasing degree of fetal compromise.
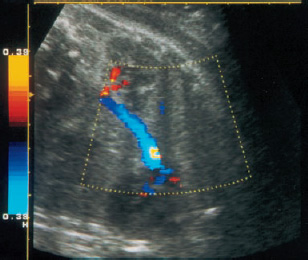
Fig. 16.12 Color-flow image of the inferior vena cava in a parasagittal plane.
Inferior Vena Cava
Locating the inferior vena cava.
Stay updated, free articles. Join our Telegram channel

Full access? Get Clinical Tree


