Therapeutic Drug Monitoring
Alexander A. Vinks
Philip D. Walson
Introduction
The simplest way to identify interindividual variability in drug response is to objectively measure the degree of effect and then adjust the dosing regimen accordingly. However, such a straightforward approach is seldom feasible, as simple and reliable therapeutic effect measures are not always available in routine clinical situations. In addition, many serious conditions require rapid attainment of adequate clinical effect without excessive dosing, and effects are especially difficult to document in some patients, especially newborns and other nonverbal or uncooperative patients. Rational pharmacotherapy is dependent on a basic understanding of the way patients handle drugs (pharmacokinetics, PK) and their response (effect) to specific drug concentrations (pharmacodynamics, PD) (1). PK may be simply defined as what the body does to the drug, as opposed to PD, which may be defined as what the drug does to the body (2). Advances in the fields of PK and PD, including the development of sensitive and specific methods for concentration measurements in biological fluids, have expanded our understanding of the time course of drug concentrations in plasma and the processes (absorption, distribution, metabolism, and excretion) that influence the amount of drug that reaches target organs and tissues. The ultimate goal of understanding dose–exposure–effect relationships is to derive optimum individualized dosing regimens with maximal therapeutic and minimal side effects with the simplest dosage regimen possible. This can best be achieved by linking PK and PD information to better understand or predict the exposure–effect–time relationship. The proper measurement and interpretation of drug concentrations [therapeutic drug monitoring (TDM) or better “management”] in a specific patient can help us better understand how a particular drug is behaving and will also allow for further individualization of the dosing regimen in that patient as well as how to best select an initial dosing regimen in future patients (3).
The Target Concentration Strategy
Drug actions (effects) are directly related to the drug concentration at the site(s) of action. Although imperfect, there is almost always a better relationship between the effect of a given drug and its concentration in the blood than between the dose of the drug given and the effect. PK is the science that can explain and predict the relationship between a dosing regimen and the concentration of a drug in various body compartments over time. A basic understanding of PK principles and how these principles are altered in the developing child are required to better understand and predict drug actions. In Figure 9.1, the interrelationship among drug input (dose), PK, PD, and clinical effects is schematically conceptualized.
There are many practical, physiologic, and pathophysiologic factors that determine how much drug effect will be associated with a drug prescription. Clinicians make a diagnosis and then prescribe a dosing regimen: drug, dose, formulation, route, frequency, and duration. Once a drug is prescribed, there are many factors that determine how much effect, either therapeutic or toxic, is seen in the individual patient. Prescriptions must be filled correctly, the prescription filled must contain the correct drug and amount, the dosage regimen must be taken/given (adherence), and the drug must get into the patient and reach the site(s) of action. There are many reasons why concentrations and drug exposure (and therefore the effects) that result from prescriptions differ among patients. Even if taken or given exactly as desired, effects produced will depend on many factors including the patient’s physiology, prior history, and other drugs present. Patients/parents may never fill the prescription. Up to 25% of patients do not fill prescriptions, and even more do not take medication as indicated. Children and adolescents with chronic illness have great difficulty completing prescribed treatment regimens, which can be complex and burdensome. High rates of nonadherence to treatment (up to 50% or more) have been reported for various pediatric chronic conditions, such as asthma, epilepsy, transplantation, juvenile rheumatoid arthritis (JRA), and diabetes (4,5,6). Different formulations of the same drug may have different absorption characteristics. Manufacturing problems can and do occur. Pharmacy or pharmaceutical errors can alter the amount of drug delivered or in fact which drug is given, and parents or patients may or may not comply with instructions. All of these factors can alter the amount of drug that reaches the site of action. Several studies have
documented the unpredictable drug delivery in neonates. This is especially relevant for antibiotics such as aminoglycosides that are used frequently to treat bacterial infections in this population. A lack of appreciation of drug delivery issues such as the small volumes and low infusion rates used in these patients can result in a much lower than expected blood concentrations and much lower than what is required for optimal antimicrobial therapy (7). Drug concentration measurements can provide an objective way to identify, explain, or eliminate uncertainty caused by a number of these factors, especially in patients who have unusual or unexpected drug responses. However, even patients who actually take or are given the same amount of a drug may also have very different amounts of drug in their body or blood at different times after dosing. The ability to predict and explain the inter- and intraindividual differences in drug concentrations over time requires knowledge of basic PK principles.
documented the unpredictable drug delivery in neonates. This is especially relevant for antibiotics such as aminoglycosides that are used frequently to treat bacterial infections in this population. A lack of appreciation of drug delivery issues such as the small volumes and low infusion rates used in these patients can result in a much lower than expected blood concentrations and much lower than what is required for optimal antimicrobial therapy (7). Drug concentration measurements can provide an objective way to identify, explain, or eliminate uncertainty caused by a number of these factors, especially in patients who have unusual or unexpected drug responses. However, even patients who actually take or are given the same amount of a drug may also have very different amounts of drug in their body or blood at different times after dosing. The ability to predict and explain the inter- and intraindividual differences in drug concentrations over time requires knowledge of basic PK principles.
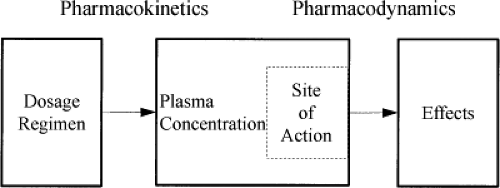 Figure 9.1. Schematic representation of the interrelationship among drug input (dose), pharmacokinetics (concentration), pharmacodynamics, and clinical effects. |
The Concept of Therapeutic Drug Monitoring
TDM is defined as the measurement made in the laboratory of a parameter that, with appropriate interpretation, will directly influence dosing. Commonly, the measurement is of a prescribed drug in a biological matrix, but it may also be of a drug taken as a result of a medication error or poisoning or of an endogenous compound prescribed as replacement therapy in an individual who is physiologically or pathologically deficient in that compound (11). It is perhaps more appropriate to consider TDM as therapeutic drug management (C. Pippenger, personal communication, May 2003). The rationale for TDM of a given drug is based on three important requirements: (a) there is a better association between the concentration and the therapeutic effect than between the dose and the effect, (b) TDM and dose individualization will reduce variability and will better predict the patient’s concentration–time profile, and (c) maintenance of drug concentrations within desired target ranges (see later discussion) improves clinical outcome by either increasing efficacy, reducing toxicity, or both (12). Proper TDM requires that dosing regimens are then further individualized based on individual measured concentrations and responses. The criteria for monitoring (managing) drugs in children are similar to those in adults. Generally accepted indications for concentration measurements are summarized in Table 9.1.
Table 9.1 Indications for Therapeutic Drug Monitoring | ||||||||
|---|---|---|---|---|---|---|---|---|
|
In pediatrics, use of TDM has been common in (a) the treatment of epilepsy (13,14), (b) transplantation (15), and (c) drug therapy in neonates (16) as opposed to adult medicine, where TDM is used in the management of many more diseases including psychiatric and cardiac diseases. Evolving areas where pediatric TDM has important uses include the anticancer drugs, psychiatric conditions, and infectious diseases including antifungal (17) and anti-HIV therapy with drugs such as protease inhibitors (18,19).
The Therapeutic Range Concept
Despite decades of TDM, recommended concentrations (therapeutic ranges) are largely empirical, population rather than individually based, independent of assay method used, seldom consider time after dosing, and seldom are the result of evidence-based studies. The therapeutic range is also commonly misunderstood even for commonly monitored drugs such as digoxin, aminoglycosides, phenobarbital, phenytoin, and theophylline. Interpretation of TDM results is still almost exclusively focused on altering dosing to get measured concentrations within a published “therapeutic range” (20). The “therapeutic range” is defined as the range of drug concentrations associated with a high degree of efficacy and a low risk of dose-related toxicity in the majority of patients. This is not the same as the optimal concentration for each individual patient. Furthermore, the emphasis in measuring drug concentrations has been mostly toxicity oriented and for drugs with narrow therapeutic indexes. The “therapeutic range” concept is hampered by some important problems (21). First, defining a single, time-independent concentration range leaves the physician with the uncertainty of how to choose the optimal dose when in fact a range of dosing regimens would produce a “therapeutic concentration” at some time in the regimen. Second, the definition of a therapeutic range does not differentiate among concentrations but assumes that all concentrations within the range may be equally desirable. Third, the ranges depend on a number of other things, including time after a dose, time on a particular regimen, the condition being treated, the assay
used, and the possibility of active metabolites. Problems created by assays with different specificity for active and inactive metabolites or interfering substances are more commonly a problem in pediatric than in adult patients. Poor understanding of the therapeutic range has led to a rather naive and even potentially dangerous “numbers-only,” three-step, all-or-nothing interpretation of the concentration–effect relationship. This simplistic approach assumes that any concentration below the lower end of the range will be of no benefit to the patient, that anywhere within the range the patient will be okay, and that above the upper end of the range the patient will experience unacceptable adverse reactions. None of these may be true in any given patient.
used, and the possibility of active metabolites. Problems created by assays with different specificity for active and inactive metabolites or interfering substances are more commonly a problem in pediatric than in adult patients. Poor understanding of the therapeutic range has led to a rather naive and even potentially dangerous “numbers-only,” three-step, all-or-nothing interpretation of the concentration–effect relationship. This simplistic approach assumes that any concentration below the lower end of the range will be of no benefit to the patient, that anywhere within the range the patient will be okay, and that above the upper end of the range the patient will experience unacceptable adverse reactions. None of these may be true in any given patient.
Distribution Phase
Immediately after administration, drugs must distribute into the blood and then to tissues in the body. This results in initial concentrations that are much higher than, and which do not show a log linear correlation with, postdistributional concentrations. This is true for most, if not all, drugs given intravenously, and for several drugs (e.g., digoxin and clonazepam), this phenomenon also occurs after oral administration. There are large differences between trough and distribution concentrations even for very long half-life drugs. Digoxin, for example, can have postdose peak concentrations of 3 to 5 ng per mL in patients with trough concentrations of less than 1 ng per mL. There are also greatly different concentration effect relationships between distribution and postdistributional concentrations at the site of action (22). If not appreciated, this can lead to inappropriate decreases in digoxin doses or even use of digibind (personal experience). Unfortunately, many physicians believe, and teach, that sampling time is not important for drugs with long half-lives because concentrations are not expected to change much when dosing intervals are much less than the drug’s half-life. Although true well after completion of the distribution phase, this is not true when comparing trough values with concentrations obtained during distribution. Randomly collected clonazepam concentrations have been used to claim that there is a poor relationship between concentrations and effect. However, it is highly likely that this conclusion is based on the fact that clonazepam, despite having relatively slow clearance, also has very high distribution concentrations relative to predose (trough) concentrations even after oral administration (23). Concentrations drawn during the distribution phase (4 to 6 hours after dosing) will not correlate with effects because they do not reflect the effect site concentration. PK modeling of digoxin or clonazepam with respect to concentrations at their sites of action (heart muscle and brain, respectively) is needed to attempt to correlate concentrations and effect. Bayesian modeling, but not linear correlation methods, can deal with sampling during the distribution phase, but sampling and accurate information on administration time becomes even more critical (22,24). Unfortunately, in pediatrics the time of drug administration is not as easy to determine as it is in adults. Decades ago, Leff and Roberts showed that it can take hours for drugs put into an intravenous setup to actually reach the patient (25). This is still true to date, as the delivery of drugs administered by intravenous infusion in extremely low-birth-weight neonates can be substantially extended due to the small volumes and low infusion rates used in these patients (26). Appreciation of both distribution phase sampling as well as the practical problems of ascertaining actual drug administration time for different intravenous setups, fluids and administration rates, and sites are required to properly interpret some drug concentrations.
Reactionary Therapeutic Drug Monitoring
Many clinical laboratories offer some form of TDM menu. However, test results are commonly reported as “numbers only,” in a similar fashion as general chemistry test results (e.g., serum sodium). This type of reporting is misleading and does not optimally use what we know about drug concentrations. As opposed to most endogenous compounds, drug concentrations are not stable over time and are governed by known and predictable PK principles. In addition, more in-depth interpretations (i.e., PK consultation), with the possible exception of aminoglycosides and vancomycin, are seldom offered. As a result, dose adjustments frequently are made on an ad hoc basis relying on one or more “numbers” (i.e., concentration measurements) within or outside a “therapeutic range.” This can best be described as “reactionary TDM,” where a standard dose is administrated and a concentration is checked to verify whether it is “therapeutic.” The process is often toxicity driven; if the level is “toxic” (i.e., above the “therapeutic range”), the dose will be lowered and the level will be checked again. If the level is “subtherapeutic,” the dose may be increased, with measurements being repeated until “therapeutic.” If the first measurement is within the therapeutic range, things are considered “okay” and no further action is taken. It is obvious that this reactionary TDM does not take into consideration the full concentration–time profile, individual differences, time to attain steady-state, or patient-specific PD targets. It does not lead to efficient use of resources, and has not been shown to produce optimal outcomes. However, many studies have documented that proper pharmacokinetic/pharmacodynamic (PK/PD) guidance, but not “reactionary TDM,” is effective. Such guidance can improve overall use of resources and produce better and more cost-efficient outcomes, fewer inappropriately drawn samples, more levels within the desired range, fewer dose adjustments, and reduction in the incidence of adverse events (27,28,29).
Developmental Pharmacokinetic Aspects*
Proper PK/PD guidance is especially important in patients with rapidly changing handling of drugs (PK) and responses (PD). Although this applies to most seriously ill, hospitalized patients, it applies especially to neonates and children because of large, often rapid developmental
changes in both PK and PD (30,31). The developmental changes in PK of medications that occur between birth and adolescence/adulthood create challenges for physicians who desire to prescribe medications on a rational, age-appropriate, individual basis. Routine TDM of prescribed drugs and their active metabolites can be of great help to individualize dose requirements during long-term treatment (12). In addition, the ratio of metabolite(s) to parent drug can also give important information on (non)adherence and can reveal unusual metabolic patterns.
changes in both PK and PD (30,31). The developmental changes in PK of medications that occur between birth and adolescence/adulthood create challenges for physicians who desire to prescribe medications on a rational, age-appropriate, individual basis. Routine TDM of prescribed drugs and their active metabolites can be of great help to individualize dose requirements during long-term treatment (12). In addition, the ratio of metabolite(s) to parent drug can also give important information on (non)adherence and can reveal unusual metabolic patterns.
Table 9.2 Age-Related Differences in Pharmacokinetic Parameters for Aminoglycosides and Vancomycin | |||||||||||||||||||||||||||||||||||||||||||||
|---|---|---|---|---|---|---|---|---|---|---|---|---|---|---|---|---|---|---|---|---|---|---|---|---|---|---|---|---|---|---|---|---|---|---|---|---|---|---|---|---|---|---|---|---|---|
| |||||||||||||||||||||||||||||||||||||||||||||
Increasingly, proper interpretation of measured drug concentrations is being used to provide important insights into the different PK behavior in neonates, children, and adolescents (32). Of all routinely monitored drugs, the aminoglycosides have been studied most extensively. PK data for gentamicin, tobramycin, netilmicin, and amikacin are available across (arbitrary) pediatric age categories: preterm newborns, term newborn infants (0 to 27 days), infants and toddlers (28 days to 23 months), children (2 to 11 years), and adolescents (12 to 16 or 18 years) (33). These studies have demonstrated that in the premature neonate, drug clearance is reduced and volume of distribution increased as compared with older children and adults, and glomerular filtration (the predominant route of elimination) by the immature kidney is reduced (10,34). Volumes of distribution are larger than those in older pediatric patients because of larger body water fat content and higher body surface-to-weight ratios. An overview of age-related PK changes and PK parameter estimates for gentamicin and vancomycin as index drugs is summarized in Table 9.2. Drug clearance rapidly increases with age as the kidney develops and the total body water decreases. For renally cleared drugs, after the first postnatal day, the creatinine concentration in plasma or calculated creatinine clearance can be a good a priori indicator of individual drug elimination (35). Individual differences in renal drug clearance can therefore be predicted before or during dosing and used to individualize dosing (both dose and dosing frequency). In addition, however, clearance of renally cleared drugs such as gentamicin can be used to predict renal function more accurately than creatinine clearance calculations used in adults (36). This is especially useful in the newborn, where maternal creatinine influences neonatal creatinine measurements (see case presentation in later discussion). As opposed to renally cleared drugs, we do not have good indicators for drugs that are predominantly metabolized. Drugs that are metabolized often show large, unpredictable interindividual and sometimes intraindividual differences in PK behavior. This interpatient as well as intrapatient variability may be further increased if the drug is taken orally, because of differences in absorption, transport, as well as intestinal metabolism. TDM can detect such interindividual as well as intraindividual variations. However, a single measurement will only describe the net results of all the different underlying processes (e.g., bioavailability, absorption, distribution, metabolism, and excretion) involved. For instance, a concentration that is lower than expected based on data for that patient population can be the result of poor adherence absorption problems, increased metabolism and excretion, or any combination of these.
Dosage Adjustments Based on Therapeutic Drug Monitoring Values
The decision to alter a generally accepted dosing regimen either before or during ongoing therapy is frequently based on an empirical trial-and-error decision-making process where different pieces of clinical information are considered. Patients in whom a rapid onset of effect is required or patients who exhibit lower or higher effects than expected after initiation or alteration of therapy can clearly benefit from proper TDM. In the nonresponding patient, concentration measurements will help the clinician decide whether nonadherence is present, whether a medication error is possible, whether a drug–drug or drug–diet interaction has occurred, or whether individual differences in PK or PD require a different dose or frequency of dosing or whether alternate therapy is indicated. This is true even for drugs for which a well-described “therapeutic range” is unknown.
Appropriate timing of sample collection is crucial for the appropriate interpretation of drug concentrations. Within a dosing interval, the predose or trough concentration is usually the sampling time after steady state is achieved, but efficacy is questioned. In the case of adverse events or (suspected) toxicity, sampling is preferably done at the time maximal side effects are experienced. Other sampling strategies may be required for drugs (such as
anticancer and antirejection drugs) where a more accurate measure of drug exposure such as an estimate of the area under the concentration–time curve (AUC) during a dosing interval is needed. Lack of all necessary information, such as the actual time of drug intake, how long after dosing was started, whether a loading dose was used, timing of concomitant medications, and time of sampling, makes it more difficult, or sometimes impossible, to interpret results. TDM laboratories and services can play an important role in improving patient outcomes and the efficient use of TDM by providing up-to-date guidelines and teaching physicians and other health care providers about what information is necessary to properly interpret any result. This information must either be accurately provided with laboratory requests or obtained by TDM service personnel. Unless the ordering professional is thoroughly familiar with PK and analytical principles, all drug concentrations should include an individualized PK interpretation (37,38,39,40,41). For several drug classes, the use of population models and the application of Bayesian optimization algorithms have been shown to be a clinically useful and cost-effective way to provide such interpretations (22,29). These algorithms are quite different from dosing nomograms, which are used to predict “average” or initial doses in various populations.
anticancer and antirejection drugs) where a more accurate measure of drug exposure such as an estimate of the area under the concentration–time curve (AUC) during a dosing interval is needed. Lack of all necessary information, such as the actual time of drug intake, how long after dosing was started, whether a loading dose was used, timing of concomitant medications, and time of sampling, makes it more difficult, or sometimes impossible, to interpret results. TDM laboratories and services can play an important role in improving patient outcomes and the efficient use of TDM by providing up-to-date guidelines and teaching physicians and other health care providers about what information is necessary to properly interpret any result. This information must either be accurately provided with laboratory requests or obtained by TDM service personnel. Unless the ordering professional is thoroughly familiar with PK and analytical principles, all drug concentrations should include an individualized PK interpretation (37,38,39,40,41). For several drug classes, the use of population models and the application of Bayesian optimization algorithms have been shown to be a clinically useful and cost-effective way to provide such interpretations (22,29). These algorithms are quite different from dosing nomograms, which are used to predict “average” or initial doses in various populations.
Bayesian Forecasting
Bayesian analysis is a particularly useful tool for information-sparse environments such as the neonatal intensive care unit. The method of Bayesian forecasting is derived from Bayes theorem, and is based on the concept that prior PK knowledge of a drug, in the form of a population model, can be combined with individual patient data, such as drug concentrations (24,42,43) (Table 9.3). The idea is to make an individualized model of the behavior of the drug in a particular patient to see how the drug will be or has been handled and to obtain the necessary information to make rational dose adjustments so as to best achieve the selected target goal(s).
Figure 9.2 shows a diagram of the goal-oriented, model-based optimization process. Drug dosage optimization requires (a) population PK parameters (PK model), defined as mean values, standard deviations, covariates, and information on the statistical distribution necessary to select the initial dosing regimen for that particular patient based on chosen goals; (b) measurement of a performance index related to the therapeutic goal, generally one or more plasma concentrations or effects as feedback information to update the system; and (c) availability of reliable software for an adaptive control strategy (maximum a posteriori probability [MAP] Bayesian fitting) and calculation of the subsequent optimal dosage regimen. An example of the use of a population model with Bayesian feedback is described by the following case report:
Vignette: Model-based individualization of gentamicin therapy in a newborn. A term baby girl (2.9 kg) with pulmonary atresia, a serum creatinine of 1.0 mg per dL 1 day after birth, and a suspected gram-negative infection was started on gentamicin (load 4 mg per kg and a maintenance dose of 2.5 mg per kg twice daily). The initial gentamicin concentration was reported as 2.7 mg per L. Based on the initial measurement, patient demographics, and the clinical information, a population PK model predicted that the initial and subsequent dosing changes were inappropriate. A regimen of 9 mg every 36 hours would have been appropriate.
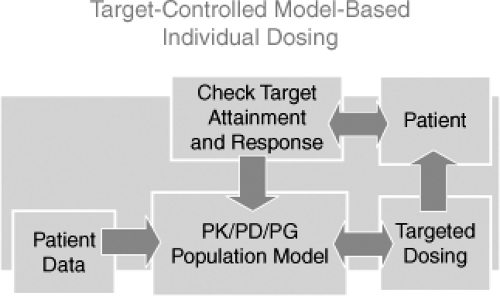 Figure 9.2. Flow diagram of the goal-oriented model-based strategy. A computer program is used with a patient-specific population model describing absorption, distribution, and elimination of the drug in relation to patient-specific parameters. Patient data and desired target concentrations are entered into the system. Next, a model-based loading dose and maintenance regimen required to optimally achieve the target concentrations is determined. This regimen is administered to the patient, and subsequent concentration measurement(s) are used as feedback to update the initial model and design a new dosing regimen if necessary. PD, pharmacodynamic; PG, pharmacogenetic; PK, pharmacokinetic. |
This patient was transferred to another major university hospital, where the levels were repeated (4.3 mg per L, 24 hours after the last dose, and 2.3 mg per L, 11.5 hours later). An off-the-cuff interpretation by a pharmacist without the use of any PK tools resulted in a dosing regimen recommendation of 9 mg every 24 hours. This dosing regimen resulted in a sustained high concentration over several days (Fig. 9.3) despite or because follow-up concentration measurements were done without appropriate PK interpretation. The child eventually developed bilateral hearing loss, which resulted in a malpractice suit against the physicians, the pharmacist, and the hospital (authors’ personal, court protected confidential information).
Table 9.3 Flow Scheme for Bayesian Goal-Oriented Model-Based Dosing (24) | ||||||||||||
|---|---|---|---|---|---|---|---|---|---|---|---|---|
|
In this example, simulation of the initial gentamicin serum concentration based on published population PK
data would have revealed that this patient had a much lower than normal clearance. This possibility was suggested by the elevated creatinine level for age (1.0 mg per dL). However, on the first day of life, neonatal creatinine levels, unlike gentamicin clearance, are influenced largely by maternal creatinine. The initial gentamicin level, if appropriately modeled, would have provided clear evidence of decreased renal function regardless of the reliability of the creatinine. Furthermore, the first level was at a random time after dosing and not a trough level. Nontrough concentrations can be misinterpreted without appropriate calculation, as occurred in this child. A model-based profile and subsequent Bayesian individualization process would have prevented this newborn from being exposed to prolonged, higher than necessary, and potentially toxic concentrations (44).
data would have revealed that this patient had a much lower than normal clearance. This possibility was suggested by the elevated creatinine level for age (1.0 mg per dL). However, on the first day of life, neonatal creatinine levels, unlike gentamicin clearance, are influenced largely by maternal creatinine. The initial gentamicin level, if appropriately modeled, would have provided clear evidence of decreased renal function regardless of the reliability of the creatinine. Furthermore, the first level was at a random time after dosing and not a trough level. Nontrough concentrations can be misinterpreted without appropriate calculation, as occurred in this child. A model-based profile and subsequent Bayesian individualization process would have prevented this newborn from being exposed to prolonged, higher than necessary, and potentially toxic concentrations (44).
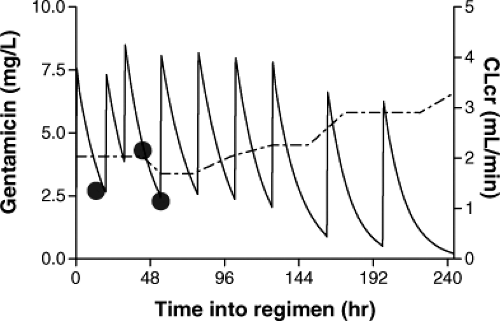 Figure 9.3. Population model-based mean concentration–time profile of gentamicin in a term newborn with renal complication (serum creatinine 1.0 mg/dL and initial creatinine clearance of approximately 2.0 mL/min) given a dose of 2.5 mg/kg twice daily. The large dots indicate measured gentamicin concentrations. The solid line represents the concentration–time profile predicted by the pharmacokinetic model and the dotted line represents the predicted creatinine clearance (CLcr) (see text for further details). |
Population model-based dosing recommendations in a group of less complicated patients were generated in the study of van Lent-Evers et al. (29). In this study, the model-based regimen was administered and a set of two drug levels was drawn at t = 1 hour and 8 to 12 hours after the first dose. The concentration measurements were used as feedback, and if necessary the dosing regimen was adjusted according to the patients’ clinical condition and selected target concentrations. This approach proved less costly and more effective than traditional, often nomogram-based dosing. It reduced mortality and hospital stay in patients who were admitted with a suspected or proven gram-negative infection. This method is greatly superior to the common “start gentamicin and get a level after 3 to 5 doses” approach used in many neonatal units. This inappropriate monitoring is based on a misunderstanding of the difference between the number of half-lives and the number of “doses” necessary to reach steady state. This approach misses inappropriate doses (such as 10-fold errors) or inadequate clearance for days after they could have been detected with proper TDM done at appropriate time after the initial dose. The authors have also been involved in litigation involving patient harm that was caused by this inappropriate but surprisingly commonly used aminoglycoside monitoring method. Another example of common poorly done TDM involves the misinterpretation of aminoglycoside therapeutic ranges in children given once or less frequent doses. Trough (predose) concentrations in such children should be undetectable using most assays and not “less than 2 mg per L.” This “trough” concentration is what is expected with every 8-hour dosing. A child who has 1 to 2 mg per L 24 or more hours after a single dose has been supratherapeutic for many hours and has either received a massive overdose or has decreased renal function.
Bayesian methods can be more cost-effective than other techniques because they require fewer drug measurements for individual PK parameter estimation. They can also handle sparse and random samples (45). TDM, when applied appropriately, can also be used to detect and quantify clinically relevant drug–drug interactions (46,47) as well as medication errors.
Stay updated, free articles. Join our Telegram channel

Full access? Get Clinical Tree


