Point-of-Care Sonography in the Second and Third Trimesters
Point-of-Care Sonography in the Second and Third Trimesters
Assessment of symptoms and complaints by pregant women in the second and third trimesters can be expedited and decision making improved by utilizing sonography in the evaluation of both maternal and fetal conditions. Some of the common maternal symptoms include bleeding and pain, both of which warrant the use of point-of-care (POC) ultrasound at the bedside because timely results are needed.
Another situation in which a POC ultrasound exam is indicated is when a woman who has not had prenatal care presents with signs and symptoms of active labor. Under those circumstances, it may be imperative to determine fetal gestational age and weight, should the delivery be imminent and/or transfer to another facility indicated. Knowing approximate sonographic fetal gestational age may also assist in determining the need for tocolytics, steroid administration, and neonatal interventions and thus may impact long-term outcome.
In all clinical situations warranting a POC sonogram that do not result in birth, a standard sonogram should be performed as follow-up. This is particularly important if one has never been performed during the pregnancy.
STANDARD SECOND- AND THIRD-TRIMESTER EXAMINATION
The standard ultrasound performed in the second and third trimesters entails a complete survey, which includes taking fetal measurements, evaluating specific fetal anatomy, identifying the presence or absence of fetal cardiac activity, identifying the fetal number (i.e., twins), determining fetal presentation, identifying placental localization, and assessing the amniotic fluid. Additionally, when technically feasible, the maternal cervix and adnexa should be examined based on clinical indicators (Table 12-1).1, 2 and 3 Some measurements are used more frequently than others. This chapter focuses on the methods currently used in practice in estimating fetal age and weight.
FETAL BIOMETRY
Fetal biometry is the sonographic method of obtaining fetal measurements and comparing these findings to already-established fetal growth tables and growth curves. The individual anatomic measurement or combinations of anatomic measurements will correspond to ranges of fetal weights and gestational age. The most common measurements used in the second and third trimester of pregnancy include (1) fetal head biparietal diameter (BPD), (2) fetal head circumference (HC), (3) fetal femur length (FL), and (4) fetal abdominal circumference (AC).4, 5, 6 and 7
The gestational age of a pregnancy should never be assigned a new due date based on a second- or third-trimester sonogram if a first trimester dating ultrasound has already been performed.1 Recalculating the gestational age of a pregnancy at this late point increases the risk of missing a fetal growth disorder. For example, if the third-trimester fetal growth scan indicates a gestational age of 3 weeks less than the gestational age determined by sonogram in the first trimester, that discrepancy in “dating” may actually indicate a growth-restricted fetus.
TABLE 12-1 INDICATIONS FOR SECOND- AND THIRD-TRIMESTER STANDARD ULTRASOUND EXAMINATION
Estimation of Gestational Age and Weight
Evaluation of Fetal Growth
Evaluation of Fetal Well Being
Assessment of Amniotic Fluid
Vaginal Bleeding
Cervical Insufficiency
Adjunct to Cerclage Placement
Determination of Presenting Part
Fetal Number
Adjunct to Amniocentesis or Other Procedure
Size/Dates Discrepancy
Pelvic Mass
Suspected Hydatidiform Mole
Suspected Ectopic Pregnancy
Rule out Fetal Demise
Suspected Uterine Anomaly
Suspected Placental Abruption
Adjunct to External Cephalic Version
Premature Rupture of Membranes (PROM)
Abnormal Biochemical Markers
Follow-up Evaluation of Fetal Anomaly
Follow-up of Placental Location
History of Prior Infant with Anomaly
Assess for Indicators for Risk of Aneuploidy
Screening for Fetal Anomalies Abdominal or Pelvic Pain
Adapted from AIUM.1
Fetal Biparietal Diameter
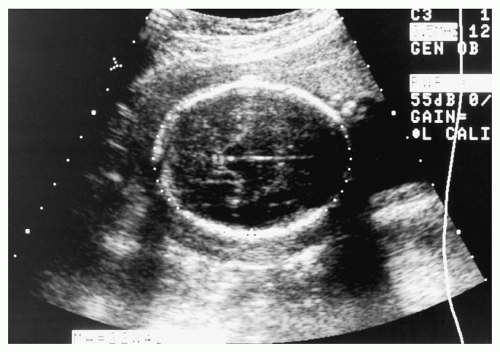
The BPD measurement is one of the four most common measurements used to determine fetal age. The BPD can be accurately measured after week 12 of the pregnancy. The proper sonographic image is obtained in a transverse view of the head. The correct level is identified when the thalami and the cavum septum pellucidi are visualized and the cerebellar hemispheres are not visible.1
The measurement is obtained by placing a caliper on the proximal or outside edge of the skull nearest the transducer and the second caliper on the inside of the distal skull. This is referred to as the outer-to-inner skull measurement or leading edge-to-leading edge (Figure 12-1). The inside distal edge of the skull is used because the farther the sound waves travel, the greater the likelihood of creating artifact or a thicker appearing skull. If the outer edge of the distal skull is used, the BPD (and thus the gestational age) will erroneously be determined to be larger with an incorrectly advanced gestational age and higher weight.
The BPD measurement is then compared to the BPD table, and the menstrual age in weeks will be determined. Modern ultrasound equipment contains software tables that automatically calculate fetal age and weight. These measurements and estimations of gestational age are based on the fetal head being more oval in shape. Other less common head shapes include a rounder appearance, known as brachycephalic, or an elongated shape, known as dolichocephalic, which may cause the BPD measurement to be misleading.1
Head Circumference
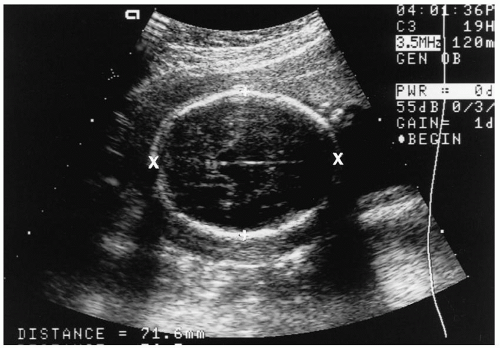
Due to the variations in head shape, measurement of the HC is utilized. The HC is considered more precise in determining fetal age because the measurement is not shape dependent.1 As with the BPD, the HC can be measured after 12 weeks. The HC is obtained in the same view as the BPD, and an ellipse is used to encircle the head (Figures 12-1B and 12-2).
FIGURE 12-1. (A) Biparietal diameter (BPD). T, on each side of the thalami; c, over the cavum septi pellucidi; f, at the arrow is the falx cerebri, an echogenic line from anterior to posterior in the cranium. The first caliper is placed on the proximal or outside edge of the skull nearest the transducer and the second caliper on the inside of the distal skull. (B) Biparietal diameter on vertical axis. Note caliper placement. Ellipse indicates HC.
FIGURE 12-2. Head circumference (ellipse encircling skull at level of biparietal diameter [BPD]).
FIGURE 12-3. Cephalic index. Biparietal diameter (BPD; measured from + to +) multiplied by occipital frontal diameter (from × to ×).
The calipers can also be placed on the lateral skull. A method used less frequently is the cephalic index (CI). The CI equals the BPD divided by the occipitalfrontal diameter multiplied by 100 (Figure 12-3). The CI is an indicator of head shape that is used in the sonographic literature.
When measuring the BPD and HC, the cerebellum should not be visible. If it is, the scanning plane is too low (Figure 12-4).
Fetal Femur Length
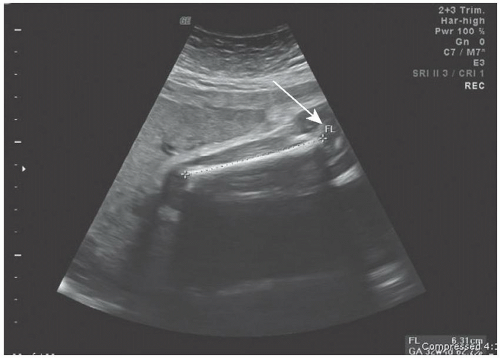
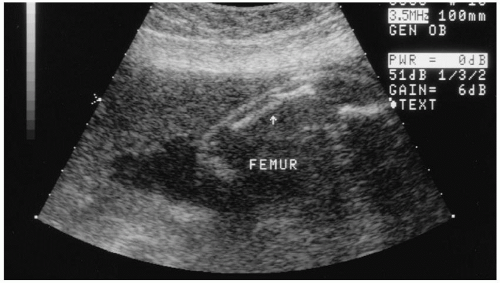
The FL measurement is used in assessing fetal growth. This measurement is optimal at 15 weeks and remains accurate until approximately 32 weeks’. The femur is measured in a longitudinal position. The proper view is obtained when the longest measurement of femur is visualized. The diaphysis of the femur is echogenic and can display posterior shadowing depending on gestational age.
FIGURE 12-4. Measurement of the cerebellum.
FIGURE 12-5. Hyperechoic femur at arrow, with correct placement of cursors (at each end) for measuring femur length. The epiphyses (arrow) are excluded from the measurement.
The measurement is done by placing a caliper at each end of the diaphysis (excluding the epiphysis). The epiphysis is hypoechoic, becoming hyperechoic after 32 weeks’ gestation (Figure 12-5). For the best resolution, the femur closest to the transducer should be measured. After 32 weeks’ or if the posterior (deep) femur is being measured, the femur can appear bowed.2 Abnormal bowing may also be seen in fetuses with skeletal abnormalities such as hypomineralization or osteogenesis imperfecta, which can lead to bone fractures (Figure 12-6).
The femur length measurement is calculated by the ultrasound system. To evaluate proper growth, various ratios are used in determining intrauterine growth restriction (IUGR). A common ratio used to estimate proportional growth is femur length to abdominal circumference.
FIGURE 12-6. Femur with hypomineralization. Note the break in the femur at the arrow.
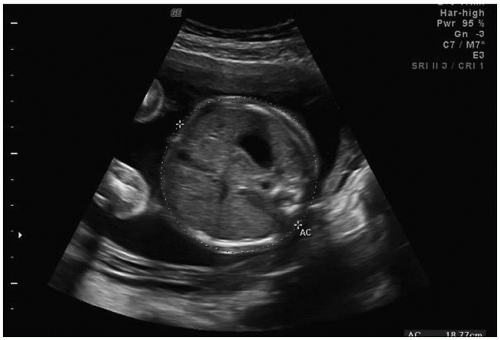
FIGURE 12-7. Abdominal circumference.
Fetal Abdominal Circumference
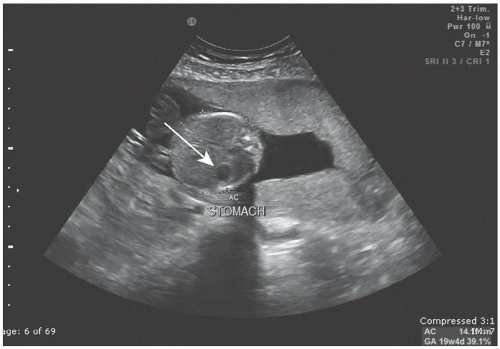
The AC is used to evaluate fetal growth and fetal age. This measurement is made by obtaining a transverse image of the fetal abdomen at the level of the stomach and the umbilical vein joining the portal vein, which forms a “J” shape (Figures 12-7 and 12-8).1
To obtain this level, image the fetus in a longitudinal axis, turn the transducer into a transverse position at the level of the stomach, and move the transducer superior and inferior until the correct fetal parts are seen. If the fetal kidneys are visualized, then the level is too low in the fetal abdomen. Then place one caliper on the outside of the anterior skin edge of the abdomen and the other caliper on the outside skin edge of the posterior spine. The ellipse is then opened and expanded to cover the outer portion of the abdomen. The skin line needs to be included. The resulting value is calculated by the ultrasound system.
FIGURE 12-8. Transverse image of level for abdominal circumference. AC, abdominal circumference. Note the anechoic stomach bubble.
ESTIMATED FETAL WEIGHT
The estimated fetal weight (EFW) is achieved by utilizing combinations of fetal anatomic measurements, such as by using the AC and BPD measurements. These measurements are then plotted on a growth chart displaying EFW. A second method utilizes the AC and the FL. These growth charts were created in the 1970s and 1980s, but still hold true at present.8 However, in most cases, instead of the clinician needing to plot the measurements on a graph, the software in the ultrasound machine performs the calculations and then displays the result on the report page along with the estimated gestational age and estimated date of delivery.
Newer formulas that use three measurements such as HC, AC, and FL to calculate EFW are available in some software packages that come with the newer ultrasound machines. In some cases, they have proved to be more accurate. However, the Hadlock is generally recognized as most accurate over the full range of fetal weights from 500 to 5,000 g.8
If a fetus is being evaluated for a growth concern, the comparative scans should be performed every 2 to 4 weeks1 and plotted on growth charts (Appendix D). A growth scan performed sooner can yield erroneous results. Fetal weight predictions may have an error rate as high as +/-15%. A study by Ben-Haroush et al.9 showed that EFW by sonogram had a high correlation with actual birth weight, except in preterm premature rupture of the membranes (PPROM) and larger for gestational age (LGA) fetuses. In the PPROM cases, an underestimated EFW occurred, and in the LGA cases, an overestimation occurred. In a second study, the authors stated that “the true value of ultrasonography in the management of fetal macrosomia may be its ability to rule out the diagnosis.”10
Gender is an additional consideration for estimating gestational age as well as estimating fetal weight. Gender-specific growth charts (Appendix D) may be used to optimize the prediction of EFW.11,12 This was further substantiated by Melmed et al. in 2013,13 whose study showed that female fetuses grow considerably slower than male fetuses from an early gestation onward. In this study, the female fetus appeared not to be merely a smaller version of the male fetus, but rather they observed a sex-specific growth pattern for each of the individual fetal biometric indices. These findings provide further support for the use of sex-specific sonographic models for fetal weight estimation, as well as the use of sex-specific reference growth charts.
The accuracy of sonographic formulas (Hadlock and Shepard) for estimating weight in singleton gestations was recently studied in twin pregnancies. All widely used EFW formulas performed equally well in estimating birth weight in twin gestations. However, most women delivered between 33 and 36 weeks’ gestation, thus limiting the studies to gestations of under 36 weeks.14
THE FETAL ANATOMIC SURVEY
A standard sonogram performed after 18 weeks’ gestation includes minimal elements of a fetal anatomic screen (Table 12-2).
Deviations from Normal Fetal Anatomy
Evaluation of fetal anatomy is not a part of a POC sonogram. However, to obtain anatomic landmarks for estimating fetal age and weight, knowing normal fetal anatomy is important. One method for learning normal anatomy is to compare it with abnormal anatomic features. A few significant anatomic abnoramlities will be described and images presented in the following section to compare normal and abnormal anatomy.
Fetal Head
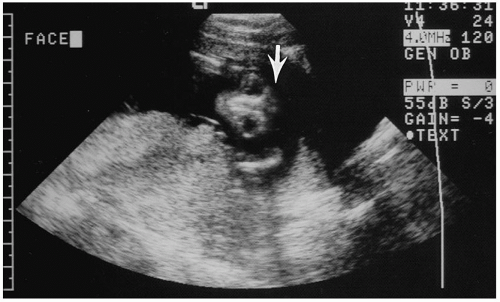
The fetal cranium normally appears as a hyperechoic oval. Anencephaly is identified by sonography when the fetal cranium cannot be visualized. The common appearance is noted by the absence of cranium from the forehead up, along with bulging orbits (Figure 12-9), which are hypoechoic on sonography.
TABLE 12-2 MINIMAL ELEMENTS OF A STANDARD EXAMINATION OF FETAL ANATOMY
Head, Face, Neck
Cerebellum
Choroid Plexus
Cisterna Magna
Lateral Cerebral Ventricles
Midline Falx
Cavum Septi Pellucidi
Upper Lip
Spine
Cervical, Thoracic, Lumbar, and Sacral Spine
Chest
Four-chamber view
Left ventricular outflow tract
Right ventricular outflow tract
Extremities
Presence/absence of legs and arms
Abdomen
Stomach (presence, size, and situs)
Kidneys
Urinary bladder
Umbilical cord insertion side into fetal abdomen
Umbilical cord vessel number
Sex
Multiple Gestations and when Medically Indicated
Adapted from AIUM.1
FIGURE 12-9. Anencephalic. Note that the cranium is not over the eyes (at arrows). Eyes appear hypoechoic.
Lateral Ventricles
At the superior level of the head are the lateral ventricles. The choroid plexus are located within the ventricles and produce cerebral spinal fluid (CSF). The ventricles carry CSF through the brain. The lateral ventricles are divided into various portions: the frontal, the body, and the occipital. They are located anteriorly, midportion, and posteriorly, respectively.
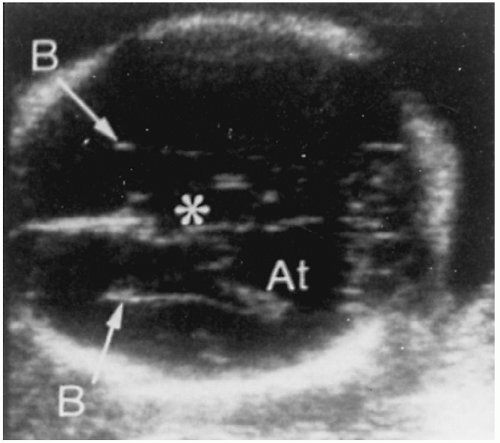
It is recommended that the lateral ventricular measurement be taken at the level of the atria to evaluate for hydrocephalus and other anomalies such as Dandy-Walker malformation (Figure 12-10). This measurement can be routinely obtained after 12 weeks’ gestation. The normal measurement should not be greater than 10 mm.
FIGURE 12-10. Axial scan through the lateral ventricles showing typical enlargement of the atria (At) and widely separated bodies (B) with the upward displacement of the third ventricle (*).
The choroid plexus is hyperechoic, homogeneous tissue and should be evaluated for simple cysts. Single cysts or multiple cysts creating a mottled appearance to the choroid plexus can be seen before 22 weeks but should resolve after that gestation.
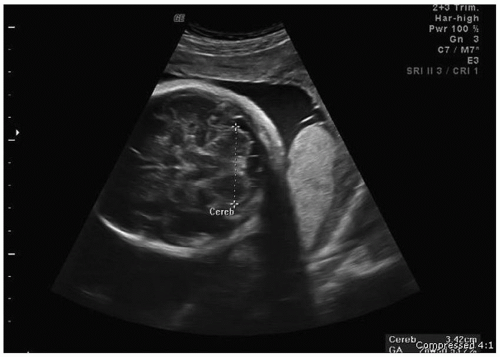
Cerebellum
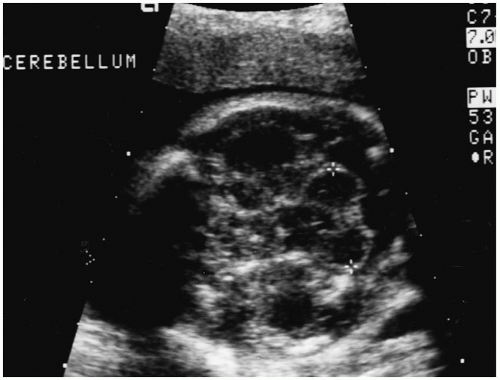
The cerebellum is located in the posterior-inferior portion of the brain. The image is obtained by placing the transducer in a coronal position at the frontal bone and angling posterior to the base of the skull (Figure 12-11). The transducer may also be angled inferior to the BPD/HC measurement level. Measuring the cerebellum is helpful in determining gestational age.
FIGURE 12-11. Cerebellum, between “+” signs.
The cerebellum is responsible for the coordination of muscular movements. The shape of the cerebellum is also important. The normal cerebellum is dumbbell-shaped, similar to Figure 12-8. If, however, the cerebellum is “banana-shaped,” it can be indicative of a neural tube defect. This shape has been designated the “banana sign.” This abnormality, along with dilated lateral ventricles, is known as a Chiari malformation (previously named Arnold Chiari) and is associated with spinal defects.
Cerebellar measurements can also be used in cases of suspected symmetric growth restriction to differentiate IUGR from a small for gestational age (SGA) fetus. The cerebellum is often the last to be compromised in the setting of IUGR.
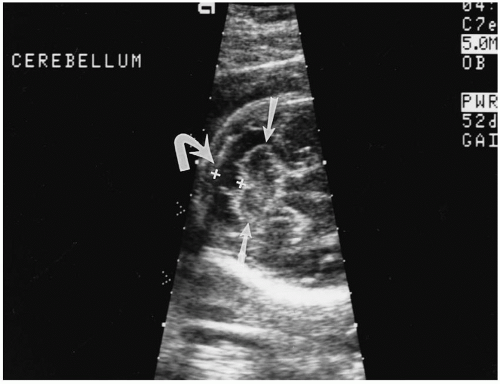
Cisterna Magna
Posterior to the cerebellum is the cisternal magna, normally measuring 2 to 10 mm (Figure 12-12). This measurement may also be helpful in evaluating for Dandy-Walker malformation. Also, the cisterna magna will be obliterated in the setting of Chiari malformations and many neural tube defects.
Spine
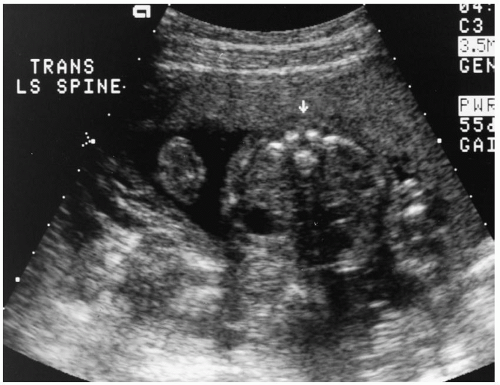
The spine is divided into five segments: cervical, thoracic, lumbar, sacral, and coccyx. The spine can be evaluated in longitudinal, transverse, and/or coronal views. The spine is typically ossified after 15 weeks and, depending on fetal position, can be visualized at this age. To evaluate for spinal closure, a careful scan of each vertebrae, as well as the skin line, is imaged in the transverse position. This position permits visualization of the three ossification centers (Figure 12-13). Any splaying of the ossification centers will indicate an abnormality. The longitudinal plane is helpful for imaging and evaluating a complete skin line, as well as the normal spinal curvatures (Figures 12-14, 12-15, and 12-16).
FIGURE 12-12. Cisterna magna (curved arrow) with the measurement between the “+” signs. The cerebellum is between the straight arrows.
FIGURE 12-13. Transverse view of the spine. The arrow indicates the ossification centers, which in this image are normal.
Abnormalities such as cystic hygroma and encephalocele can be identified at the level of the cervical spine. The most common location for spina bifida and myelomeningocele are the lumbar and sacral spine, although they can occur at any level. Sacrococcygeal teratomas occur at the sacrum and coccyx. Due to these abnormalities, skin closure over the vertebrae is important to image and observe (Figure 12-17).
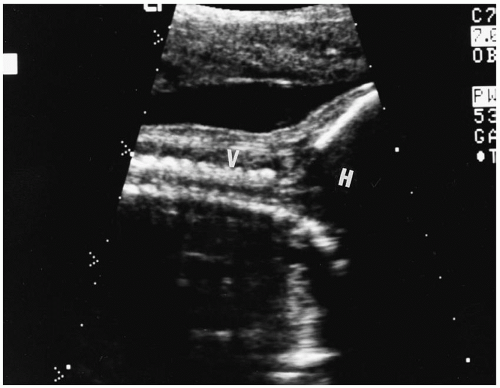
FIGURE 12-14. Longitudinal view of cervical spine. H, head;V, vertebrae.
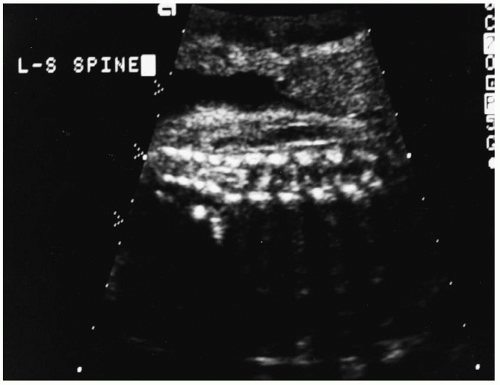
FIGURE 12-15. Thoracic spine in longitudinal view.
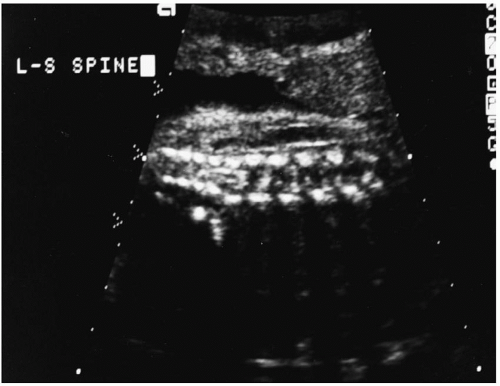
FIGURE 12-16. Lumbar-sacral spine in longitudinal view.
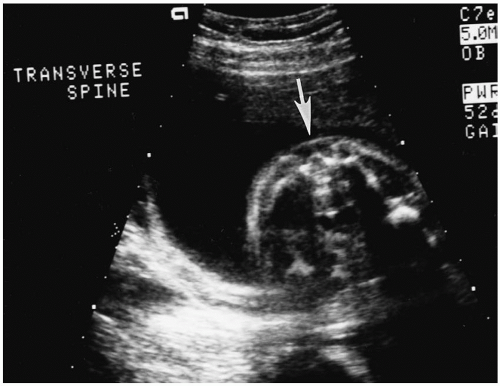
FIGURE 12-17. Transverse view of the lumbar-sacral spine. Note the intact skin closure (arrow).
FIGURE 12-18. Axial view of four-chamber fetal heart.
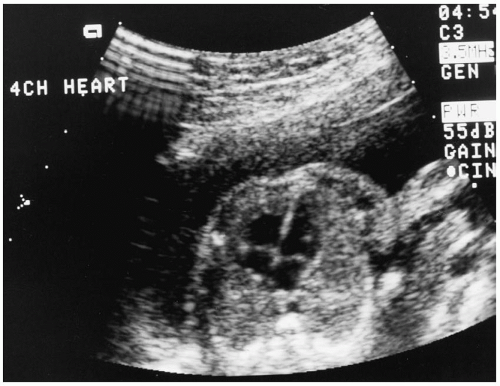
Chest/Heart
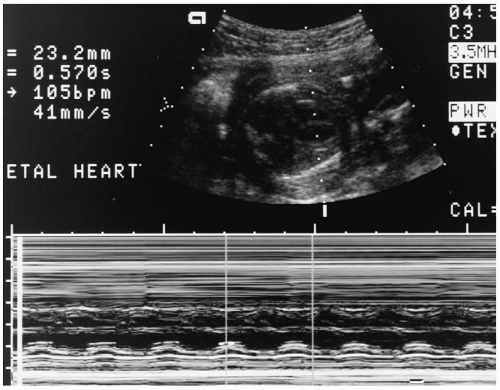
The heart is imaged in an axial approach allowing visualization of the four chambers (Figure 12-18). The heart should comprise one-third of the fetal chest. Fetal heart motion is confirmed using M-mode sonography, and this view then archived (Figure 12-19).
Abdomen
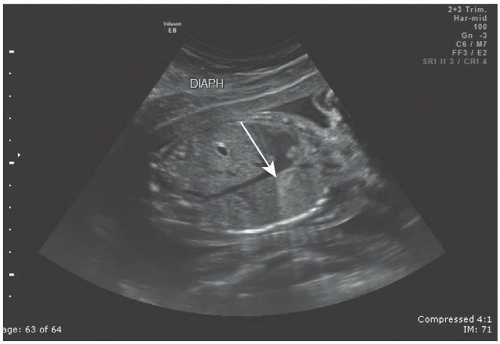
The structures in the fetal abdomen that need to be identified during the sonographic evaluation are the stomach, three-vessel umbilical cord, bowel, liver, and gallbladder. One important landmark is the fetal diaphragm (Figure 12-20), which divides the contents of the abdomen from the chest. The diaphragm is also a useful landmark in the observation of fetal breathing movements during a biophysical profile (see Chapter 13). Since the stomach is fluid-filled, sonographically it will appear anechoic (Figure 12-8). It remains this way until term, when the fetus may swallow amniotic fluid containing meconium and/or vernix, which will then appear as hyperechoic debris within the stomach. A left-sided stomach needs to be confirmed at each sonogram.
FIGURE 12-19. M-mode tracing of fetal heart verifying cardiac motion.
FIGURE 12-20. Longitudinal view of the fetal chest and abdomen. Note the diaphragm (arrow) separating abdominal contents from chest contents.
The three-vessel umbilical cord is identified in the transverse view. It contains one larger vessel that is the umbilical vein and two smaller vessels that are the umbilical arteries (Figure 12-21). A two-vessel cord would be considered an abnormality and requires further investigation of all other systems.
Only gold members can continue reading. Log In or Register to continue