Fig. 4.1
The graphic demonstrates the increased carcinogenic risk related to radiation exposure for the pediatric population compared to the adult population. Reprinted from Peck DJ, Samei E. How to Understand and Communicate Radiation Risk. Image Wisely. Available at: http://www.imagewisely.org/Imaging-Professionals/Medical-Physicists/Articles/How-to-Understand-and-Communicate-Radiation-Risk. Reprinted with permission of the American College of Radiology, Reston, Virginia. No other representation of this material is authorized without express, written permission of the American College of Radiology
Radiation Safety
Biological radiation effects can be divided into two categories: stochastic and deterministic effects. Deterministic effects are set by exposure threshold, and doses above the cutoff cause damage (e.g., cataract occurs if the crystalline lenses are exposed above 5 Gy (gray is the radiation unit for absorbed dose of radiation)) [3]. Stochastic effects are the result of cumulative doses of radiation and are related to genetic abnormalities and carcinogenic effects. There are no safe levels of radiation exposure related to stochastic effects, and the cancer risk increases as cumulative doses increase [3].
Recently, Pearce et al. (2012) demonstrated the association of low doses of radiation administrated on CT with occurrence of brain tumors and leukemia in a pediatric population (Fig. 4.2). This was the first time that this association was proven, although previous publications based on information gathered from the survivors following atomic explosions had raised the concern about the use of low dose radiation in medical imaging modalities [4]. Therefore, extra care should be taken when requesting a CT scan in the pediatric population, weighing the risks and benefits for each case.
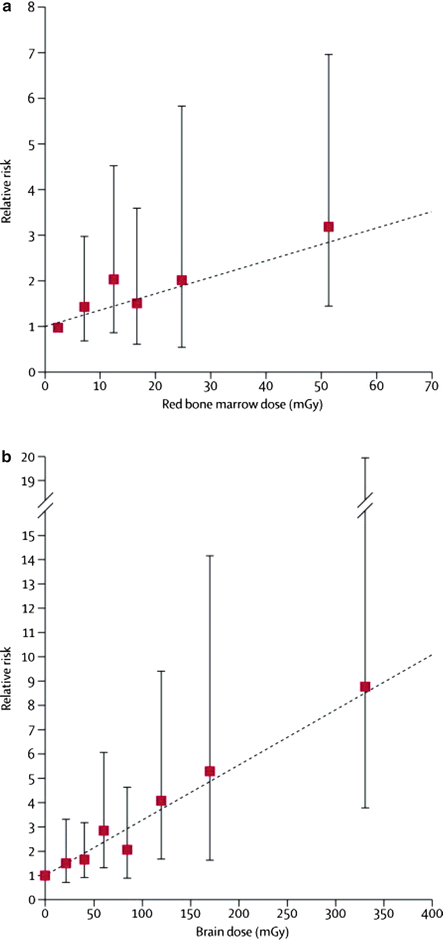
Fig. 4.2
Relative risk of leukemia and brain tumors in relation to estimated radiation doses to the red bone marrow and brain from CT scans: (a) Leukemia and (b) brain tumors. Dotted line is the fitted linear dose–response model (excess relative risk per mGy). Bars show 95 % CIs. Reprinted Pearce MS, Salotti JA, Little MP, McHugh K, Lee C, Kim KP, et al. Radiation exposure from CT scans in childhood and subsequent risk of leukaemia and brain tumours: a retrospective cohort study. Lancet. 2012 Aug 4;380(9840):499-505. With permission from Elsevier
There are three principles of radiation safety that should be kept in mind when requesting and performing a CT examination: justification, optimization, and dose limitation (Table 4.1) [5].
Table 4.1
Radiation safety principles
Justification | Any radiation exposure should be justified and judge. It only should be adopted if the benefit outweighs the harm it may cause |
Optimization | Radiation doses and risks should be kept as low as reasonably achievable (ALARA). Technical aspects should be respected to achieve minimal radiation exposure and maximize benefits |
Dose limitation | Exposure of individuals should not exceed specified dose limits above which the dose or risk would be deemed unacceptable. The limits are usually set by ICRPa |
The North American radiological societies have mounted campaigns in an effort to educate doctors and the general population regarding radiation effects and radiation safety. The most important radiation safety campaigns (Image Gently® for pediatric population (http://www.pedrad.org/associations/5364/ig/) and Image Wisely® for the adult population (http://www.imagewisely.org/)) have made optimization (“as low as reasonably achievable” (ALARA)) a very popular principle. However, justification is also very important, not only because it justifies the investigation, but also because it helps to decide which adjustments are necessary in the imaging technique in order to make the diagnosis.
There are several techniques that can be applied in CT imaging acquisition. For example, a patient who needs to have only the size of the cerebral ventricles assessed can have a study performed with low radiation exposure. In contrast, for brain parenchyma assessment, a scan with a regular radiation dose exposure is required to prevent artifacts related to low doses [6] (Fig. 4.3).
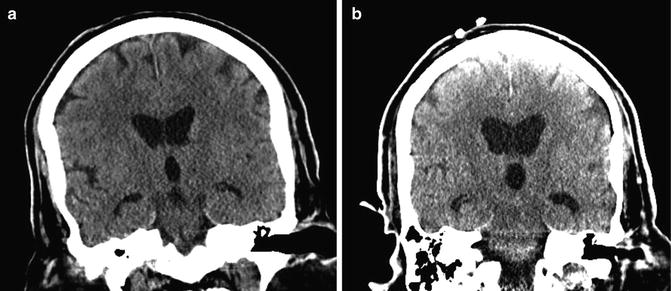
Fig. 4.3
(a) CT head regular dose is acquired showing detailed imaging of the brain parenchyma and ventricles. (b) Low-dose CT of the head does not have the same parenchymal imaging details but is enough to demonstrate presence of hydrocephalus
The clinical information provided in the request form also helps the radiologist to decide if the study requires contrast. For example, melanoma metastases are easier to depict after intravenous contrast injection. However, if the radiologist is not informed about a clinical suspicion of melanoma, intravenous contrast might not be used, thereby increasing the chance of missing lesions. The same problem applies for leptomeningeal disease in patients with history of malignancy as this can be difficult to visualize without the administration of intravenous contrast media as illustrated in Figs. 4.4 and 4.5.
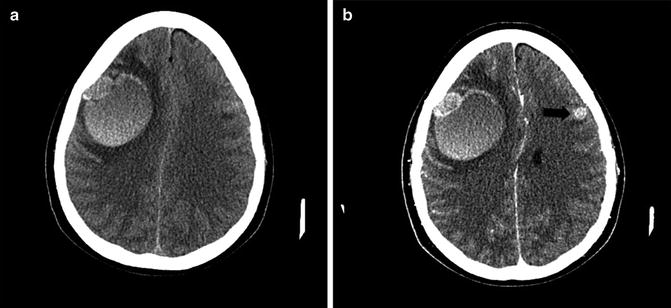
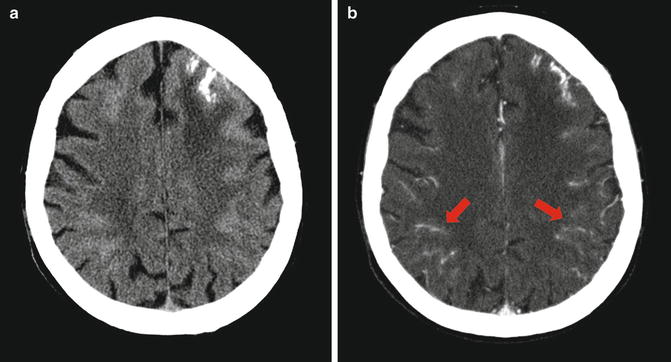
Fig. 4.4
(a) CT without contrast demonstrates a hyperdense hemorrhagic metastasis from melanoma on the right hemisphere. (b) Enhanced CT showing a second metastatic lesion on the left frontal lobe (black arrow). This was poorly visualized without contrast
Fig. 4.5
(a) CT without contrast shows multiple hyperdense sulci in the cerebral convexity bilaterally with focal calcification on the left frontal lobe. (b) Enhanced CT of the same patient showing extensive leptomeningeal disease (red arrows)
The contrast used in CT scans is an iodine-based media. The use of this contrast should be cautious since it is not innocuous and contraindications to its use must be taken into account (Table 4.2) [7]. In addition, if a pre- and post-contrast study is needed, the patient will need to be scanned twice, receiving two doses of radiation.
Table 4.2
Adverse effects from the administration of iodine-based contrast agents
Adrenal glands | Hypertension (in patients with pheochromocytoma after intra-arterial injection) |
|---|---|
Brain | Headache |
Confusion | |
Dizziness | |
Seizure | |
Rigors | |
Lost or diminished consciousness | |
Lost or diminished vision | |
Gastrointestinal tract | Nausea |
Vomiting | |
Diarrhea | |
Intestinal cramping | |
Heart | Hypotension |
Dysrhythmia (asystole, ventricular fibrillation/ventricular tachycardia) | |
Pulseless electrical activity (PEA) | |
Acute congestive heart failure | |
Kidney | Oliguria |
Hypertension | |
Contrast-induced nephropathy (CIN) | |
Pancreas | Swelling/pancreatitis |
Respiratory system | Laryngeal edema |
Bronchospasm | |
Pulmonary edema | |
Salivary glands | Swelling/parotitis |
Skin and soft tissues | Erythema |
Urticaria | |
Pruritus | |
Compartment syndrome (from extravasation) | |
Thyroid | Exacerbation of thyrotoxicosis |
Vascular system | Hemorrhage (due to direct vascular trauma from contrast injection or from the reduction in clotting ability) |
Thrombophlebitis |
In conclusion, every time a physician fills out a requisition with adequate clinical information, the radiologist is being helped to decide if the image modality chosen by the clinician is the most appropriate for the diagnosis and what is the best technical approach to perform it. The clinician must also flag any risk factors or contraindications for the use of contrast media. The chosen diagnostic test will have adequate sensitivity and specificity and patients will be saved from unnecessary radiation exposure if all these principles are followed.
Here are some questions that might help physicians to evaluate the appropriateness of a CT request:
Are there publications or protocols to support the choice of a CT study for the condition?
The American College of Radiology website (http://www.acr.org/Quality-Safety/Appropriateness-Criteria) has published a list of appropriateness criteria for different clinical scenarios. The use of this website may be helpful when questions about appropriateness are raised.
In the knowledge that the younger the patient, the greatest the risk for tumors related to radiation exposure, does the benefit of a CT diagnosis outweigh the risk of cancer?
Is there any contraindication to iodine contrast media if this is needed for the imaging study?
What is the history of previous radiation exposure? Is this patient pregnant or at risk of pregnancy?
Are there alternative tests available for the diagnosis?
Basic Principles of CT Interpretation
CT image formation is based on a gray scale of tissue X-ray attenuation. Tissues that can attenuate more X-rays appear whiter or hyperdense (e.g., bone) and tissues that allow the passage of X-rays appear blacker or hypodense (e.g., cerebrospinal fluid spaces). Fat tissue, for example, attenuates less X-rays than the normal brain tissue and therefore appears hypodense (Fig. 4.6) [8].
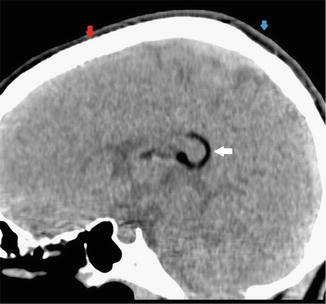
Fig. 4.6
Examples of different CT densities. A hypodense structure is seen in the posterior aspect of the corpus callosum (white arrow), in keeping with a lipoma. The red arrow is showing the parietal bone (hyperdense structure) and the blue arrow is pointing to the subcutaneous tissues of the scalp, which is also hypodense due to the presence of fat. Reprinted Senggen E, Laswed T, Meuwly JY, Maestre LA, Jaques B, Meuli R, et al. First and second branchial arch syndromes: multimodality approach. Pediatric radiology. 2011 May;41(5):549-61. With permission from Springer Science + Business Media
CT is a very good technique to assess the CNS vasculature. CT arteriograms and venograms have a high sensitivity and specificity in the diagnosis of vascular disease. Nevertheless, because of the increased radiation exposure, it is normally only used if the MR arteriogram/venogram was not diagnostic.
Interpretation of pediatric imaging has its own peculiarities as compared to adult imaging, as the different stages of development result in different appearances of the normal brain. The lack of myelin in the early stages of development and increased water content in the white matter is one example. This characteristic results in differences between the gray and white matter contrast that does not resemble what is seen in an older child, when the myelination process is complete (Fig. 4.7). Therefore, when looking at a pediatric study, it is very important to know the patient’s age before coming to any conclusions. The same principles apply for the interpretation of MRI images [9].
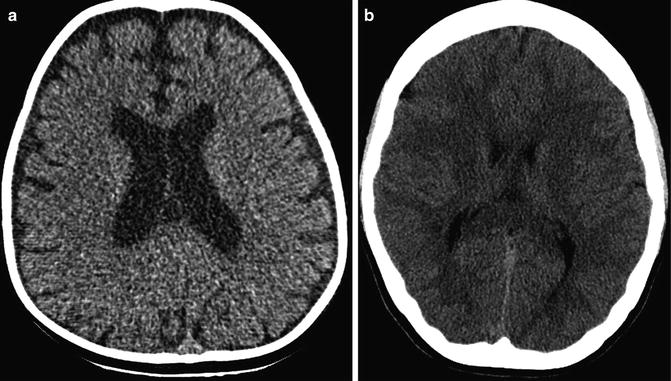
Fig. 4.7
(a) Axial CT image of an 11-month-old patient showing fairly homogeneous brain density with decreased gray white matter differentiation due to the small amount of myelin in the white matter. This is a normal finding in this age group due to the myelination process. (b) CT image of a fully myelinated brain of a 14-year-old showing the well-demarcated gray/white matter differentiation. The relative hypodensity of the white matter is due to the presence of myelin
The assessment of a CNS bleed also has some pitfalls. There are different stages of hemoglobin degradation (Table 4.3) [10, 11]. In acute stages a bleed will be hyperdense compared with the rest of the brain parenchyma. However, if the patient is anemic, the attenuation of the signal from an acute bleed can be similar to that of the brain parenchyma. Therefore, a small bleed can be easily missed. Another problem is the lack of myelin in young children, which produces a relative diffuse hypodensity of the parenchyma and makes the blood vessels (in particular the venous sinuses) appear more hyperdense than usual (Fig. 4.8). This should not be confused with acute thrombosis of the venous sinuses. A similar effect can be seen in patients with cyanotic conditions such as cardiac shunts or chronic lung disease, if they are polycythemic. However, in these cases the relative hyperdensity of the vessels is caused by an increased hematocrit and is not due to lack of myelin [11].
Table 4.3
Imaging characteristics of hemoglobin degradation in intraparenchymal hemorrhages
Phase | Time | Hemoglobin | Appearance | ||
|---|---|---|---|---|---|
CT | T1-weighted MRI | T2-weighted MRI | |||
Hyperacute | < 12 h | Oxyhemoglobin | Hyperdense | Isointense or hypointense | Hyperintense |
Acute | Hours to days | Deoxyhemoglobin | Hyperdense | Isointense or hypointense | Hypointense |
Early subacute | Few days | Methemoglobin | Isodense | Hyperintense | Hypointense |
Late subacute | 4–7 days to 1 month | Methemoglobin + cell lysis | Hypodense | Hyperintense | Hyperintense |
Chronic | Weeks to years | Ferritin and hemosiderin | Hypodense | Isointense or hypointense | Hypointense |
Fig. 4.8
Coronal CT image of an 11-month-old infant showing the relative hyperdensity of the superior sagittal sinus (red arrow) in the background of non-myelinated brain parenchyma. This should not be interpreted as venous sinus thrombosis
A CT scan can determine the degree of mass effect over the parenchyma when evaluating a space-occupying lesion. It can also demonstrate the presence of intralesional cysts, calcification, necrosis, blood, or fat. CT almost always defines the anatomical location of the lesion, except in some cases of infiltrative lesions and posterior fossa lesions. However, MRI allows a more detailed assessment of brain anatomy and its associated pathology (Fig. 4.9). Therefore, once a space-occupying lesion is identified on CT, an MRI is carried out as the next step in the imaging investigation to further characterize the mass and its relationship to the rest of the parenchyma.
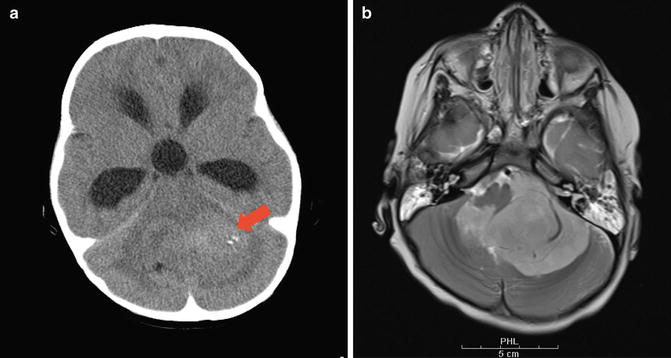
Fig. 4.9
(a) Non-enhanced CT demonstrates a posterior fossa mass (red arrow). (b) However, an axial T2-weighted MR image of the same lesion showed that the lesion is extra-axial in location involving the 4th ventricle and foramen of Luschka on the left side. This demonstrates the superior tissue characterization obtained with MR technique
Magnetic Resonance Imaging
MRI Image Formation
The principle of MRI imaging acquisition is based on the spin movement of hydrogen atoms. Intermittent radiofrequency pulses are turned on to cause resonance of these atoms. The atomic resonance is extinguished when the radiofrequency pulse is turned off. At this moment, there is a relaxation period while the atoms are losing resonance in which a radiofrequency pulse is emitted by the atoms and then captured by the MRI coils (a device placed around the patient which acts as a receptor), giving the necessary information for the image formation. The set of images obtained with a specific combination of radiofrequencies is called a sequence.
Stay updated, free articles. Join our Telegram channel

Full access? Get Clinical Tree


