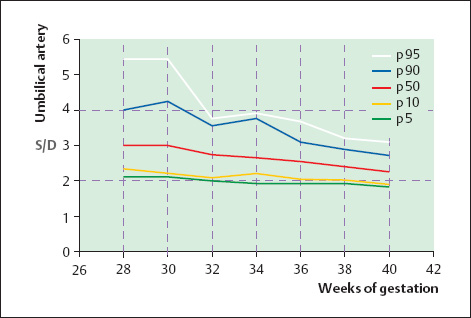
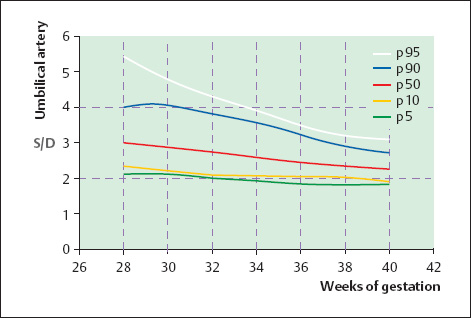
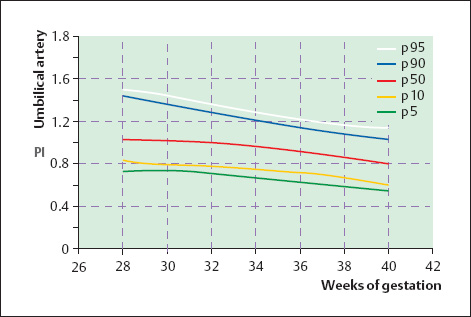
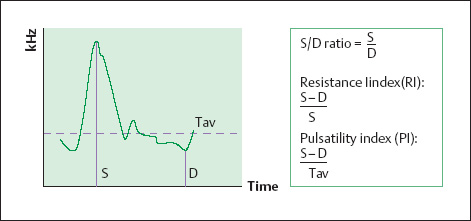
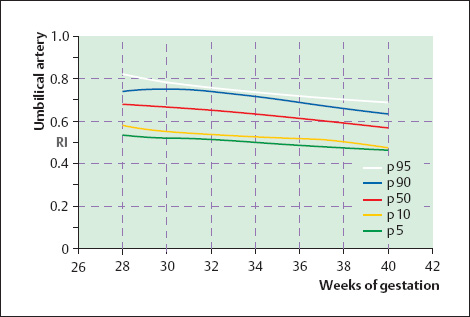
15 Normal Fetomaternal Doppler Indices in the Second and Third Trimesters of Pregnancy The goal of defining normal values for fetomaternal perfusion is to be able to discriminate between normal and abnormal pregnancies on the basis of Doppler ultrasound findings. This requires the establishment of reference values and normal values for physiological conditions of flow8. “Ideal” course of pregnancy. Not infrequently, normal values are based on data from pregnancies that must meet a set of normal criteria and thus represent more of an “ideal” case. Because of this selection effect, the defined cutoff limits may be too narrow for at best they describe the variability of “ideal values” rather than the original biological scatter27. Dependence on gestational age. Perfusion changes have been described with advancing gestation due to maturation of the trophoblastic tissue, and these changes must be considered in the interpretation of reference curves. It is best, therefore, to use gestational-age-based charts to express the normal values for particular indices. Measurements should commence at a stage of the pregnancy when the results of the measurements can still influence obstetric management. The current consensus is that this is the mid-second trimester of pregnancy, when fetal viability is reached. There are also cases in which the analysis of maternal arterial waveforms can be rewarding in earlier weeks of pregnancy16. Cross-sectional studies. In a cross-sectional study design, the measurements should be spaced as evenly as possible over the study period, obtaining an adequate number of measurements for the various weeks of pregnancy, such as more than 15 per week13. It is best to avoid multiple measurements in any one pregnancy as this might narrow the tolerance ranges by reducing the variability relative to the natural biological scatter9. The goal of establishing normal reference curves is to offer a more favorable prognosis for pregnancies that are at risk by their history and/or findings but exhibit normal blood flow patterns. This also requires the analysis of populations with abnormal pregnancies20. The curves presented below are designed to show the distribution of normal values for the Doppler indices that are most commonly used to characterize fetomaternal blood flow. Our normal population consisted of patients whose dates had been confirmed by an ultrasound examination before the 20th week of pregnancy. We excluded cases that had a primary cesarean section for placental insufficiency and cases with an abnormal fetal heart rate (FHR) trace or impending intrauterine asphyxia. The birthweights in the normal population were between the 10th and 90th percentiles for gestational age as defined as Roemer et al.18. The 5- and 10-minute Apgar scores were 7 or higher, and the umbilical artery pH was 7.20 or higher. We also excluded multiple pregnancies and cases with fetal anomalies. Indices. The qualitative analysis of recorded Doppler waveforms has proved to be a more useful clinical tool than the more complex calculation of volume flow. This is reasonable when we consider that a quantitative analysis requires the measurement of small vascular cross sections, and this adds a potential source of error. Numerous indices have been devised for the qualitative analysis of Doppler waveforms (review in reference 8). The following are the most commonly used (Fig. 15.1): The following quantities are used in analyzing the Doppler sonogram and calculating the indices: S = maximum peak systolic frequency D = maximum end-diastolic frequency Tav = temporal average of maximum frequency D = instantaneous spatial average frequency E = temporal average of spatial average frequencies Fig. 15.1 Parameters used for qualitative waveform analysis. S = maximum systolic frequency, D= maximum end-diastolic frequency, Tav = temporal average of maximum frequency. The indices are calculated from the maximum systolic (S) and end-diastolic (D) frequency shifts and, in the case of the PI, from the maximum frequency shift averaged over the entire cardiac cycle (Tav) using these formulas (Fig. 15.1): In some ultrasound systems, the temporal average of the maximum frequencies (E) is used in calculating the PI. This results in correspondingly higher values. In the studies published to date, no definite advantage has been found for any single parameter6,8,9–11. Because all the indices express a ratio, they are largely independent of the insonation angle. The S/D ratio is very easy to determine, and the RI is easy to interpret: values close to 0 signify a very low flow resistance, while a value of 1 indicates cessation of flow. The PI, however, is the only index that can provide differentiated information on an absence of end-diastolic flow, because the average maximum frequency shift contains information on the cardiac cycle as a whole, while the S/D ratio tends toward infinity and the RI equals 1 in cases with absent end-diastolic flow. Quantiles. Our calculation of normal values was based on 602 pulsed Doppler flow measurements in 370 patients who met the normal population criteria defined above. An average of 1.62 measurements were acquired per patient. Quan tiles were determined as a function of gestational age, since the Doppler values did not show a normal distribution. The study period was divided into intervals of two consecutive gestational weeks each, and the 5th, 10th, 50th, 90th, and 95th quantiles were calculated and plotted graphically for each interval. The curves were smoothed by cubic regression. In the first example given below, both the smoothed and original curves are shown. Since the smoothing did not significantly alter the curve shape, only the smoothed curves are presented in the figures below. Th e 5th, 10th, 50th, 90th, and 95th quantiles are shown for each of the measured indices. Figures 15.2–15.14 show the reference curves obtained for the S/D ratio, PI, and RI of the umbilical artery, fetal aorta, middle cerebral artery, and uterine artery. Figure 15.15 shows the reference curves for the cerebroplacental ratio. Fig. 15.2 Reference curves for the S/D ratio of the umbilical artery, based on 600 measurements in normal pregnancies and grouped by even gestational weeks. Fig. 15.3 Reference curves for the S/D ratio of the umbilical artery, based on 600 measurements in normal pregnancies and grouped by even gestational weeks. The curves were smoothed by cubic regression. Fig. 15.4 Reference curves for the RI of the umbilical artery, based on 600 measurements in normal pregnancies and grouped by even gestational weeks. The curves were smoothed by cubic regression.
Establishing Normal Curves
Methodology
Defining the Normal Population
Plotting Quantile Curves
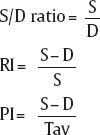
![]() The S/D ratio of Stuart (1980)22
The S/D ratio of Stuart (1980)22
![]() The resistance index (RI) of Pourcelot (1974)17
The resistance index (RI) of Pourcelot (1974)17
![]() The pulsatility index (PI) of Gosling and King (1977)11
The pulsatility index (PI) of Gosling and King (1977)11
Results
Stay updated, free articles. Join our Telegram channel

Full access? Get Clinical Tree


