Neonatology in the United States: Scope and Organization
Richard L. Bucciarelli
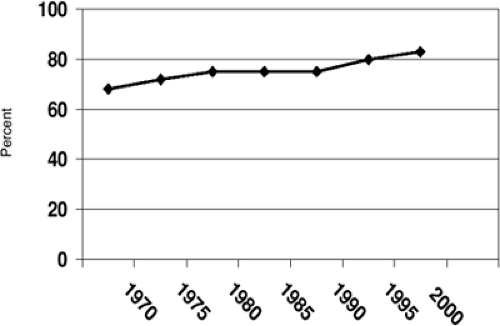
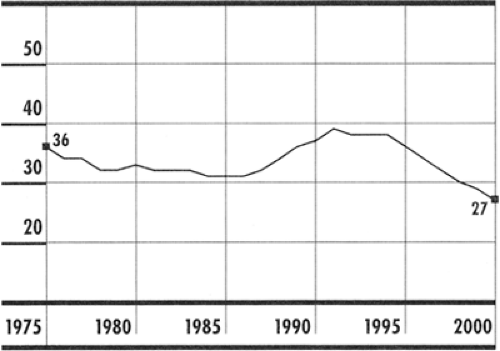
The practice of neonatal and perinatal medicine has changed enormously since its recognition as a distinct subspecialty in 1975. The development of technologies as complex as extracorporeal membrane oxygenation and as simple as the administration of exogenous surfactant, has resulted in the survival of many infants who would have succumbed to their illnesses just a few years ago. In addition, an ever-increasing awareness of the benefits of interpregnancy and prenatal care has lead to significant behavior modification among many pregnant women, resulting in a reduction in the occurrences of conditions such as fetal alcohol syndrome and neural tube defects (1). Early diagnosis and peripartum therapy has decreased the risk of the vertical transmission of diseases such as hepatitis B and HIV (2). Despite erosions in health insurance coverage for women and the general population, fewer pregnant women are uninsured than nonpregnant women (13% versus 28%), and recent expansions in eligibility for coverage under Medicaid may reduce this number even further (1). In 2000, 83.2% of women received early prenatal care, up from 75.8% in 1990 (Fig. 3-1) (3). Teen birth rate has reached an all time low at 27 per 1,000 females ages 15 to 17 years, compared to 39 per 1,000 in 1991 (Fig. 3-2) (4).
Notwithstanding these positive trends, the rate of preterm, very preterm, low-birth-weight (LBW), and very-low-birth-weight (VLBW) deliveries in the United States has not changed significantly in more than a decade and remains far below the Healthy People 2010 goals (1). In 1998 the United States reported an infant mortality rate of 7.2 per 1,000 live births, resulting in a ranking of 28th in the world behind Cuba and just ahead of Slovakia (Table 3-1) (5). Even more troubling is the existence of significant racial and ethnic disparities in every indicator of perinatal health outcome, with neonatal and infant mortality for African Americans exceeding twice that of whites and three times the year 2010 goal (1).
This poor performance of the United States is not because of an unwillingness to commit significant resources to the delivery of perinatal care. In 1985, expenditures for obstetric and neonatal care approached $15 billion. Today this figure exceeds $40 billion, with the incremental costs for hospitalization for preterm labor reaching $820 million (6).
The stark contrast between the enormous economic investment in perinatal care and the relatively static outcome statistics suggests that while the United States has concentrated on developing the world’s most sophisticated high-tech care, we have done little to understand the biological and societal issues responsible for producing high-risk infants. Perhaps this is a statement of our health care system’s superb ability to care for the individual patient, in this case a high-risk infant after delivery, while failing to develop systems that integrate resources to provide efficient, cost-effective preventive care that could reduce human suffering and conserve vast resources.
In this chapter, the current size and scope of the practice of neonatology in the United States is reviewed, emphasizing how resources are currently used to deliver neonatal care. Issues are presented in an attempt to identify potential areas of focus for those involved in developing future perinatal public policy.
THE CAPACITY TO DELIVER IN-HOSPITAL NEONATAL CARE
Neonatal Hospital Bed Capacity
Because there is no national database defining or inventorying special-care neonatal beds, the exact capacity for providing neonatal intensive care unit (NICU) services in the United States is unknown. The estimates of capacity are further complicated by the fact that the definition for levels of inpatient NICU services varies greatly from state to state. Although clearly outlined by the Committee on Perinatal Health (COPH) of the March of Dimes Birth Defects Foundation in 1970 (revised in 1980 and 1993), financial, marketing, medical-legal, and community demands have encouraged many hospitals to elevate the level of select perinatal services, focusing on the provision of services locally with little regard to regional needs (7,8). As a result, there has been a significant increase in the number of hospitals providing NICU care, as well as blending neonatal services available primarily at basic care (level I) and specialty care (level II) centers (8).
TABLE 3-1 INFANT MORTALITY RATES, BY COUNTRY, 1998 | ||||||||||||||||||||||||||||||||||||||||||||||||||||||||||||||||||||||||||||||||||||||||||||||||
|---|---|---|---|---|---|---|---|---|---|---|---|---|---|---|---|---|---|---|---|---|---|---|---|---|---|---|---|---|---|---|---|---|---|---|---|---|---|---|---|---|---|---|---|---|---|---|---|---|---|---|---|---|---|---|---|---|---|---|---|---|---|---|---|---|---|---|---|---|---|---|---|---|---|---|---|---|---|---|---|---|---|---|---|---|---|---|---|---|---|---|---|---|---|---|---|---|
| ||||||||||||||||||||||||||||||||||||||||||||||||||||||||||||||||||||||||||||||||||||||||||||||||
In 1996, the National Perinatal Information Center reported an extensive survey of the supply and distribution of obstetric and neonatal services. While the number of hospitals offering obstetric services had declined, the numbers offering NICU services had increased dramatically by 64% such that one third of all hospitals with obstetric services were also operating an NICU. When the investigators adjusted for the number of live births, they discovered that the number of neonatal special care beds had increased significantly from 3.0 per 1,000 live births to 4.3 per 1,000 live births over the 10-year period of the study (9). More recent information suggests that this ratio has climbed
even further to 5.1 per 1,000 live births, exceeding the calculated demand by a factor of between 2 and 3 (10,11). In 2002, Thompson and associates (11) compared the capacity for in-hospital neonatal intensive care in the United States with that of the United Kingdom, Australia, and Canada (countries with similar neonatal practices). It is no surprise that the United States leads the way with an NICU bed capacity equal to five times that of the United Kingdom and twice that of Australia and Canada. Further, this difference remains even if the capacity is adjusted for the incidence of LBW infants (Table 3-2). The authors also point out that despite this huge capital investment, the United States trails all three countries in reported neonatal and infant mortality rates.
even further to 5.1 per 1,000 live births, exceeding the calculated demand by a factor of between 2 and 3 (10,11). In 2002, Thompson and associates (11) compared the capacity for in-hospital neonatal intensive care in the United States with that of the United Kingdom, Australia, and Canada (countries with similar neonatal practices). It is no surprise that the United States leads the way with an NICU bed capacity equal to five times that of the United Kingdom and twice that of Australia and Canada. Further, this difference remains even if the capacity is adjusted for the incidence of LBW infants (Table 3-2). The authors also point out that despite this huge capital investment, the United States trails all three countries in reported neonatal and infant mortality rates.
TABLE 3-2 NEONATAL CARE: PHYSICIAN AND HOSPITAL CAPACITY | |||||||||||||||||||||||||||||||||||||||||||||||||||||||||||||||||||||||||||
|---|---|---|---|---|---|---|---|---|---|---|---|---|---|---|---|---|---|---|---|---|---|---|---|---|---|---|---|---|---|---|---|---|---|---|---|---|---|---|---|---|---|---|---|---|---|---|---|---|---|---|---|---|---|---|---|---|---|---|---|---|---|---|---|---|---|---|---|---|---|---|---|---|---|---|---|
| |||||||||||||||||||||||||||||||||||||||||||||||||||||||||||||||||||||||||||
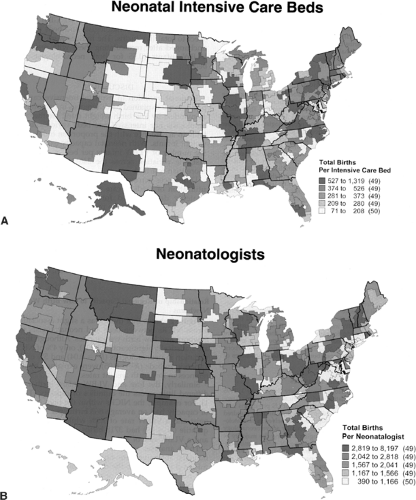
Although the United States has an in-hospital neonatal bed capacity that exceeds that of any other nation, its distribution across our nation is not homogenous and does not seem to follow any identifiable pattern, ranging from a low of 14 per 10,000 live births to a high of 59 per 10,000 live births (from 71 to 1,319 total births per NICU bed). Once again there was no correlation between the number of beds in a region with the incidence of LBW or neonatal mortality (12).
Size and Effectiveness of the Neonatologist Workforce
In an attempt to address the capacity issue more accurately, investigation recently has focused on the size and distribution of the neonatal work force as a potentially more accurate proxy for our capacity to deliver in-hospital neonatal care in the United States. Clearly, neonatologists are the catalysts that create a hospital environment, resulting in the creation of NICU beds and ultimately in the desire to provide higher risk obstetrical and neonatal care within that institution. Because a neonatologist can utilize a broad array of neonatal health care specialists to provide services at several institutions simultaneously, the ratio of neonatologists to both high- and low-risk deliveries and their distribution within the region may more accurately define the capacity for in-hospital neonatal care.
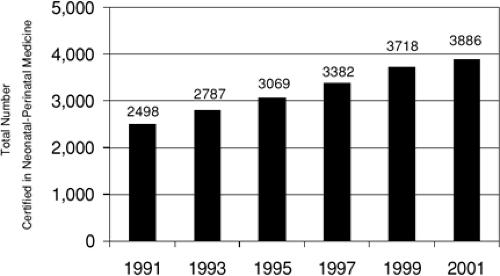
In 1975, the American Board of Pediatrics’ sub-Board of Neonatal and Perinatal Medicine certified 355 physicians as the first neonatologists in the United States. Since then, the American Board of Pediatrics has certified an additional 3,531 candidates. Currently there are 3,886 neonatologists certified by the Board, including the results of the latest certifying examination in 2001 (Fig. 3-3) (13). It is of interest to note that between 1987 and 1999, an average of 300 candidates was certified with each examination. In 2001, the number dropped to 182, the lowest number ever certified during a single examination. The average age at certification is 32 years, while the average age of all certified neonatologists is 51 years. During the early years of certification, males dominated by almost 3:1. In more recent years, the gender distribution approached 1:1, with
more females certified during the 2001 certification (97 females, 85 males). Although the attrition rate for neonatologists was once believed to be quite high, it has remained low at 1% to 2% over a 10-year period. Additionally, it appears that almost 1,000 physicians actively engaged in the practice of neonatology are physicians who have not completed sub-Board certification or are pediatricians with special training in neonatology who concentrate their efforts on caring for neonates with special needs (14,15). Thus, the total neonatal physician workforce approaches 5,500, having doubled in the last decade and more than tripled since 1985 (13,14 and 15).
more females certified during the 2001 certification (97 females, 85 males). Although the attrition rate for neonatologists was once believed to be quite high, it has remained low at 1% to 2% over a 10-year period. Additionally, it appears that almost 1,000 physicians actively engaged in the practice of neonatology are physicians who have not completed sub-Board certification or are pediatricians with special training in neonatology who concentrate their efforts on caring for neonates with special needs (14,15). Thus, the total neonatal physician workforce approaches 5,500, having doubled in the last decade and more than tripled since 1985 (13,14 and 15).
 Figure 3-3 Cumulative total of specialists in neonatal and perinatal medicine certified by the American Board of Pediatrics, 1991-2001. (From American Board of Pediatrics. American Board of Pediatrics Neonatal-Perinatal Medicine qualifying examination statistics. Chapel Hill, NC: American Board of Pediatrics. Available online at http://www.abp.org/stats/WRKFRC/neostat.htm.) |
TABLE 3-3 BIRTHS PER EACH CLINICALLY ACTIVE NEONATOLOGIST AND PEDITRICIAN IN UNITED STATES, 1981–1996 | |||||||||||||||||||||||||||||||||||||||||||||||||||||
|---|---|---|---|---|---|---|---|---|---|---|---|---|---|---|---|---|---|---|---|---|---|---|---|---|---|---|---|---|---|---|---|---|---|---|---|---|---|---|---|---|---|---|---|---|---|---|---|---|---|---|---|---|---|
| |||||||||||||||||||||||||||||||||||||||||||||||||||||
Concerns about a physician workforce devoted to neonatology, its distribution, its affect on regionalization, and, most importantly, its affect on outcome measures have been raised several times (16). In 1981, there were 83 very-low-birth-weight (less than 1,500 g) and 39 additional extremely low-birth-weight (ELBW [less than 1,000 g]) infants for every neonatologist. By 1996 these numbers dropped to 23 VLBW infants and 11 ELBW infants for every active neonatologist (Table 3-3) (17). In its statement on the neonatal workforce, the American Academy of Pediatrics Committee on the Fetus and Newborn (COFN) recommended that the neonatologist:live birth ratio be 1:2,569 live births—which is 3.9 neonatologists per 10,000 live births (16). In 1996, the ratio was calculated to be 1:1,687 live births—which is 5.9 neonatologists per 10,000 live births, 1.5 times the original target. In addition, 50% of the neonatologists surveyed in this study reported that a very significant portion of their practice was devoted to the care of normal newborn infants (18).
Similar to the in-hospital bed capacity analysis, Goodman and associates (18) report wide variations in the availability of neonatologists, ranging from 1.2 per 10,000 live births to a high of 25.6 per 10,000 live births (a range of 390-8,197 births per neonatologist) (Figs. 3-4a,b). Regional variations were unexplained by differences in LBW, number of high-risk pregnancies, or use of mid-level providers. Regions with an average of 2.7 neonatologists per 10,000 live births or less experienced a slight, but significant increase in mortality only for infants with birth weights of 500 to 999 g. Once birth weight exceeds 999 g or the number of neonatologists exceeds 4.3 per 10,000 live births, there are no additional improvements seen in neonatal mortality (19).
Lessons Learned
The attempt to correlate outcome with either NICU in-hospital bed capacity or the number and distribution of neonatologists presents several dilemmas. First, gross outcome of neonatal care, such as the incidence of LBW or neonatal and infant mortality, may be insensitive to regional changes in resource availability. It is entirely possible that there exists a yet-to-be-defined threshold above which the impact of additional available resources is no longer obvious. Alternatively, it is well established that birth weight is a reflection of socioeconomic status and quality of care before delivery and is not directly influenced by postnatal medical interventions (12,20). As the COPH stated in 1993, appropriate preconception and prenatal care may contribute significantly to increasing birth weight and decreasing neonatal mortality (7).
COSTS OF DELIVERING NEONATAL CARE
Acute Care In-Hospital Costs
Estimates suggest that the total expenditures for perinatal care in the United States exceed $6,850 per mother-infant pair (7). This represents 4.5% of personal health care
spending by all Americans and 7% of health care spending by the population younger than 65 years of age. Most of these resources are spent on acute, high-tech care of the critically ill neonate, with daily charges easily reaching $1,000 to $2,500 for hospital services and an additional $300 to $450 each day for physician services (21). Of the four million births predicted in 2003, 280,000 will be premature, with an estimated cost of $12 billion for acute in-hospital neonatal care. Approximately one third of these expenditures, $4 billion, would be used to provide care for infants weighing between 500 and 700 g (22). An additional $1 billion would be spent on hospitalizations for preterm labor in an attempt to delay delivery as long as possible. Because the costs for complicated births (ranging from $20,000 to $400,000) are many fold greater than the costs of an uncomplicated delivery (averaging $6,400), the investment in delaying delivery as long as possible is entirely justified (6).
spending by all Americans and 7% of health care spending by the population younger than 65 years of age. Most of these resources are spent on acute, high-tech care of the critically ill neonate, with daily charges easily reaching $1,000 to $2,500 for hospital services and an additional $300 to $450 each day for physician services (21). Of the four million births predicted in 2003, 280,000 will be premature, with an estimated cost of $12 billion for acute in-hospital neonatal care. Approximately one third of these expenditures, $4 billion, would be used to provide care for infants weighing between 500 and 700 g (22). An additional $1 billion would be spent on hospitalizations for preterm labor in an attempt to delay delivery as long as possible. Because the costs for complicated births (ranging from $20,000 to $400,000) are many fold greater than the costs of an uncomplicated delivery (averaging $6,400), the investment in delaying delivery as long as possible is entirely justified (6).
Charges associated with specific perinatal diagnoses rank among the highest of all hospital diagnoses (Table 3-4). A 1999 report by the Health Care Cost and Utilization Project’s Nationwide Inpatient Sample listed neonatal respiratory distress syndrome as the most expensive diagnosis, with a mean charge of $82,648 and a mean length of stay of 27.8 days. Other diagnoses included in the top 10 categories were:
Low-birth-weight (mean charge of $56,942)
Cardiac anomalies (mean charge of $49,858)
Intrauterine hypoxia and birth asphyxia (mean charge of $36,954) (23)
In analyzing data from 3,288 VLBW infants from 25 NICUs, Rogowski (24) reported that treatment costs vary inversely with birth weight, with a median treatment cost of $89,546 for infants weighing between 501 g and 750 g and $32,531 for infants weighing between 1,251 g and 1500 g.
In this analysis, she included costs of accommodation (room and personnel costs) and ancillary services (respiratory therapy, laboratory, radiology, pharmacy, and medical supplies). While accommodation costs varied by a factor of two when comparing the largest and smallest VLBW infants, ancillary costs varied by almost five fold, with laboratory and respiratory services showing the widest variation. When costs were corrected for length of stay, the costs per day were surprisingly similar, varying by only $552 per day between infants weighing 1,251 to 1,500 g at birth and those weighing 501 to 750 g at birth (Table 3-5).
In this analysis, she included costs of accommodation (room and personnel costs) and ancillary services (respiratory therapy, laboratory, radiology, pharmacy, and medical supplies). While accommodation costs varied by a factor of two when comparing the largest and smallest VLBW infants, ancillary costs varied by almost five fold, with laboratory and respiratory services showing the widest variation. When costs were corrected for length of stay, the costs per day were surprisingly similar, varying by only $552 per day between infants weighing 1,251 to 1,500 g at birth and those weighing 501 to 750 g at birth (Table 3-5).
TABLE 3-4 MOST COMMON HOSPITAL DISCHARGE DIAGNOSES WITH MEAN CHARGES AND MEAN LENGTH OF STAY | ||||||||||||||||||||||||||||||||||||||||||||||||
|---|---|---|---|---|---|---|---|---|---|---|---|---|---|---|---|---|---|---|---|---|---|---|---|---|---|---|---|---|---|---|---|---|---|---|---|---|---|---|---|---|---|---|---|---|---|---|---|---|
| ||||||||||||||||||||||||||||||||||||||||||||||||
Because physician services are billed separately from the hospital, most studies do not include them in the analysis and, as a result, the true picture of the cost of neonatal care is somewhat distorted. This distortion can be significant when one considers that the cost of physician services in the NICU approaches 15% of the total hospital bill (21).
Although these data are valuable and serve as a rough estimate of expenditures, caution must be used when attempting to apply them to actual expenditures for neonatal care at the local or state level. By and large, these data are derived from in-hospital data as reported on state and federal cost reports, which reflect charges and not the true costs of delivering care. Further, many studies report individual hospital, state, or regional experiences that vary greatly based on the accounting principles used by that facility.
TABLE 3-5a MEDIAN TREATMENT COSTS AND LENGTH OF STAY FOR VERY-LOW-BIRTH-WEIGHT INFANTS | |||||||||||||||||||||||||||||||||||||||||||||||||
|---|---|---|---|---|---|---|---|---|---|---|---|---|---|---|---|---|---|---|---|---|---|---|---|---|---|---|---|---|---|---|---|---|---|---|---|---|---|---|---|---|---|---|---|---|---|---|---|---|---|
| |||||||||||||||||||||||||||||||||||||||||||||||||
Stay updated, free articles. Join our Telegram channel

Full access? Get Clinical Tree


