Intrauterine Growth Restriction and the Small-For-Gestational-Age Infant
Marianne S. Anderson
William W. Hay
INTRODUCTION
Much of the interest in infants who are small for gestational age (SGA) at birth, and much of the impetus for studying intrauterine growth restriction (IUGR) that produces SGA infants, began with the observation by pediatricians and neonatologists that newborn infants who were classified according to birth weight as small, average, or large for gestational age (SGA, AGA, and LGA, respectively) showed specific morbidities and rates of death that were unique to each of these birth weight-gestational age classifications (1) (See Appendix D for intrauterine growth charts). SGA infants were recognized as having more frequent problems with perinatal depression (“asphyxia”), hypothermia, hypoglycemia, polycythemia, long-term deficits in growth, neurodevelopmental handicaps, and higher rates of fetal and neonatal mortality (2) (Fig. 26-1). Although there have been tremendous improvements in perinatal diagnosis and treatment, severe IUGR and the birth of markedly SGA infants continue to be frequent problems, and the perinatal morbidity and mortality rates of IUGR fetuses and SGA infants continue to exceed those of normal fetuses and infants.
DEFINITIONS
Small for Gestational Age
SGA infants are classically defined as having a birth weight that is more than two standard deviations below the mean or less than the 10th percentile of a population-specific birth weight vs. gestational age plot. Broader definitions include less than normal anthropometric indexes, such as length and head circumference, and marked differences between growth parameters, even when they are within the normal range. For example, an infant can be considered “relatively” SGA when its weight is at the 25th percentile, but its length and head circumference are at the 75th percentile. In this case, the weight/length ratio (or the Ponderal index = [weight (g)]/[length (cm)]3) is less than normal, indicating that growth rates of adipose tissue and skeletal muscle, the principal determinants of weight, were less than normal (Fig. 26-2) (3).
Intrauterine Growth Restriction
IUGR is defined as a rate of fetal growth that is less than normal for the population and for the growth potential of a specific infant. IUGR therefore produces infants who are SGA. SGA infants can be the result of normal but slower than average rates of fetal growth, such as those constitutionally small but not abnormal infants whose parents, siblings, and more distant relatives are small (4). SGA infants also can be the result of abnormally slow fetal growth that is caused by pathophysiologic conditions or diseases. Because growth is one of the essential features of the fetus, nearly any aberration of biologic activity in the fetus can lead to growth failure. Thus, small size at birth can be either a normal outcome or one that is a result of intrinsic or extrinsic factors that limit fetal growth potential.
Birth Weight Classification of Growth
Many terms are used to describe variations in fetal growth. For example, human newborns are classified as having normal birth weight (greater than 2,500 g), low birth weight (LBW, less than 2,500 g), very low birth weight (VLBW, less than 1,500 g), or extremely low birth weight (ELBW, less
than 1,000 g). Obviously, classification by weight alone says little about fetal growth rate, as most infants with less than normal birth weights are the result of a shorter than normal gestation, i.e., they are preterm. Similarly, classifying newborns as preterm or term on the basis of birth weight is erroneous, as infants with IUGR are smaller than normal at any gestational age.
than 1,000 g). Obviously, classification by weight alone says little about fetal growth rate, as most infants with less than normal birth weights are the result of a shorter than normal gestation, i.e., they are preterm. Similarly, classifying newborns as preterm or term on the basis of birth weight is erroneous, as infants with IUGR are smaller than normal at any gestational age.
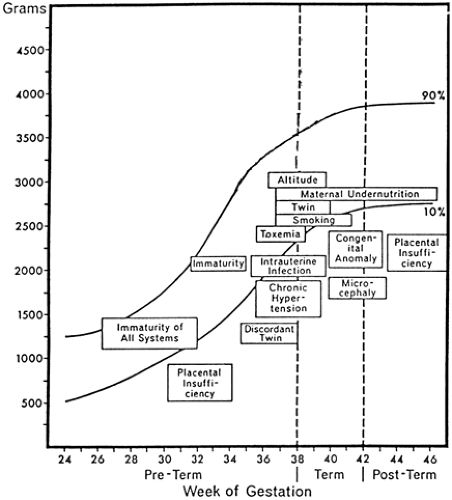 Figure 26-1 Morbidities specific to small-for-gestational-age infants. (Adapted from Lubchenco LO. The high risk infant. In: Schaffer AJ, Markowitz M, eds. Major problems in clinical pediatrics, volume XIV. Philadelphia: WB Saunders, 1976:6.) |
Normal Variations and the Assessment of Fetal Growth
Normal fetal growth varies almost twofold. For example, mean birth weight for neonates born in New Guinea is 2,400 g (5), whereas normal birth weights in other populations can exceed 4,000 g (6). Such variations are related to genetic and environmental factors, the latter usually reflecting local diets (e.g., the relatively obese infants of Polynesian women who eat relatively large amounts of starchy foods in their normal diet). These and other normal anthropometric variations must be considered in relation to the diagnosis of IUGR in fetuses and SGA status of newborns.
Symmetric and Asymmetric Growth Restriction
SGA infants have been classified as having symmetric or asymmetric IUGR. Symmetric IUGR implies that brain and body growth both are limited. Asymmetric growth indicates that body growth is restricted to a much greater extent than head (and thus, brain) growth. In such cases, brain growth is considered “spared.” Mechanisms that allow brain growth to continue at a faster rate than adipose tissue and skeletal muscle are not completely known. Contributing factors may include an increased rate of cerebral blood flow relative to the umbilical and systemic circulations, which has been observed in some of these infants (7). In some experimental models, cerebral glucose transporter concentrations are preserved despite fetal hypoglycemia, indicating preservation of cerebral glucose uptake capacity (8). The most severely affected infants have marked reductions in both brain and body growth. Even moderately IUGR infants have growth restrictions of both brain and body, but to varying degrees that depend on the duration and severity of the insults that inhibit growth. Asymmetric and symmetric growth restriction are best thought of, therefore, as extreme examples (Fig. 26-3). Asymmetric fetal growth differentially affects organs other than the brain. As shown in Fig. 26-4, the heart also is larger for body weight in these infants, whereas the liver, probably representing glycogen deficit, and thymus, perhaps indicating a response to stress but also showing a potential for immunologic inadequacy, are smaller for body weight.
In general, factors intrinsic to the fetus cause symmetric growth restriction, whereas external factors cause asymmetric growth. Patterns of symmetric growth restriction develop early during fetal life, reflecting their intrinsic nature. Asymmetric patterns also can develop as early as the second trimester (9) and as much as 30% to 50% of extremely pre-term neonates (less than 1,000 g) are SGA, probably reflecting pathology that produced growth restriction and led to preterm birth. Factors that limit the growth of both the fetal brain and body include chromosomal anomalies (e.g., parti-cularly trisomy conditions), congenital infections (toxoplasmosis, rubella, cytomegalovirus), dwarf syndromes, some inborn errors of metabolism, and some drugs (10). The mechanisms by which these factors limit fetal growth are multifactorial.
Asymmetric growth restriction classically develops during the late second and third trimesters when fetal nutrients, particularly glucose and lipids, increasingly contribute to energy storage in the form of glycogen and fat (in both brown and white adipose tissue) (11). Slight reductions of energy substrate supply to the fetus limit fat and glycogen storage and the growth of skeletal muscle, but allow for continued bone and brain growth. More extreme limitations of energy substrates, for longer periods, affect both growth and energy storage. Timing is important; with decreased nutrient supply early in gestation, growth of all body organs is restricted, whereas decreased fetal nutrient supply later in gestation primarily restricts growth of glycogen content, adipose tissue, and skeletal muscle.
INTERPRETATION OF FETAL GROWTH CURVES
Growth Curves Based on Neonatal Measurements
Cross-sectional growth curves have been developed from anthropometric data in populations of infants born at
different gestational ages (12). Such curves have been used to demonstrate whether an infant’s weight is within the normal range for a given gestational age and thus to estimate whether that infant’s in utero growth was greater or less than normal. The normal range is defined as birth weights between the 10th and 90th percentile of the population-specific birth weight vs. gestational age relationship. Fetuses and neonates who are within the 10th and 90th percentiles for weight vs. gestational age are considered AGA. Those who are less than the 10th percentile are considered SGA. Those who are greater than the 90th percentile are considered LGA. Other terms for SGA infants include light for dates and small for dates.
different gestational ages (12). Such curves have been used to demonstrate whether an infant’s weight is within the normal range for a given gestational age and thus to estimate whether that infant’s in utero growth was greater or less than normal. The normal range is defined as birth weights between the 10th and 90th percentile of the population-specific birth weight vs. gestational age relationship. Fetuses and neonates who are within the 10th and 90th percentiles for weight vs. gestational age are considered AGA. Those who are less than the 10th percentile are considered SGA. Those who are greater than the 90th percentile are considered LGA. Other terms for SGA infants include light for dates and small for dates.
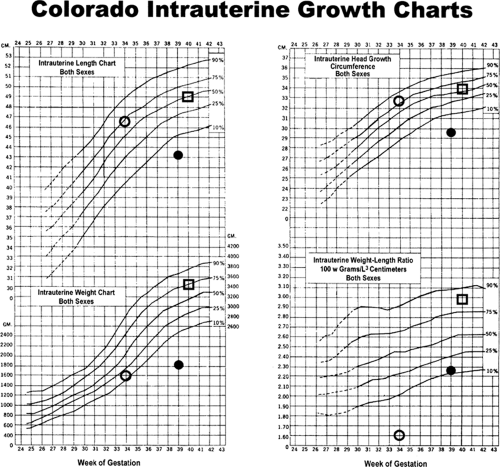 Figure 26-2 The Colorado Intrauterine Growth Charts, including symbols that define the anthropometric measurements for the three infants shown in Fig. 26-2. (O) Preterm infant at 34 weeks of gestation, showing asymmetry of weight (15th percentile) versus length and head circumference (75th percentile) and weight-to-length ratio (85th percentile); (•) severely but symmetrically small-for-gestational-age infant at 39 weeks, showing weight, length, head circumference, and weight-to-length ratio all about equally and markedly (<10th percentile); and (□) symmetric average-for-gestational-age infant at 40 weeks, showing weight, length, head circumference, and weight-to-length ratio about the 65th to 75th percentile. (Growth charts from Lubchenco LO, Hansman C, Boyd E. Intrauterine growth in length and head circumference as estimated from live births at gestational ages from 26 to 42 weeks. Pediatrics 1966;37:403 (ref. 13). |
Most growth curves usually are confined to the third trimester. Each curve is based on local populations with variable composition of maternal age, parity, socioeconomic status, race, ethnic background, body size, degree of obesity or thinness, health, pregnancy-related problems, and nutrition,
and the number of fetuses per mother, the number of infants included in the study, and by what methods and how accurately measurements of body size and gestational age were made. Estimating gestational age, in particular, has considerable error. Such error is derived from variability in dating conception because of maternal postimplantation bleeding and irregular menses, wide variability in the development physical features of maturation in the infant, and interobserver variability in assessing an infant’s developmental stage. The growth curves shown in Fig. 26-2 are those of Lubchenco and colleagues (13) in Denver, Colorado, published in 1966. They are biased to slightly lower birth weights compared with many other growth curves, especially close to term, as a result of the unique mix of racial and ethnic groups in the population of babies who were born at Colorado General Hospital, Denver, Colorado, at the time the data were collected. Although the higher altitude of Denver (5,280 feet or ∼1,600 m) has been considered a factor in the smaller birth weights shown in these curves, the independent effect of high altitude on restricting fetal growth is not clearly demonstrable at 1 mile (1.6 km). In fact, growth curves similar to those of Lubchenco et al. have been produced at sea level among lower socioeconomic groups with a high proportion of blacks and Hispanics in the population (Fig. 26-5).
and the number of fetuses per mother, the number of infants included in the study, and by what methods and how accurately measurements of body size and gestational age were made. Estimating gestational age, in particular, has considerable error. Such error is derived from variability in dating conception because of maternal postimplantation bleeding and irregular menses, wide variability in the development physical features of maturation in the infant, and interobserver variability in assessing an infant’s developmental stage. The growth curves shown in Fig. 26-2 are those of Lubchenco and colleagues (13) in Denver, Colorado, published in 1966. They are biased to slightly lower birth weights compared with many other growth curves, especially close to term, as a result of the unique mix of racial and ethnic groups in the population of babies who were born at Colorado General Hospital, Denver, Colorado, at the time the data were collected. Although the higher altitude of Denver (5,280 feet or ∼1,600 m) has been considered a factor in the smaller birth weights shown in these curves, the independent effect of high altitude on restricting fetal growth is not clearly demonstrable at 1 mile (1.6 km). In fact, growth curves similar to those of Lubchenco et al. have been produced at sea level among lower socioeconomic groups with a high proportion of blacks and Hispanics in the population (Fig. 26-5).
Mathematical analyses of various fetal growth curves have been used to determine growth rates over relatively short gestational periods or at discrete gestational ages (12). For example, the data used in the Lubchenco growth curves (Figs. 26-2 and 26-5) can be approximated by a simple exponential function showing fetal weight increasing at about 15 g/day/kg. This rate will vary from the smallest to the largest infants. For a given weight percentile, however, there are only differences of 1% to 2% for this exponential function among different populations and studies.
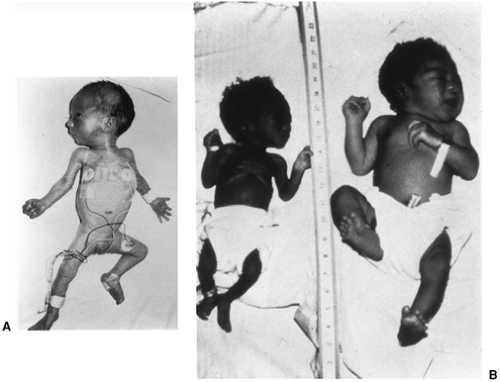 Figure 26-3 Preterm, small-for-gestational-age infant at 34 weeks of gestation (left), severely small-for-gestational-age infant at 39 weeks (middle), and average-for-gestational-age infant at 40 weeks (right). |
Growth Curves Based on Fetal Measurements
Fetal growth curves also have been developed from serial ultrasound measurements of fetuses who subsequently were born at term in healthy condition and with normal
measurements, providing continuous rather than cross-sectional indexes of fetal growth. These curves can be better correlated with the expected fetal growth rate of a particular fetus than can cross-sectional, population-based growth curves. Serial ultrasound measurements of fetal growth also can more accurately determine how environmental factors, such as severe maternal illness and under nutrition, can inhibit fetal growth. Figure 26-6 shows an example of ultrasound data for fetal growth curves, including evidence for a particular fetus whose growth rate clearly was affected adversely by poor maternal health and beneficially by improved maternal nutrition. Further, fetal ultrasound-derived growth curves show less of the midgestational exponential increase in fetal growth rate that is typical of cross-sectional growth curves derived from neonatal measurements at different gestational ages. This observation strengthens the concept that, because preterm birth is not a normal outcome, one must be suspicious of growth parameters and growth curves derived from cross-sectional measurements of preterm infants assessed at birth. The intrauterine growth of these preterm infants probably was affected adversely by the same pathologic factors that led to their preterm birth. Thus, there probably is no ideal fetal growth curve derived from postbirth, cross-sectional measurements. Future growth curves to assess in utero growth of a specific newborn should be based instead on more thoroughly and accurately determined fetal growth parameters from ultrasound measurements in pregnancies with definitely known dates of conception and birth at term of normally grown and developed infants.
measurements, providing continuous rather than cross-sectional indexes of fetal growth. These curves can be better correlated with the expected fetal growth rate of a particular fetus than can cross-sectional, population-based growth curves. Serial ultrasound measurements of fetal growth also can more accurately determine how environmental factors, such as severe maternal illness and under nutrition, can inhibit fetal growth. Figure 26-6 shows an example of ultrasound data for fetal growth curves, including evidence for a particular fetus whose growth rate clearly was affected adversely by poor maternal health and beneficially by improved maternal nutrition. Further, fetal ultrasound-derived growth curves show less of the midgestational exponential increase in fetal growth rate that is typical of cross-sectional growth curves derived from neonatal measurements at different gestational ages. This observation strengthens the concept that, because preterm birth is not a normal outcome, one must be suspicious of growth parameters and growth curves derived from cross-sectional measurements of preterm infants assessed at birth. The intrauterine growth of these preterm infants probably was affected adversely by the same pathologic factors that led to their preterm birth. Thus, there probably is no ideal fetal growth curve derived from postbirth, cross-sectional measurements. Future growth curves to assess in utero growth of a specific newborn should be based instead on more thoroughly and accurately determined fetal growth parameters from ultrasound measurements in pregnancies with definitely known dates of conception and birth at term of normally grown and developed infants.
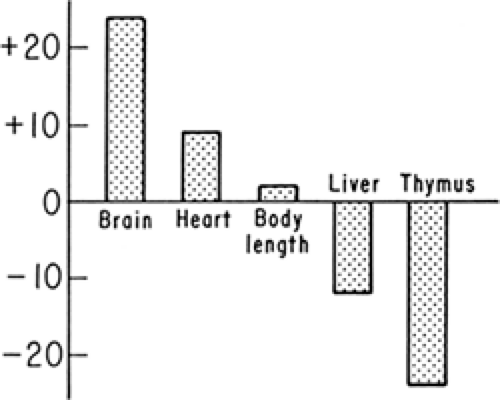 Figure 26-4 Body length and selective organ weight percent changes from normal preterm infants of similar birth weights in necropsy series of IUGR fetuses. (After Gruenwald P. Growth patterns in the normal and deprived fetus. In: Jonxis JHP, Visser HKA, Troelstra JA, eds. Aspects of prematurity and dysmaturity. Springfield: Charles C. Thomas, 1968:43.) |
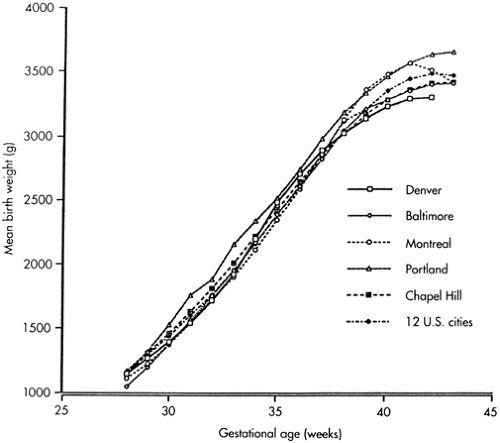 Figure 26-5 Birth weights by ges-tational age from six sources. (Adapted from Naeye R, Dixon J. Distortions in fetal growth standards. Pediatr Res 1978;12:987). |
INTRAUTERINE GROWTH RESTRICTION AND PRETERM BIRTH
Most cases of fetal growth restriction represent only minimal growth delay and are natural, reproductively successful, although not perfect, adaptations to nutrient limitation. Most cases of IUGR, therefore, are not major causes of preterm delivery, and fetal growth rate and length of gestation usually are not related. In cases of severe IUGR, the pathophysiologic processes causing the IUGR also can lead to preterm labor and preterm delivery. Thus, IUGR frequently occurs with a variety of maternal conditions that are associated with preterm delivery (Table 26-1) (14,15,16,17).
Established maternal conditions that are associated with both IUGR and preterm delivery include very low maternal prepregnancy weight, prior preterm delivery, cigarette smoking, indirect effects of very young or advanced maternal age, and lower maternal socioeconomic status (14). Regarding race, African-American women who were born in the United States have a twofold greater incidence of both preterm birth and IUGR than do white women from the United States or African-American women who emigrated from Africa. Reasons for this are multifactorial and include nearly all of the generally associated risks
and causes of IUGR and preterm delivery (15). Stretch-activated mechanisms probably induce preterm labor in cases of multiple gestation, uterine and placental space-occupying anomalies (e.g., fibroids), and polyhydramnios. Insufficient endometrial surface area for placental invasion and growth, plus abnormal placental perfusion, also combine to restrict nutrient delivery to the fetus, leading to IUGR. Poor placental growth and function limit placental supply of growth promoting hormones to the fetus, e.g., human placental lactogen (hPL), steroid hormones, and insulin-like growth factor-I (IGF-I) (18,19,20), and limit effective maternal-fetal nutrient exchange. In cases of polyhydramnios, IUGR often is related to the primary pathologic processes such as fetal infection, anemia, cardiac failure, and neuromuscular disorders. Intrauterine fetal infections can limit fetal growth by damaging the fetal brain and the neuroendocrine axis that support fetal growth via insulin-like growth factors (IGFs) and insulin. Intrauterine infections also can damage the fetal heart, leading to diminished cardiac output, poor placental perfusion, and inadequate nutrient substrate uptake. Fetal infections and ascending infections of the membranes from the vagina also are associated with preterm delivery. They probably do this by enhancing the fetal supply of prostaglandins, which causes fetal and uterine production of various cytokines that are associated with or cause the onset of labor (21). Chronic placental and fetal infections also limit placental perfusion, in some cases by inhibition of nitric oxide production, which leads to uteroplacental vasoconstriction, placental insufficiency, and IUGR (22). Preeclamptic women have poor endometrial vascular support for growth of the placenta, leading to placental growth failure, fetal nutrient deficit, and IUGR (23). Fetal hypoglycemia, hypoxemia, and acidosis usually are present in such cases of poor placental development and perfusion. These factors lead to increased production of prostaglandins and the activation of labor-promoting cytokines, leading also to preterm delivery (24). Many of these cases are delivered preterm to protect the mother from eclampsia or the fetus from hypoxic-ischemic injury. Very young and very old women both produce IUGR infants who often are born prematurely. Nutritional, uterine, and vascular mechanisms may be common in these situations. Young still-growing adolescent girls appear less capable of mobilizing fat reserves in late pregnancy, apparently reserving them instead for their own continued development (25). Failure to mobilize such reserves can limit nutrient supply to the fetus and the rate of fetal growth (26). IUGR in cases of maternal smoking and substance abuse may be as a result of reduced placental blood flow, inhibition of uteroplacental vascular development, or direct fetal toxicity.
and causes of IUGR and preterm delivery (15). Stretch-activated mechanisms probably induce preterm labor in cases of multiple gestation, uterine and placental space-occupying anomalies (e.g., fibroids), and polyhydramnios. Insufficient endometrial surface area for placental invasion and growth, plus abnormal placental perfusion, also combine to restrict nutrient delivery to the fetus, leading to IUGR. Poor placental growth and function limit placental supply of growth promoting hormones to the fetus, e.g., human placental lactogen (hPL), steroid hormones, and insulin-like growth factor-I (IGF-I) (18,19,20), and limit effective maternal-fetal nutrient exchange. In cases of polyhydramnios, IUGR often is related to the primary pathologic processes such as fetal infection, anemia, cardiac failure, and neuromuscular disorders. Intrauterine fetal infections can limit fetal growth by damaging the fetal brain and the neuroendocrine axis that support fetal growth via insulin-like growth factors (IGFs) and insulin. Intrauterine infections also can damage the fetal heart, leading to diminished cardiac output, poor placental perfusion, and inadequate nutrient substrate uptake. Fetal infections and ascending infections of the membranes from the vagina also are associated with preterm delivery. They probably do this by enhancing the fetal supply of prostaglandins, which causes fetal and uterine production of various cytokines that are associated with or cause the onset of labor (21). Chronic placental and fetal infections also limit placental perfusion, in some cases by inhibition of nitric oxide production, which leads to uteroplacental vasoconstriction, placental insufficiency, and IUGR (22). Preeclamptic women have poor endometrial vascular support for growth of the placenta, leading to placental growth failure, fetal nutrient deficit, and IUGR (23). Fetal hypoglycemia, hypoxemia, and acidosis usually are present in such cases of poor placental development and perfusion. These factors lead to increased production of prostaglandins and the activation of labor-promoting cytokines, leading also to preterm delivery (24). Many of these cases are delivered preterm to protect the mother from eclampsia or the fetus from hypoxic-ischemic injury. Very young and very old women both produce IUGR infants who often are born prematurely. Nutritional, uterine, and vascular mechanisms may be common in these situations. Young still-growing adolescent girls appear less capable of mobilizing fat reserves in late pregnancy, apparently reserving them instead for their own continued development (25). Failure to mobilize such reserves can limit nutrient supply to the fetus and the rate of fetal growth (26). IUGR in cases of maternal smoking and substance abuse may be as a result of reduced placental blood flow, inhibition of uteroplacental vascular development, or direct fetal toxicity.
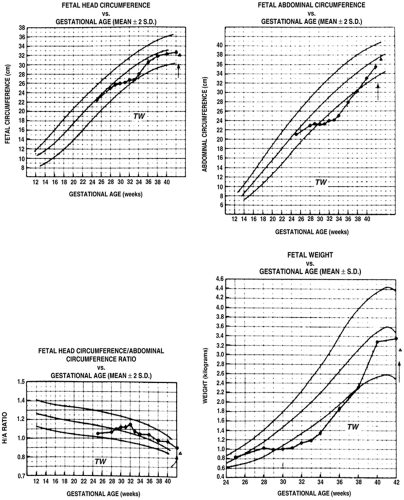 Figure 26-6 Serial fetal body measurements in a mother with severe ulcerative colitis. Note that fetal growth (—•—•—) begins to decrease markedly in mid-gestation but returns to normal following the initiation of central hyperalimentation at approximately 28-30 weeks. Solid lines represent the mean ± 2 S.D. of a reference population of human fetuses with normal fetal growth rates according to ultrasound measurements. Reproduced with permission from Creasy RK, Resnik R. Intrauterine growth retardation. In: Creasy RK, Resnik R, (Editors), Maternal-Fetal Medicine, Second Edition. Philadelphia: W.B. Saunders Co., 1989, p. 558. |
TABLE 26-1 MATERNAL CONDITIONS ASSOCIATED WITH INTRAUTERINE GROWTH RESTRICTION AND PRETERM DELIVERY | |
|---|---|
|
These examples illustrate that IUGR is commonly associated with conditions that also are related to preterm delivery. It is not surprising, therefore, and important to note, that IUGR is an increasingly common finding among infants born at earlier gestational ages. Whereas at term 10% of infants are classified as SGA, at less than 28 to 30 weeks gestational age, 30% to 40% of infants may be the result of IUGR (27).
FETAL GROWTH
The period of fetal growth is from the end of embryogenesis, at about the end of the first third of gestation, until term. During the embryonic period, growth occurs primarily by increased cell number (hyperplasia) (28). In the middle third of gestation, cell size also increases (hypertrophy), although the rate of cell division becomes stable. In the last third of gestation, the rate of cell division declines, although cell size continues to increase. Thus, insults that limit fetal growth in the embryonic period result in global reduction in fetal growth, whereas insults in the third part of gestation usually limit growth of fetal adipose tissue and skeletal muscle with less effect on the growth of other organs, especially the brain and heart (29).
GROWTH OF BODY COMPONENTS IN THE FETUS
Water
Fetal body water content, expressed as a fraction of body weight, decreases over gestation as a result of relative increases in protein and mineral accretion (Fig. 26-7) (30) and in humans because of the development of relatively large amounts of adipose tissue in the third trimester. Fetuses with marked IUGR and SGA neonates who have decreased body fat content have even lower fractional contents of body water. Extracellular water also decreases more than intracellular water as gestation advances, primarily because of increasing cell number and increasing cell size rather than the intracellular concentration of osmotic
substances. Measurements of extracellular space in SGA infants usually are normal for gestational age, as adipose tissue, skeletal muscle, and mineral accretion all are decreased to about the same extent (31).
substances. Measurements of extracellular space in SGA infants usually are normal for gestational age, as adipose tissue, skeletal muscle, and mineral accretion all are decreased to about the same extent (31).
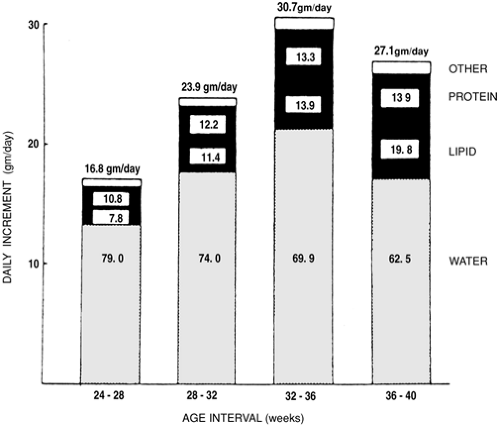 Figure 26-7 Composition of weight gain in normal human fetuses. From Ziegler EE, O’Donnell AM, Nelson SE, et al. Body composition of the reference fetus. Growth 1976;40:329. |
Minerals
Fetal calcium content in SGA and AGA fetuses increases exponentially with a linear increase in length, because bone density, area, and circumference increase exponentially in relation to linear growth (12). Accretion of other minerals varies more directly with body weight and according to the distribution of the minerals into extracellular (e.g., sodium) or intracellular (e.g., potassium) spaces (Table 26-2).
TABLE 26-2 CHEMICAL COMPOSITION OF THE BODY OF THE DEVELOPING FETUSa | |||||||||||||||||||||||||||||||||||||||||||||||||||||||||||||||||||||||||||||||||||||||||||||||||||||||||||||||||||||||||||||||||||||||||||||||||||||||||||||||||||||||||||||||||||||||||||||||||
|---|---|---|---|---|---|---|---|---|---|---|---|---|---|---|---|---|---|---|---|---|---|---|---|---|---|---|---|---|---|---|---|---|---|---|---|---|---|---|---|---|---|---|---|---|---|---|---|---|---|---|---|---|---|---|---|---|---|---|---|---|---|---|---|---|---|---|---|---|---|---|---|---|---|---|---|---|---|---|---|---|---|---|---|---|---|---|---|---|---|---|---|---|---|---|---|---|---|---|---|---|---|---|---|---|---|---|---|---|---|---|---|---|---|---|---|---|---|---|---|---|---|---|---|---|---|---|---|---|---|---|---|---|---|---|---|---|---|---|---|---|---|---|---|---|---|---|---|---|---|---|---|---|---|---|---|---|---|---|---|---|---|---|---|---|---|---|---|---|---|---|---|---|---|---|---|---|---|---|---|---|---|---|---|---|---|---|---|---|---|---|---|---|---|
| |||||||||||||||||||||||||||||||||||||||||||||||||||||||||||||||||||||||||||||||||||||||||||||||||||||||||||||||||||||||||||||||||||||||||||||||||||||||||||||||||||||||||||||||||||||||||||||||||
Nitrogen and Protein
There are very few chemical composition studies of normal human infants. Based on data from 15 studies accounting for 207 infants, Sparks has shown that nonfat dry weight and
nitrogen content (predictors of protein content) have a linear relationship with fetal weight and an exponential relationship with gestational age (Fig. 26-8) (12,32). Table 26-3 shows nitrogen, protein, and selected amino acid composition and accretion rates for normal human fetuses. About 80% of fetal nitrogen content is found in protein; the rest is found in urea, ammonia, and free amino acids. The data for fetal protein content and accretion in Table 26-3 thus may be high, as they are based solely on nitrogen content.
nitrogen content (predictors of protein content) have a linear relationship with fetal weight and an exponential relationship with gestational age (Fig. 26-8) (12,32). Table 26-3 shows nitrogen, protein, and selected amino acid composition and accretion rates for normal human fetuses. About 80% of fetal nitrogen content is found in protein; the rest is found in urea, ammonia, and free amino acids. The data for fetal protein content and accretion in Table 26-3 thus may be high, as they are based solely on nitrogen content.
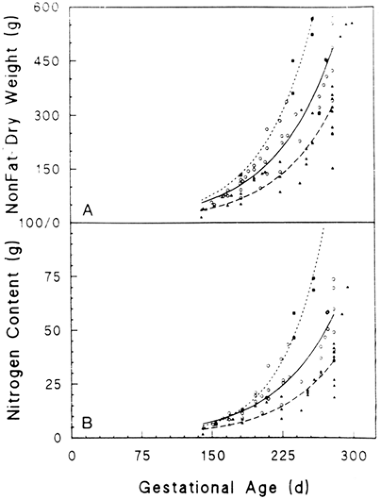 Figure 26-8 Nonfat dry weight (A) and nitrogen content (B) are plotted against gestational age for LGA (□,…), AGA (O,——), and SGA (▼,————) infants. Reproduced with permission from Sparks JW. Intrauterine growth and nutrition. In: Polin RA, Fox WW, (eds.), Fetal and neonatal physiology. Philadelphia: W. B. Saunders Co., 1992:184, with permission. |
Nitrogen and Protein Accretion in Small-for-Gestational-Age Infants
Among SGA infants, nitrogen and protein contents are reduced for body weight, primarily as a result of deficient production of muscle mass. In fact, they often are reduced below that of fat as a fraction of body weight (33).
Glycogen
Many tissues in the fetus, including brain, liver, lung, heart, and skeletal muscle, produce glycogen over the second half of gestation (34). Liver glycogen content, which increases with gestation (Fig. 26-9), is the most important store of carbohydrate for systemic glucose needs, because only the liver contains sufficient glucose-6-phosphatase for release of glucose into the circulation. Skeletal muscle glycogen content increases during late gestation and forms a ready source of glucose for glycolysis within the myocytes. Lung glycogen content decreases in late gestation with change in
cell type, leading to loss of glycogen-containing alveolar epithelium, development of type II pneumocytes, and onset of surfactant production. Cardiac glycogen concentration decreases with gestation, owing to cellular hypertrophy, but cardiac glycogen appears essential for postnatal cardiac energy metabolism and contractile function. Glycogen synthesis rates are low in human fetuses, about 2 mg/d/g of liver, accounting for less than 5% of fetal glucose utilization (35). Net synthesis, degradation, and accumulation rates of fetal glycogen are controlled by the functional states of two enzymes, glycogen synthase, which promotes glycogen formation, and glycogen phosphorylase, which promotes glycogen degradation (34,36,37). The total liver content of these two enzymes is relatively constant over gestation. Their functional states are regulated by hormone and substrate concentrations. For example, insulin acts synergistically with glucose to build hepatic glycogen stores, whereas close to term, cortisol, epinephrine, and glucagon develop the capacity to promote glycogenolysis and glucose release into the plasma.
cell type, leading to loss of glycogen-containing alveolar epithelium, development of type II pneumocytes, and onset of surfactant production. Cardiac glycogen concentration decreases with gestation, owing to cellular hypertrophy, but cardiac glycogen appears essential for postnatal cardiac energy metabolism and contractile function. Glycogen synthesis rates are low in human fetuses, about 2 mg/d/g of liver, accounting for less than 5% of fetal glucose utilization (35). Net synthesis, degradation, and accumulation rates of fetal glycogen are controlled by the functional states of two enzymes, glycogen synthase, which promotes glycogen formation, and glycogen phosphorylase, which promotes glycogen degradation (34,36,37). The total liver content of these two enzymes is relatively constant over gestation. Their functional states are regulated by hormone and substrate concentrations. For example, insulin acts synergistically with glucose to build hepatic glycogen stores, whereas close to term, cortisol, epinephrine, and glucagon develop the capacity to promote glycogenolysis and glucose release into the plasma.
TABLE 26-3 INCREMENTS PER DAY OF NUTRIENTS IN THE FETAL BODY AT SELECTED INTERVALS DURING GESTATIONa | ||||||||||||||||||||||||||||||||||||||||||||||||||||||||||||||||||||||||||||||||||||||||||||||||||||||||||||||||||||||||||||||||||||||||||||||||||||||||||||||||||||||||||||||||
|---|---|---|---|---|---|---|---|---|---|---|---|---|---|---|---|---|---|---|---|---|---|---|---|---|---|---|---|---|---|---|---|---|---|---|---|---|---|---|---|---|---|---|---|---|---|---|---|---|---|---|---|---|---|---|---|---|---|---|---|---|---|---|---|---|---|---|---|---|---|---|---|---|---|---|---|---|---|---|---|---|---|---|---|---|---|---|---|---|---|---|---|---|---|---|---|---|---|---|---|---|---|---|---|---|---|---|---|---|---|---|---|---|---|---|---|---|---|---|---|---|---|---|---|---|---|---|---|---|---|---|---|---|---|---|---|---|---|---|---|---|---|---|---|---|---|---|---|---|---|---|---|---|---|---|---|---|---|---|---|---|---|---|---|---|---|---|---|---|---|---|---|---|---|---|---|---|
| ||||||||||||||||||||||||||||||||||||||||||||||||||||||||||||||||||||||||||||||||||||||||||||||||||||||||||||||||||||||||||||||||||||||||||||||||||||||||||||||||||||||||||||||||
Glycogen Deficiency in Small-for-Gestational-Age Infants
Glycogen content is markedly reduced in SGA infants, both in the liver and in the skeletal muscles (34). This is as a result of lower fetal plasma concentrations of glucose and insulin, which are the principal regulators of glycogen synthesis. If the SGA fetus also experiences repeated episodes of hypoxemia, epinephrine secretion in response will further deplete glycogen by activating glycogen phosphorylase and increasing glycogenolysis.
Adipose Tissue
At term, fetal fat content, expressed as a fraction of fetal weight, varies markedly among species (Fig. 26-10) (37). The fat content of newborns of almost all land mammals at term is 1% to 3%, which is considerably less than the 15% to 20% fat content of human term infants. Even in those species, such as the human, that take up fat from the placenta and deposit fat in fetal tissues, the rate of fetal fatty acid oxidation is presumed low. This condition occurs because plasma concentrations of fatty acids (and keto acid products, such as b-hydroxybutyrate and acetoacetate) are low, and because the carnitine palmityl transferase enzyme system is not sufficiently developed to deliver long-chain fatty acids to the respiration pathway inside the mitochondria. Fat accretion for the human fetus is shown in Fig. 26-11. Between 26 and 30 weeks of gestation, nonfat and fat components contribute equally to the carbon content of the fetal body (12,38). After that period, fat accumulation exceeds that of the nonfat components. By term, the deposition of fat accounts for more than 90% of the carbon accumulated by the fetus. The rate of fat accretion is approximately linear between 36 and 40 weeks of gestation, and, by the end of gestation, fat accretion ranges between 1.6 and 3.4 g/d/kg. At 28 weeks of gestation, it is slightly less and ranges between 1.0 and 1.8 g/d/kg.
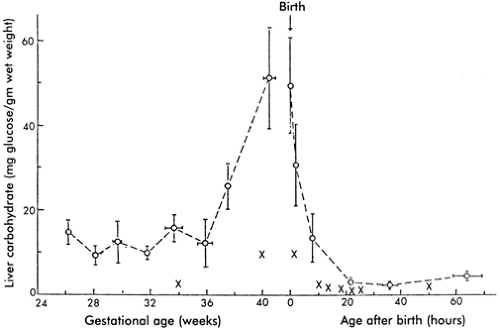 Figure 26-9 Liver glycogen content (as carbohydrate) in normal human fetuses and newborn infants with normal birth weights for gestational age (O ——— O, mean ± SEM) and infants of low birth weight for gestational age (X). From Shelley HJ, Neligan GA. Neonatal hypoglycaemia. Br Med Bull 1966;22:34, with permission. |
Adipose Tissue Deficiency in Small-for-Gestational-Age Infants
By term, fat content in human fetuses with IUGR may be less than 10% of body weight (33). In these cases, the smaller placenta limits fetal fatty acid and triglyceride supply. Similarly, the smaller placenta decreases fetal glucose supply, which reduces glycerol production and triglyceride synthesis. Insulin deficiency, a result of decreased glucose and amino acid supply to the fetus, also limits fat synthesis. The insulin activation of peripheral lipoprotein lipase is thereby reduced, which normally is necessary to release fatty acids from circulating lipoproteins for adipocyte uptake and triglyceride synthesis, and to decrease the normal insulin stimulation of fatty acid synthase within adipocytes.
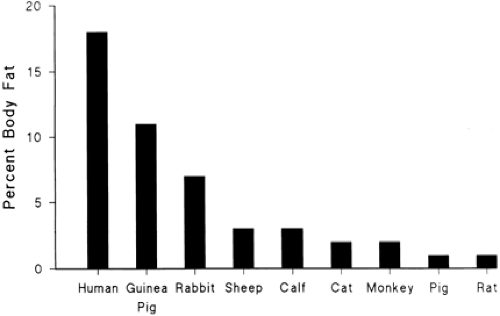 Figure 26-10 Fetal fat content at term as a percent of fetal body weight among species. Reproduced with permission from Hay WW Jr. Nutrition and development of the fetus: carbohydrate and lipid metabolism. In Walker WA, Watkins JB (Editors), Nutrition in Pediatrics, Second Edition. Hamilton: BC Decker, 1966, p. 376, with permission. |
Calories (Total Energy Storage)
The energy value of various tissue components is shown in Table 26-4. Fat has a high energy content, 9.5 kcal/g, and a very high carbon content, approximately 78%. Thus, differences in fetal fat concentration lead to large differences in calculated caloric accretion rates and carbon requirements of the fetal tissues for growth. The caloric concentration of nonfat dry weight is fairly consistent at different developmental stages, indicating that the ratio of protein to nonprotein substrates in the tissues is relatively constant (Table 26-5). Thus, caloric accretion rate of any fetus can be estimated from the growth curve of the fetus and the changing fat and water concentrations (38).
Caloric Accretion Deficiency in Small-for-Gestational-Age Infants
Growth of fat and nonfat (protein plus other) tissues is metabolically linked through energy supply that is used for protein synthesis and the production of anabolic hormones (39). These promote positive protein, fat, and carbohydrate growth. Thus, restriction of nutrient supply is likely to produce growth deficits of all tissues, not just fat. Indeed, growth restriction involves limitation of muscle growth and fat and glycogen (33). For example, chronic selective caloric (glucose) restriction in the experimental fetal sheep model leads to increased protein breakdown and lower rates of fetal growth and lipid content (40). Some growth curves, such as those shown in Figs. 26-8 and 26-11 from human
infants born prematurely at different times over the last third of gestation, show a bias toward thinner SGA infants with less fat relative to nonfat weight and nitrogen content (32). These infants, however, were stillborn and may have suffered extensive wasting and IUGR. Other studies have shown that human SGA infants can be markedly deficient in muscle mass, even more than for fat (33,41).
infants born prematurely at different times over the last third of gestation, show a bias toward thinner SGA infants with less fat relative to nonfat weight and nitrogen content (32). These infants, however, were stillborn and may have suffered extensive wasting and IUGR. Other studies have shown that human SGA infants can be markedly deficient in muscle mass, even more than for fat (33,41).
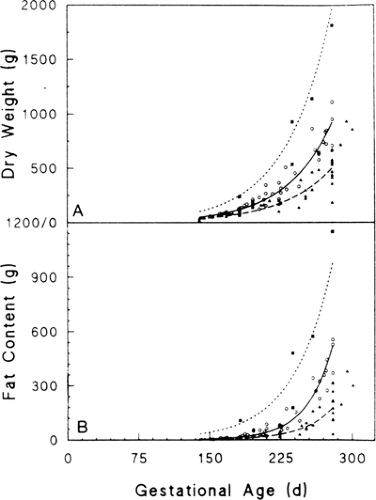 Figure 26-11 Dry weight (A) and fat content (B) plotted against gestational age in the same newborn human infants shown in Fig. 26-8 for LGA (▪,…), AGA (O, ———), and SGA (▼, ————) infants. Reproduced with permission from Sparks JW. Intrauterine growth and nutrition. In: Polin RA, Fox WW, (eds.), Fetal and neonatal physiology. Philadelphia: W. B. Saunders Co., 1992:184, with permission. |
REGULATION OF FETAL GROWTH
Fetal growth is regulated by maternal, placental, and fetal factors, representing a mix of genetic mechanisms and environmental influences through which genetic growth potential is expressed and modulated.
Epidemiologic Considerations
The major maternal risk factors for IUGR that vary among populations and among individuals within populations include small maternal size (height and prepregnancy weight) and low maternal weight gain during pregnancy. Low maternal body mass index (the degree of thinness or fatness, defined as [weight (kg)]/[height (cm)]2) is a major predicator of IUGR. This characteristic interacts with other risk factors, such as diet, smoking, illnesses, and so forth, to affect fetal growth, especially in thin women. For example, smoking has only half the impact on fetal growth in obese vs. thin women, and in black vs. white women (42). Low blood pressure has a detrimental impact on fetal growth, mostly in thin women (43). Moderate obesity,
therefore, protects against most growth-inhibiting risk factors except for black race and female gender. This pattern also holds for certain therapies. For example, zinc supplementation has a major impact on fetal growth in black women who have relatively low plasma zinc levels early in pregnancy, with all of the impact occurring in relatively thin women (44). Also, low-dose maternal aspirin treatment has been shown to improve fetal growth primarily in thin women (45).
therefore, protects against most growth-inhibiting risk factors except for black race and female gender. This pattern also holds for certain therapies. For example, zinc supplementation has a major impact on fetal growth in black women who have relatively low plasma zinc levels early in pregnancy, with all of the impact occurring in relatively thin women (44). Also, low-dose maternal aspirin treatment has been shown to improve fetal growth primarily in thin women (45).
TABLE 26-4 ENERGY VALUE OF HUMAN TISSUE COMPONENTSb | ||||||||||||||||||||||||
|---|---|---|---|---|---|---|---|---|---|---|---|---|---|---|---|---|---|---|---|---|---|---|---|---|
| ||||||||||||||||||||||||
Genetic Factors
Many genes contribute to fetal growth. Table 26-6 lists estimates of the quantitative contribution of fetal and parental factors to fetal growth and birth weight at term. Maternal genotype is more important than fetal genotype in the overall regulation of fetal growth. However, the paternal genotype is essential for trophoblast development, which secondarily regulates fetal growth by the provision of nutrients. More specific gene targeting studies have shown the importance of genomic imprinting on fetal growth. For example, normal fetal and placental growth in mice require that the IGF-II gene be paternal and the IGF-II receptor gene be maternal, whereas maternal disomy producing IGF-II under- expression results in fetal dwarfism (39).
TABLE 26-5 CALCULATION OF THE CALORIC DISTRIBUTION IN THE TERM HUMAN INFANTa | |||||||||||||||||||||||||
|---|---|---|---|---|---|---|---|---|---|---|---|---|---|---|---|---|---|---|---|---|---|---|---|---|---|
| |||||||||||||||||||||||||
| ||||||||||||||||||||||||||||
Nongenetic Maternal Factors
Under usual conditions, fetal growth follows its genetic potential, unless the mother is unusually small and limits fetal growth by a variety of factors considered collectively as “maternal constraint.” Maternal constraint represents a relatively limited uterine size, including placental implantation surface area and uterine circulation, and thus the capacity to support placental growth and nutrient supply to the fetus. A clear example of maternal constraint is the reduced rate of fetal growth of multiple fetuses in a species—human—that optimally supports only one fetus (Fig. 26-12). Obviously, small fetuses of small parents do not reflect fetal growth restriction; in fact, their rates of growth are normal for their genome and for the size of the mother. Unless maternal constraint is particularly prominent, such fetuses would not grow faster or to a larger size if more nutrients were provided, although they might grow somewhat larger if the maternal uterine endometrial surface area, and thus placental implantation and growth area, were increased. The nongenetic, maternal nature of this effect has been demonstrated by embryo transfer and cross-breeding experiments (29). For example, a small-breed embryo transplanted into a large-breed uterus will grow larger than a small-breed embryo remaining in a small-breed uterus. Furthermore, partial reduction in fetal number in a polytocous species, such as the rat, produces greater than normal birth weights in the remaining offspring. Conversely, embryo transfer of a large-breed embryo into a small-breed uterus will result in a newborn that is smaller than in its natural large-breed environment. Such
evidence supports the concept that fetal growth is normally constrained, and this constraint comes from the maternal environment, i.e., the size of the uterus.
evidence supports the concept that fetal growth is normally constrained, and this constraint comes from the maternal environment, i.e., the size of the uterus.
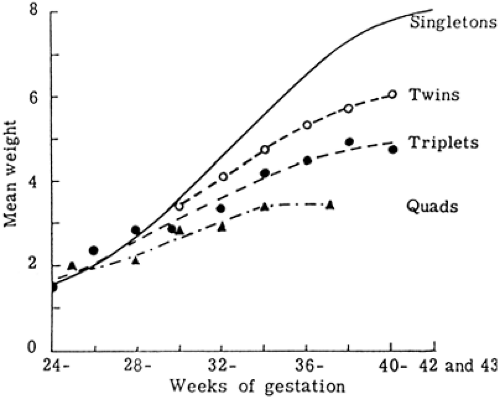 Figure 26-12 Mean birth weight of single and multiple human fetuses related to duration of gestation. Adapted from McKeown T, Record RG. Observation on foetal growth in multiple pregnancy in man. J Endocrinol 1952;8:386, with permission. |
Maternal Nutrition
The single most important environmental influence that affects fetal growth is the nutrition of the fetus. Normal variations in maternal nutrition, however, have relatively little impact on fetal growth and the severity of IUGR. This is because changes in maternal nutrition, unless extreme and prolonged, do not markedly alter maternal plasma concentrations of nutrient substrates or the rate of uterine blood flow, the principal determinants of nutrient substrate delivery and transport to the fetus by the placenta (46). Human epidemiologic data from conditions of prolonged starvation, and nutritional deprivation in experimental animals, indicate that severe limitations in maternal nutrition limit fetal growth only by 10% to 20%. Epidemiologic data from the Dutch during the Hunger Winter of 1944 showed an average reduction in fetal weight at term of 300 g (47), whereas birth weight at term was reduced by 500 g in women who suffered a more severe and prolonged famine in wartime Leningrad (48). Interestingly, second-generation daughters of women who suffered extreme nutritional deficit during gestation in turn tend to produce SGA infants who are 200 to 300 g less than normal at term with their first pregnancies (49). However, attempts to limit weight gain in pregnancy with a 1,200-kcal diet (50% of what is now recommended to prevent preeclampsia) increased the incidence of fetal growth restriction up to tenfold (50). Restrictions of calorie and protein intakes to less than 50% of normal for a considerable portion of gestation are needed before marked reductions in fetal growth are observed. Such severe conditions often result in fetal loss before the impact of fetal growth rate in late gestation and fetal size at birth are manifested.
Attempts to increase fetal weight gain with maternal nutritional supplements have produced mixed results. Higher caloric feeding usually increases fetal adiposity, not growth of muscle mass or gain in length or head circumference. In contrast, high protein supplements tend to produce delayed fetal growth (51). Mechanisms responsible for this phenomenon are not known.
Maternal Chronic Diseases
Chronic hypertension, pregnancy-induced hypertension, and preeclampsia, like other vascular disorders including severe and long-standing diabetes mellitus and serious autoimmune disease associated with the lupus anticoagulant, have a common effect of limiting trophoblast invasion, placental growth and development, uteroplacental blood flow, and fetal oxygen and nutrient deficiency (52). Maternal cyanotic congenital heart disease can limit fetal oxygen supply, which can limit fetal growth (53). High-altitude hypoxia also can limit fetal growth (54), but usually this is only clinically significant for nonindigenous women who move to altitudes above 10,000 feet. Severe sickle cell crises can damage uterine vasculature, leading to placental growth and transport capacities (55).
Maternal Drugs
Specific effects of drugs on fetal growth (Table 26-7) are often difficult to sort out clinically, as many women who abuse drugs do so with many drugs taken intermittently, at different doses, and at different periods of fetal vulnerability. These women also frequently suffer from other disorders
that could lead to poor fetal growth, such as poor nutrition, recurrent acute illnesses, and chronic diseases (56). Fetal growth restriction does appear to be a major part of the fetal alcohol syndrome. It is not clear when during gestation the specific effects of alcohol on fetal growth rate occur. Alcohol may exert its nonteratogenic effects by limiting placental-to-fetal amino acid transport (57). Cocaine probably exerts its primary effects on producing fetal growth restriction by causing uterine and perhaps umbilical vasoconstriction and reduced placental perfusion (58). The most consistent drug reducing fetal growth is cigarette smoking (41). Deficits of at least 300 g (about 10% of normal term weight) are not uncommon. A likely common mechanisms is the effect of nicotine, and of catecholamines released in response, to constrict the uterine and perhaps the umbilical vasculature, reducing placental perfusion. Carbon monoxide, cyanide, and other cellular toxins may limit oxygen transport to fetal tissues and cellular respiration.
that could lead to poor fetal growth, such as poor nutrition, recurrent acute illnesses, and chronic diseases (56). Fetal growth restriction does appear to be a major part of the fetal alcohol syndrome. It is not clear when during gestation the specific effects of alcohol on fetal growth rate occur. Alcohol may exert its nonteratogenic effects by limiting placental-to-fetal amino acid transport (57). Cocaine probably exerts its primary effects on producing fetal growth restriction by causing uterine and perhaps umbilical vasoconstriction and reduced placental perfusion (58). The most consistent drug reducing fetal growth is cigarette smoking (41). Deficits of at least 300 g (about 10% of normal term weight) are not uncommon. A likely common mechanisms is the effect of nicotine, and of catecholamines released in response, to constrict the uterine and perhaps the umbilical vasculature, reducing placental perfusion. Carbon monoxide, cyanide, and other cellular toxins may limit oxygen transport to fetal tissues and cellular respiration.
TABLE 26-7 DRUGS ASSOCIATED WITH INTRAUTERINE GROWTH RESTRICTION | |
|---|---|
|
Placenta
The size of the placenta and its directly related nutrient transport functions are the principal regulators of nutrient supply to the fetus and thus the rate of fetal growth (36). Nearly all cases of IUGR are associated with a smaller-than-normal placenta. Figure 26-13 shows a direct relationship between fetal weight and placental weight in humans, demonstrating that LGA, AGA, and SGA infants are directly associated with LGA, AGA, and SGA placentas (59). Placental growth normally precedes fetal growth, and failure of placental growth is directly associated with decreased fetal growth. Variable limitations in placental nutrient transfer capacity modulate this primary effect of placental size on fetal growth. In some cases of experimentally reduced placental size, for example, fetal weight is not reduced proportionately (60). This indicates that either the capacity of the smaller placenta to transport nutrients to the fetus increases adaptively or the fetus develops increased capacity to grow. More characteristically, though, fetal growth fails first, or in direct relation to decreased nutrient supply. With primary fetal growth failure, placental growth can increase disproportionately, resulting in a larger than normal placental-to-fetal weight ratio for gestational age. This is characteristically seen under chronic hypoxic conditions of high altitude exposure or maternal anemia and has been seen in certain experimental situations of maternal undernutrition in early gestation (61). A variety of placental pathologic conditions are associated with IUGR (Table 26-8). In most of these cases, the placenta is simply smaller than normal. In many, there also is abnormal trophoblast development, including abnormal vascular growth in the trophoblast villi, frequently associated with limited uterine vascular perfusion of the intervillous spaces.
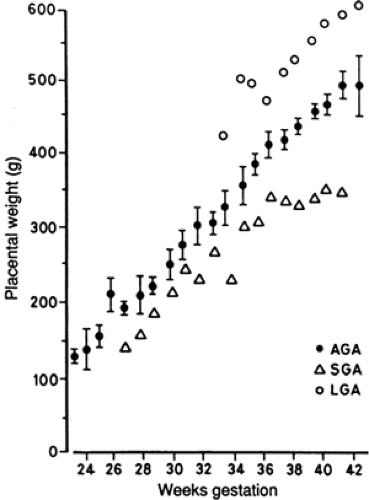 Figure 26-13 Mean placental weights for large-for-gestational-age (O), average-for-gestational-age (•), and small-for-gestational-age (Δ) human infants at each gestational age. ± SEM given for AGA infants alone. From Molteni RA, Stys SJ, Battaglia FC. Relationship of fetal and placental weight in human beings: fetal/placental weight ratios at various gestational ages and birth weight distributions. J Reprod Med 1978;21:327, with permission. |
Placental and fetal growth both depend on an adequate supply of maternal blood to the placenta. IUGR is associated with inadequate development of the uteroplacental circulation, and radioisotope studies have demonstrated more than a twofold blood flow reduction in
comparison with normal pregnancies (62). IUGR in the second half of gestation is due primarily to a failure of the normal villous vascular tree, mainly in the phase of nonbranching angiogenesis, because terminal villi are critical for oxygen and nutrient transport to the fetus (63). This angiogenesis in turn depends on cytotrophoblast invasion of the uterus and its arterioles. Cytotrophoblast invasion is actually a differentiation process whereby the cells lose the ability to proliferate and modulate their expression of state-specific antigens. These antigens include members of the integrin family of cell-extracellular matrix receptors that are required for migration and invasion of the endometrium and decidua of the uterus (64). Preeclampsia, which is associated with IUGR, is characterized by shallow cytotrophoblast invasion (65). Abnormal cytotrophoblast differentiation also occurs, evidenced by the cells’ inability to switch on their integrin repertoire (66). The same observations have been made on cultured normal cytotrophoblast cells in a hypoxic environment (67). These in vitro results indicate that whatever leads to hypoxia of the invading cytotrophoblast cells increases cytotrophoblast proliferation over differentiation and invasion, thus setting the stage for deficient placental development that can result in deficient nutrient and growth factor supply to the fetus, producing fetal growth restriction.
comparison with normal pregnancies (62). IUGR in the second half of gestation is due primarily to a failure of the normal villous vascular tree, mainly in the phase of nonbranching angiogenesis, because terminal villi are critical for oxygen and nutrient transport to the fetus (63). This angiogenesis in turn depends on cytotrophoblast invasion of the uterus and its arterioles. Cytotrophoblast invasion is actually a differentiation process whereby the cells lose the ability to proliferate and modulate their expression of state-specific antigens. These antigens include members of the integrin family of cell-extracellular matrix receptors that are required for migration and invasion of the endometrium and decidua of the uterus (64). Preeclampsia, which is associated with IUGR, is characterized by shallow cytotrophoblast invasion (65). Abnormal cytotrophoblast differentiation also occurs, evidenced by the cells’ inability to switch on their integrin repertoire (66). The same observations have been made on cultured normal cytotrophoblast cells in a hypoxic environment (67). These in vitro results indicate that whatever leads to hypoxia of the invading cytotrophoblast cells increases cytotrophoblast proliferation over differentiation and invasion, thus setting the stage for deficient placental development that can result in deficient nutrient and growth factor supply to the fetus, producing fetal growth restriction.
Stay updated, free articles. Join our Telegram channel

Full access? Get Clinical Tree


