Immunosuppressive and Immunomodulatory Drugs
Amrish Jain
Rudolph P. Valentini
Tej K. Mattoo
Scott A. Gruber
Introduction
Organ transplantation has been performed successfully in infants, children, and adolescents for over four decades and is the standard of care for end-stage organ disease. In many centers across the world, increasing numbers of kidney, heart, liver, and other solid-organ transplants are being performed. The goal of organ transplantation has been to achieve long-term graft outcome. This has been possible as a result of major advances in understanding of immunobiology and use of novel immunosuppressive and immunomodulatory drug regimens. To understand the basis of immunosuppressive protocols and rationalize current transplantation practices, a brief history of transplant immunosuppression is provided.
Historical Overview
Major advances in immunosuppressive therapy can be related to a surge in the interest in organ transplantation after World War II. Alexis Carrel made the early observation that allografts were quickly destroyed, whereas autotransplants maintained long-term graft function. He surmised that allograft loss was due to biologic phenomena rather than technical problems (1). Modern transplant immunology developed in the 1940s with Gibson and Medawar’s work established an immune basis for graft rejection and the need for immunosuppressive therapy (2). Initial efforts at immunosuppression with total body irradiation yielded very poor results. In 1954, the first successful live-donor kidney transplant was performed between identical twins by Murray et al. (3).
The era of drug therapy for immunosuppression was launched after Schwartz and Dameshek (4) demonstrated drug-assisted deletional tolerance using 6-mercaptopurine in 1959. Its analogue, azathioprine (AZA), in combination with corticosteroids, formed the mainstay of early immunosuppressive protocols in the 1960s. The addition of polyclonal antibodies in the 1970s marked the introduction of biologic agents (5). Much of the current success of organ transplantation can be attributed to discovery of the potent immunosuppressive agent cyclosporin A (CsA) by Borel in 1972 (6,7). The widespread clinical use of CsA in the early 1980s increased 1-year renal graft survival from about 50% to more than 80%. OKT3, the first monoclonal antibody (MAb) to be used in clinical transplantation, gained widespread acceptance despite its side effects in the mid 1980s as an adjunct to CsA, AZA, and prednisone (PRED). In the 1990s, the immunosuppressive armamentarium expanded rapidly with addition of mycophenolate mofetil (MMF), tacrolimus (TAC), and murine as well as humanized interleukin-2 receptor (IL-2R) MAbs. In 1999, sirolimus (SRL) was introduced and in the 21st century, it became a rescue agent in patients with calcineurin inhibitor-induced nephrotoxicity. Table 45.1 summarizes the major historical landmarks in transplant immunosuppression over the past several decades.
Advances in the pharmacology of these drugs, along with widespread use of therapeutic drug monitoring (TDM), has resulted in increased antirejection efficacy and reduced toxicity while ensuring high graft survival rates and overall improvements in the quality of life for transplant recipients. The current decade has focused on adding novel biologic agents to the armamentarium to achieve improved long-term graft survival. On the other hand, the concept of tolerance or near tolerance is fast emerging. Now, the goal of transplantation is to achieve a state where the graft continues to function well with minimal immunosuppression and avoid posttransplant infections, malignancies, and increased cardiovascular risk. Thus, achieving a balance between over- and under-immunosuppression has become the goal of organ transplantation.
Pediatric solid-organ transplants constituted only 7.0% of the 27,963 transplants performed in the United States in 2008 (8). The recent USRDS data documents a fourfold increase in the transplant prevalence rate in pediatric renal transplant recipients since 1980 (9). Hence, more data are now becoming available on the pharmacology of immunosuppressants in children. However, for newer therapies, few studies exist and only limited data are available in the pediatric population. Although many drugs
have immunosuppressive properties, this chapter will focus on those agents primarily used as immunosuppressants for organ transplantation in children. A detailed discussion of the pharmacology of other drugs that may also have immunosuppressive and immunomodulatory properties, such as chemotherapeutic agents and biologicals, can be found in other sections of this book.
have immunosuppressive properties, this chapter will focus on those agents primarily used as immunosuppressants for organ transplantation in children. A detailed discussion of the pharmacology of other drugs that may also have immunosuppressive and immunomodulatory properties, such as chemotherapeutic agents and biologicals, can be found in other sections of this book.
Table 45.1 Landmarks in Each Decade in the History of Transplant Immunosuppression | ||||||||||||||||||||
|---|---|---|---|---|---|---|---|---|---|---|---|---|---|---|---|---|---|---|---|---|
|
Classification
The immunosuppressive and immunomodulatory drugs can be pharmacologically categorized on the basis of their mechanism of action. The three-signal model of T-cell activity and proliferation is helpful in understanding the molecular mechanisms and site of action of various immunosuppressive drugs (10). Signal 1 features antigen-presenting cells (APCs; macrophages and dendritic cells) presenting the foreign antigen to the T lymphocyte, activating the T-cell receptor (TCR), which further relays the signal through the transduction apparatus known as the CD3 complex. Signal 2 is a nonantigen-specific costimulatory signal which occurs as a result of binding of the B7 molecule on the APC to CD28 on the T cell. Both signal 1 and signal 2 activate signal transduction pathways: the calcium–calcineurin pathway, mitogen-activated protein (MAP) pathway, and the nuclear factor-κB (NF-κB) pathway. This in turn leads to increased expression of interleukin-2 (IL-2), which through its receptor (IL-2R) activates the cell cycle (signal 3). Signal 3 activation requires the enzyme target of rapamycin for translation of mRNA and cell proliferation. Thus, various drugs act on different cellular signals and achieve immunosuppression by a number of mechanisms: depleting lymphocytes, diverting lymphocyte traffic, or blocking lymphocyte response pathways. Table 45.2 lists the immunosuppressive drugs and their mechanism of action. Figures 45.1 and 45.2 depict a schematic representation of the three-signal model along with the site of action of common immunosuppressive drugs.
Table 45.2 Immunosuppressive Agents Categorized According to Mechanism of Action | ||||||||||||||||||||||||||||
|---|---|---|---|---|---|---|---|---|---|---|---|---|---|---|---|---|---|---|---|---|---|---|---|---|---|---|---|---|
|
Immunosuppressive agents are also classified on the basis of the phase of transplantation for which they are used (Table 45.3). Different immunosuppressive drugs are used for induction versus maintenance of immunosuppression, while others may be used for the treatment and reversal of graft rejection. The commonly used agents in immunosuppressive protocols are discussed in greater detail in the following section.
Calcineurin Inhibitors
Introduction
The two drugs in the class of calcineurin inhibitors (CIs), CsA and TAC, form the backbone of current immunosuppressive protocols (Table 45.2). They share a common
mechanism of action, although they differ markedly in their biochemical structure and properties. CsA revolutionized immunosuppressive therapy for solid-organ transplantation after the Food and Drug Administration (FDA) approved it in 1983. Before the introduction of CsA, there was a failure rate of 50% of renal grafts by 1 year as compared with 80% 1-year graft survival following its incorporation into most immunosuppressive protocols (11). TAC, which came into use in the 1990s, is 10 to 100 times more potent on a molar basis, and has increased antirejection efficacy and a slightly different side-effect profile when compared with CsA (12). TAC was used initially in liver transplantation and subsequently in renal transplantation. Currently, the vast majority of the renal, liver, and pancreas transplants, and virtually all small bowel transplants, are being performed using TAC-based protocols.
mechanism of action, although they differ markedly in their biochemical structure and properties. CsA revolutionized immunosuppressive therapy for solid-organ transplantation after the Food and Drug Administration (FDA) approved it in 1983. Before the introduction of CsA, there was a failure rate of 50% of renal grafts by 1 year as compared with 80% 1-year graft survival following its incorporation into most immunosuppressive protocols (11). TAC, which came into use in the 1990s, is 10 to 100 times more potent on a molar basis, and has increased antirejection efficacy and a slightly different side-effect profile when compared with CsA (12). TAC was used initially in liver transplantation and subsequently in renal transplantation. Currently, the vast majority of the renal, liver, and pancreas transplants, and virtually all small bowel transplants, are being performed using TAC-based protocols.
Table 45.3 Immunosuppressive Agents Categorized According to Phase of Immunosuppression | ||||||||||||||||||||||||||||||
|---|---|---|---|---|---|---|---|---|---|---|---|---|---|---|---|---|---|---|---|---|---|---|---|---|---|---|---|---|---|---|
|
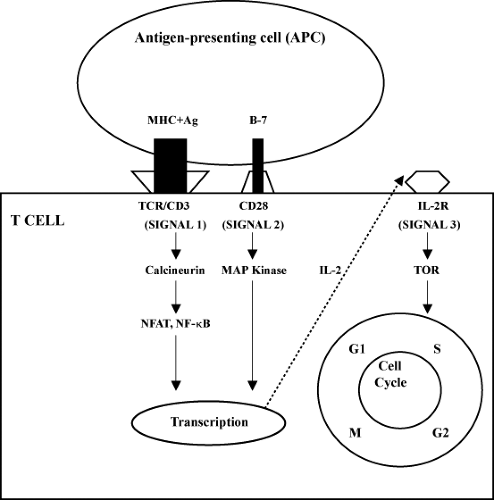 Figure 45.1. The three-signal model in T-cell activation of immunosuppressive agents. APC, antigen-presenting cell; IL-2R, interleukin-2 receptor; MAP kinase, mitogen-activated protein kinase; MHC, major histocompatibility complex; NFAT, nuclear factor of activated T cell; NF-κB, nuclear factor-κB; TCR, T-cell receptor; TOR, target of rapamycin. |
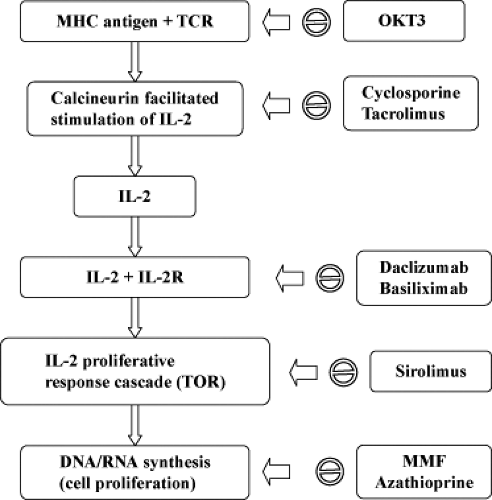 Figure 45.2. Site of action of common immunosuppressive agents. MHC, major histocompatibility complex; MMF, mycophenolate mofetil; TCR, T-cell receptor; TOR, target of rapamycin. |
Chemistry
CsA is a nonpolar, hydrophobic, small cyclic polypeptide antibiotic produced by the fungi Beauveria nivea (formerly
Tolypocladium inflatum Gams or Trichoderma polysporum) and Cylindrocarpon lucidum Booth. It has a molecular weight of 1,203 with 11 amino acids. Amino acids at the 1, 2, 3, and 11 positions form the active site, and its cyclic structure is critical for immunosuppression. TAC is a macrolide antibiotic with limited antimicrobial activity that is derived from the fungus Streptomyces tsukubaensis, originally isolated from a soil sample taken from the base of Mount Tsukuba in Japan.
Tolypocladium inflatum Gams or Trichoderma polysporum) and Cylindrocarpon lucidum Booth. It has a molecular weight of 1,203 with 11 amino acids. Amino acids at the 1, 2, 3, and 11 positions form the active site, and its cyclic structure is critical for immunosuppression. TAC is a macrolide antibiotic with limited antimicrobial activity that is derived from the fungus Streptomyces tsukubaensis, originally isolated from a soil sample taken from the base of Mount Tsukuba in Japan.
Mechanism of Action and Pharmacologic Effects
T cells are stimulated by binding of an antigen to the TCR–CD3 complex (signal 1; Fig. 45.1). This leads to intracellular release of Ca2+, and causes Ca2+/calmodulin-dependent activation of calcineurin, a serine/threonine phosphatase. The phosphatase activity of calcineurin is crucial to the dephosphorylation of a nuclear regulatory protein known as the nuclear factor of activated T cells, which allows it to translocate into the nucleus and activate, directly or indirectly, transcription of genes encoding critical cytokines important in initiating the immune response, including IL-2, IL-4, interferon-#979; (IFN-#979;), and tumor necrosis factor α (TNF-α) (13,14).
Despite differences in molecular structure, both CsA and TAC bind to ubiquitous cytosolic proteins called “immunophilins.” CsA binds to cyclophilin, and TAC, previously known as FK506, binds to the FK-binding protein FKBP12. These drug–immunophilin complexes bind to a calcineurin–calmodulin–calcium complex resulting in noncompetitive inhibition of calcineurin’s phosphatase activity, thereby blocking the immune response. IL-2 is the most important T-cell growth factor and acts in an autocrine as well as paracrine fashion (13,14). Thus, as a result of calcineurin inhibition, there is marked decrease in IL-2 production and downstream lymphocyte proliferation. Since T cells contain relatively low levels of calcineurin, CIs are potent and selective inhibitors of T-cell activation. At therapeutic drug levels, calcineurin activity is reduced by about 50% (15). Although TAC is 10- to 100-fold more active than CsA on a molecular level, TAC does not inhibit secondary proliferation of activated T cells in response to IL-2 (12,16). It also does not appear to modify mononuclear phagocyte or natural killer cell function (16).
Other well-described effects of CsA include increased transforming growth factor β (TGF-β) production, sympathetic activation, vasoconstriction, increased plasma endothelin-1 levels, and upregulation of angiotensin-II receptors on vascular smooth muscle. These actions may explain some of the side effects of the drug, such as hypertension. Enhancement of TGF-β expression may contribute not only to immunosuppressive activity but also to renal interstitial fibrosis (17) and development of posttransplant neoplasias.
Pharmacokinetics
The pharmacokinetics of both CsA and TAC are characterized by high inter- and intraindividual variability and a narrow therapeutic index. Thus, close TDM is essential to identify under-immunosuppression resulting in graft failure as well as over-immunosuppression leading to toxicity, infections, and/or malignancy.
Absorption
CsA is primarily absorbed from the upper small intestine, with no apparent absorption from the colon (18). The original oil-based formulation of CsA (Sandimmune; Sandoz, Basel, Switzerland) was approved by the FDA in 1983 and was characterized by wide inter- and intrapatient variation in its bioavailability, especially in young children. The absorption of oral Sandimmune is highly bile dependent, and thus absorption is unpredictable in patients with liver transplant, cholestasis, biliary disorder, diarrhea, and malabsorption. A microemulsion formulation (Neoral; Novartis, Basel, Switzerland) was approved in 1995 because of its better absorption profile, since it is less dependent on bile, food, or other factors for its dispersion. Food tends to increase the absorption of CsA and its bioavailability also increases with time posttransplant, possibly because of improved absorption from nonuremic gut in the posttransplant period. Bowel length, interaction with other drugs, presystemic metabolism in the gut wall, and type of transplant are all contributing factors to the variation of bio-availability patterns in pediatric transplant patients.
Bioavailability of oral preparations averages 30% to 45%; hence, a 1:3 ratio is used to convert intravenous to oral dosing. Time to peak blood concentration (Tmax) ranges between 1 and 4 hours depending on the formulation, patient age, transplant type, and time after transplant. In general, Neoral shows a faster peak and greater area under the curve (AUC) when compared with Sandimmune. In children with a renal transplant, a 70% increase in AUC and 92% increase in peak cyclosporine level (Cmax) were observed following 1:1 conversion from Sandimmune to Neoral (19). Similar patterns have also been observed in pediatric liver transplant recipients (20).
Distribution
CsA is widely distributed to tissues outside the intravascular space. In the blood, up to 50% of the drug is in erythrocytes, about 40% is in plasma, and the rest is in other cells (21). Plasma CsA is 90% protein bound, mostly to low-density lipoproteins (21). The binding of low-density lipoprotein receptor with CsA is implicated as a cause of hyperlipidemia in transplant patients. On the other hand, lipoprotein binding is important for transfer of CsA across plasma membranes, and toxic effects may be reduced by lowering cholesterol levels. The volume of distribution (Vd) of CsA is 3 to 5 L per kg (21) and does not appear to differ between pediatric and adult transplant recipients. However, systemic clearance is comparatively higher in the pediatric population, with the highest clearance being in infants (22). The half-life of parent drug is approximately 8 hours.
Metabolism
CsA is extensively metabolized by the cytochrome P450 3A4 (CYP3A4)
system in the liver, and to some extent in the gastrointestinal tract and kidneys. The intestinal CYP3A4 and P-glycoprotein, a drug efflux pump on the luminal surface of the intestinal epithelium, are responsible for first-pass metabolism (23,24). Marked interindividual and ethnic differences in activity of these enzyme systems, due to genetic polymorphisms, account for reduced and variable oral absorption (25).
system in the liver, and to some extent in the gastrointestinal tract and kidneys. The intestinal CYP3A4 and P-glycoprotein, a drug efflux pump on the luminal surface of the intestinal epithelium, are responsible for first-pass metabolism (23,24). Marked interindividual and ethnic differences in activity of these enzyme systems, due to genetic polymorphisms, account for reduced and variable oral absorption (25).
The liver is the primary site of drug metabolism, but gastrointestinal metabolism may contribute up to half of CsA metabolism. CsA may be metabolized to more than 25 compounds, although most of the immunosuppressive activity and toxicity is attributable to the parent drug. Some CsA metabolites may have nephrotoxic and immunosuppressive potential, and one of the metabolites, M17, exhibits plasma levels similar to the parent compound. Excretion is primarily via the biliary route, and only about 6% of the dose is excreted in the urine (21). In cases of renal dysfunction, the dose does not require modification. Also, CsA is not dialyzable and can be given during dialysis without dose modification. CsA crosses the placenta and is distributed in mother’s milk, but it does not cross the blood–brain barrier.
Dosing
The usual initial oral dose of CsA is 8 to 12 mg per kg per day, given in two to three divided doses during the induction phase, with target trough levels of 150 to 300 ng per mL. Higher doses are needed in the immediate posttransplant period to maintain higher blood levels (see later discussion) in the face of decreased absorption, which im-proves with time. Some authors recommend 300 mg per m2 daily dose in children, with whole-blood concentrations within the range of 150 to 250 ng per mL for the first 6 weeks and 100 to 200 ng per mL thereafter (26). In general, pediatric patients require higher doses of CsA per kilogram of body weight to achieve target whole-blood concentrations of drug equivalent to that used in the adults. Younger patients (<8 years of age) may be managed more effectively with a thrice-daily administration schedule rather than the conventional twice-daily dosing used in the older pediatric and adult transplant populations (22). The comparatively higher doses and more frequent administration schedule used in pediatric transplant recipients are a consequence of age-related differences in bioavailability and increased metabolic clearance of the drug in younger patients (22). Several generic formulations of CsA are now available that have been deemed bioequivalent to Neoral by the FDA. However, bioavailability may vary, and more frequent TDM is recommended when switching between different formulations.
TAC shares many pharmacokinetic features with CsA but has its own unique characteristics as well. TAC is rapidly absorbed from the small intestine, when administered orally. Peak levels are reached within 1 to 2 hours, unlike CsA which may take 1 to 4 hours (27). Unlike Sandimmune, its absorption is bile independent, thus making it the preferred agent in liver transplant patients. In spite of its relative effectiveness and consistency of absorption, the drug has poor oral bioavailability (25% on average). TAC has wide inter- and intrapatient variability (6,28,29) due to extensive first-pass metabolism in the gastrointestinal tract and liver similar to that of CsA (30). Intravenous-to-oral conversion is therefore estimated by a 1:4 or 1:5 dose ratio. Pharmacokinetic profiling demonstrates both prolonged Tmax and low Cmax values following oral administration, indicating slow and poor absorption (31). The concomitant presence of food decreases both Cmax and AUC. Gastric emptying of solids is faster in patients receiving TAC as compared with CsA, an effect that may be beneficial for patients with gastric motility disorders. Also, of interest is the role of transporter proteins, P-glycoprotein in the gut wall, which results in up to 50% of drug being excreted back into the lumen (32). This explains why drug concentrations tend to be higher during episodes of diarrhea, as the injured gut wall loses transporter capacity.
In the blood, TAC is highly bound to erythrocytes, partly accounting for its extensive Vd. Indeed, Vd ranges from 2.6 to 2.76 L per kg in pediatric liver transplant patients based on whole-blood levels (29,30,33). Seventy-two percent to 98% of plasma TAC is bound to plasma proteins (30). This is unlike CsA, which is more bound to lipoproteins, and hence TAC causes less hyperlipidemia than CsA. TAC is primarily metabolized via demethylation and hydroxylation by the hepatic CYP3A4 enzyme system into 10 or more metabolites. Although some metabolites may have biological activity, most of the immunosuppressive activity and toxicity is due to parent drug. The half-life of TAC is 8 hours, similar to that of CsA. Clearance is mainly via biliary excretion, whereas urinary excretion is negligible and no dose change is required in patients with renal dysfunction.
TAC is usually administered orally at 0.1 to 0.3 mg per kg per day in two divided doses. Most pharmacokinetic studies in children show that the dose required to maintain target blood concentrations is two to three times higher per kilogram of body weight than that in adults (31,34,35). This is related to the larger Vd and higher blood clearance of drug in the pediatric population, which are about twice that observed in adults, unlike CsA (30,31,33,36). Pediatric renal transplant recipients may have lower Cmax and AUC values than liver transplant patients, consistent with decreased hepatic clearance in the latter group (34). Hepatitis C virus-positive patients may also require lower drug doses based on decreased liver metabolism (37,38). In general, patients with liver disease and older patients require longer dose intervals as compared with pediatric patients. Patients of African American ethnicity may also require larger doses of TAC at shorter intervals.
Therapeutic Drug Monitoring
The measurement of CsA and TAC levels is a routine practice in the management of all transplant patients because of the wide variability in pharmacokinetics and strong correlation between level of drug and the incidence of graft rejection and toxicity (39,40). However, controversy prevails regarding the optimal strategy for monitoring drug concentrations. Interpretation of drug concentration depends on sample matrix, assay methodology, type of organ transplant, and time posttransplantation.
CsA concentrations can be measured in whole blood or plasma. Whole-blood measurement is now preferred due to the wide distribution of the drug in red blood cells and
the temperature dependence of plasma levels. Clinicians need to emphasize the assay used to detect these levels, since different methods are available. High-performance liquid chromatography (HPLC) is the reference standard for parent drug measurement but is not suitable for routine clinical use. The commonly used immunoassays for whole-blood sample measurement of CsA are the fluorescence polarization immunoassay and the enzyme-multiplied immunoassay technique. The commonly used assays cross-react with CsA metabolites to different degrees, and therefore target blood levels are specific to the assay technique utilized (6,41). Clinical outcomes correlate best with AUC, which provides the best estimate of total drug exposure in an individual. Because AUC estimation requires multiple blood draws at specific times, surrogates for drug exposure are utilized. Trough level (C0) is easier to obtain and is not greatly affected by small inaccuracies in the time of blood collection, and therefore is most commonly used. However, trough levels correlate poorly with AUC or with calcineurin phosphatase activity in renal transplant patients (39,40). Similar relationships have also been noted in pediatric liver transplant patients.
the temperature dependence of plasma levels. Clinicians need to emphasize the assay used to detect these levels, since different methods are available. High-performance liquid chromatography (HPLC) is the reference standard for parent drug measurement but is not suitable for routine clinical use. The commonly used immunoassays for whole-blood sample measurement of CsA are the fluorescence polarization immunoassay and the enzyme-multiplied immunoassay technique. The commonly used assays cross-react with CsA metabolites to different degrees, and therefore target blood levels are specific to the assay technique utilized (6,41). Clinical outcomes correlate best with AUC, which provides the best estimate of total drug exposure in an individual. Because AUC estimation requires multiple blood draws at specific times, surrogates for drug exposure are utilized. Trough level (C0) is easier to obtain and is not greatly affected by small inaccuracies in the time of blood collection, and therefore is most commonly used. However, trough levels correlate poorly with AUC or with calcineurin phosphatase activity in renal transplant patients (39,40). Similar relationships have also been noted in pediatric liver transplant patients.
Neoral has a more consistent initial absorption profile than does Sandimmune. With the microemulsion formulation, CsA levels at 2 hours postdose (C2) have been found to correlate better with total drug exposure and immunosuppressive efficacy than C0 levels (42). A C2 blood sample also has a higher proportion of parent drug when compared with a C0 sample; this results in better agreement in C2 levels measured by different assay methodologies than occurs with C0 concentrations, which have a greater proportion of metabolites. However, error margins are greater for C2 levels if the sample is not collected within a narrow (±15 minute) time window. Overall, C2 monitoring has not been universally adopted but is rapidly gaining ground (43,44,45). Many pediatric centers now advocate measurement of C2 levels when monitoring CsA therapy in children (46,47,48).
Similar to CsA, TAC is a drug with a narrow therapeutic index. Because of variable bioavailability and clearance, TDM is mandatory for optimizing clinical outcome. Whole blood is preferred to plasma, as the preferred means for measurement of TAC levels because at least 75% to 80% of drug is bound to erythrocytes. The Abbott microparticle immunoassay methodology is widely used because of its ease and simplicity; however, the DiaSorin enzyme-linked immunosorbent assay provides less metabolite cross-reactivity. Unlike CsA, the 12-hour trough level of TAC correlates well with AUC and clinical outcomes and is the accepted standard for monitoring TAC therapy. Guidelines provided for target levels in adults (10 to 15 ng per mL in the first 3 to 6 months posttransplant) seem applicable to the pediatric age group, but more clinical outcome data are needed (6,49,50). Currently, target TAC trough whole-blood level guidelines followed at the Children’s Hospital of Michigan (CHM) pediatric renal transplant program are shown in Table 45.4.
Adverse Effects
CsA and TAC have similarities as well as differences in their toxicity profiles. Renal, metabolic, hematologic, neurologic, gastrointestinal, cosmetic, and other side effects are summarized in Table 45.5.
Table 45.4 Target Ranges for Tacrolimus Whole-Blood Trough Levels in Pediatric Renal Transplant Patients at Children’s Hospital of Michigan | ||||||||||||
|---|---|---|---|---|---|---|---|---|---|---|---|---|
|
Renal Toxicity
The most common dose-limiting side effect of CIs is nephrotoxicity. CI-induced acute renal toxicity is due to a decrease in renal blood flow and glomerular filtration rate (GFR) produced by a dose-dependent, reversible vasoconstriction affecting primarily afferent arterioles, resulting in a picture of “prerenal dysfunction” with intact tubular function. Vasoconstriction is the combined effect of increased thromboxane and endothelin production, increased sympathetic activity and nitric oxide synthase inhibition with a decrease in nitric oxide, a preglomerular arteriolar relaxant. This renal vasoconstriction may manifest clinically as a delay in recovery of early graft function in kidney transplant patients, a rise in serum creatinine, or worsening hypertension. Renal vasoconstriction is more prominent with CsA than with TAC, also accounting for increasing sodium retention and hypertension. Acute microvascular disease can be caused by either of the CIs and has been
shown to produce thrombotic microangiopathy, resulting in a hemolytic uremic syndrome (HUS)-like picture due to a direct toxic effect on vascular endothelial cells inhibiting prostacyclin production.
shown to produce thrombotic microangiopathy, resulting in a hemolytic uremic syndrome (HUS)-like picture due to a direct toxic effect on vascular endothelial cells inhibiting prostacyclin production.
Table 45.5 Adverse Effects of Calcineurin Inhibitors | ||||||||||||||||||||||
|---|---|---|---|---|---|---|---|---|---|---|---|---|---|---|---|---|---|---|---|---|---|---|
|
Chronic toxicity from CIs can lead to characteristic afferent arteriolar hyalinosis and patchy or striped interstitial fibrosis on renal biopsy. These lesions appear to be a result of long-standing renal vasoconstriction along with ischemia. The resulting chronic renal ischemia increases the accumulation of extracellular matrix proteins in the interstitium. Interstitial fibrosis is felt to be the result of a CI-stimulated increase in TGF-β production. Thus, resulting in chronic allograft nephropathy and ultimately leading to poor graft survival.
Fluid and Electrolyte Abnormalities
CsA is a more potent renal vasoconstrictor and as a result causes more sodium retention, edema, and hypertension when compared with TAC. Other side effects include hyperkalemia and mild hyperchloremic acidosis (a picture of type-IV renal tubular acidosis). Concomitant administration of a β-blocker, angiotensin-converting-enzyme (ACE) inhibitor, and/or angiotensin-receptor blocker may further exaggerate hyperkalemia. Hypomagnesemia is more common with TAC than with CsA. Hyperuricemia is also a common abnormality, although gouty attacks are more common with CsA than with TAC.
Glucose Metabolism Disorders
Posttransplant diabetes mellitus (PTDM) is a serious adverse effect of CsA and TAC therapy. A meta-analysis demonstrated a significantly higher incidence of PTDM among TAC-treated adult renal transplant recipients when compared with CsA recipients (51). Interestingly, a prospective randomized trial in children showed no differences in the PTDM rate (52). The proposed mechanism of CI-induced PTDM includes a direct toxic effect on β islet cells and an increase in peripheral insulin resistance.
Dyslipidemia
CsA has an adverse effect on lipid profile leading to hypercholesterolemia and hypertriglyceridemia. The binding of low-density lipoprotein receptor with CsA is implicated as a cause of hyperlipidemia in transplant patients and may also be related to abnormal low-density lipoprotein feedback to the liver. The effect may be less marked with TAC, and switching from CsA to TAC may improve the lipid profile.
Malignancies
Patients receiving immunosuppressants are at increased risk for development of infections, posttransplant lymphoproliferative disorder (PTLD), and other viral-associated malignancies. This risk is related to the overall intensity of immunosuppression rather than to specific individual agents. Although large studies focusing on the toxicity of these drugs in the pediatric population are not available, their adverse reaction profile in children appears to be similar to that in the adult population. However, the incidence of PTLD is higher in pediatric allograft recipients because these patients tend to be more heavily immunosuppressed (receive antilymphocyte antibody for induction and/or treatment of acute rejection) and are more likely to be Epstein–Barr virus (EBV) seronegative and receive EBV-seropositive donor organs. Although PTLD was initially shown to be more common with TAC, a randomized controlled trial in the pediatric population did not report increased malignancy with TAC when compared with CsA (52).
Neurotoxicity
Coarse tremors, headaches, and insomnia are dose related and more common with TAC. Seizures and leukoencephalopathy have also been reported.
Hematologic Toxicity
Hemolytic anemia with thrombocytopenia may occur as a part of HUS in transplant patients. We reported a pediatric case of autoimmune hemolytic anemia requiring multiple transfusions, which improved after withdrawal of CI and substitution with SRL (53).
Cosmetic
Gingival hyperplasia and hypertrichosis are more common with CsA than with TAC. CsA may also cause gynecomastia in men and breast enlargement in women. TAC may produce hair loss and alopecia.
To summarize, although there are similarities in their side-effect profiles, CsA has a greater tendency to produce gingival hyperplasia, hirsutism, hyperlipidemia, and hypertension. TAC is more likely to cause PTDM and neurotoxicity. In a randomized trial of TAC versus CsA microemulsion in pediatric renal transplant recipients, 95% to 100% of patients experienced at least one adverse event (52), most commonly hypertension, hypomagnesemia, and urinary tract infections. Hypomagnesemia and diarrhea were more common with TAC use, whereas hypertrichosis, flu syndrome, and gingival hyperplasia were more frequently seen with CsA. In this study, no differences were noted in the incidence of posttransplant infections, diabetes mellitus, or lymphoproliferative disorders.
Drug Interactions
Because of the prime importance of the intestinal P-glycoprotein and CYP3A4 systems in absorption and metabolism of CIs, a large number of drugs that affect these systems can cause significant interactions (24,54), as shown in Table 45.6. Additive toxicity may also occur with other drugs, such as hyperkalemia with ACE inhibitors; nephrotoxicity with aminoglycosides, amphotericin B, and nonsteroidal anti-inflammatory drugs; and myopathy and rhabdomyolysis with lipid-lowering agents.
Therapeutic Efficacy and Pharmacoeconomics
The clinician has to balance efficacy and toxicity when choosing a CI for transplant patients. A recently analyzed
meta-analysis of 30 randomized controlled trials in adult renal transplant patients (55) showed TAC to be more effective than the microemulsion formulation of cyclosporine in preventing rejection episodes. However, a higher rate of diabetes and PTLD was reported in the TAC study group. In the pediatric population, there is a paucity of studies comparing the two CI drugs. A randomized controlled trial in pediatric renal transplants demonstrated that at 4 years, patient survival was similar but graft survival significantly favored TAC. In children, both PTDM and PTLD were reported to be similar in the TAC and CsA study groups (56). Also, the medication costs were not significantly different over the 4-year posttransplant period (16). Because graft survival is better with TAC, it has a pharmacoeconomic advantage over CsA as also shown in adult trials.
meta-analysis of 30 randomized controlled trials in adult renal transplant patients (55) showed TAC to be more effective than the microemulsion formulation of cyclosporine in preventing rejection episodes. However, a higher rate of diabetes and PTLD was reported in the TAC study group. In the pediatric population, there is a paucity of studies comparing the two CI drugs. A randomized controlled trial in pediatric renal transplants demonstrated that at 4 years, patient survival was similar but graft survival significantly favored TAC. In children, both PTDM and PTLD were reported to be similar in the TAC and CsA study groups (56). Also, the medication costs were not significantly different over the 4-year posttransplant period (16). Because graft survival is better with TAC, it has a pharmacoeconomic advantage over CsA as also shown in adult trials.
Stay updated, free articles. Join our Telegram channel

Full access? Get Clinical Tree


