Image Acquisition
ULTRASOUND PHYSICS
Ultrasound is “sound” that is at a frequency above the range that can be heard by the human ear. Ultrasound is defined as an acoustic oscillation or sound wave with a frequency greater than 20,000 Hertz (Hz) or 2 megahertz (MHz).1 For diagnostic purposes, ultrasound energy is transmitted into the human body with the returning echoes forming an image. The returning signals are referred to as being echogenic (producing echoes), hypoechogenic (producing low levels of returning echoes), or hyperechogenic (producing high levels of returning echoes).
The transmission of ultrasound energy from one place to another is termed propagation. The speed at which ultrasound energy moves is its propagation speed. Propagation speed is dependent on the type of substance through which the energy is transmitted. Sound waves propagate through matter by causing the vibration of molecules; the stiffness, elasticity, and density of the matter (i.e., liquid, tissue, bone) that the molecules make up determine how fast the sound waves move. Generally speaking, the stiffer the matter, the higher the velocity of movement of the sound (sound propagation). For example, when comparing water to bone, bone is denser and will produce a greater vibration of molecules and a higher propagation speed.
The frequency of sound allows for the differentiation of instruments into certain categories. Frequency is defined as the number of vibrations that occur per unit of time; it is expressed in MHz: the greater the number of vibrations that occur, the higher the frequency (in MHz); the lower the number of vibrations that occur, the lower the frequency.
Frequency also impacts how sound waves will be transmitted: the higher the frequency, the shorter the sound wave (wavelength) and the better the resolution or image acquisition. But the frequency also determines the depth through which sound can penetrate structures, tissues, and organs. Therefore, with higher frequency transducers, the image obtained will have higher resolution. The downside of the highfrequency transducer is that the depth of imaging ability will be compromised, and deeper structures cannot be visualized. With lower transducer frequency, the sound wave is longer (wavelength), allowing it to achieve greater depth of transmission; the downside is that the resolution is decreased.
The ultrasound transducer is a device that transmits and receives energy. It is responsible for converting electrical energy to mechanical energy within the ultrasonic frequency range as it sends the ultrasound signal through the body. It then converts the returning mechanical energy back into electrical energy, which then displayed as an image.
The piezoelectric element within the transducer converts one form of energy into another. The piezoelectric element is comprised of ceramic material. When electrical voltage is supplied to the piezoelectric element, it causes vibration at the element’s resonant (operating) frequency. This resonant frequency depends on the element’s thickness: the thinner the element, the higher the resonant frequency of the transducer and vice versa. Transducers are manufactured with different thicknesses of piezoelectric elements, which then determines the resonant or operating frequency.
SONOGRAPHY DISPLAY MODES
There are two display modes for the sound waves that are being returned to the machine: A-mode and B-mode. A-mode represents amplitude modulation, which is a single dimension display consisting of a horizontal baseline. The baseline represents time or distance upward deflections that indicate the different acoustic interfaces.
Sonography in obstetrics and gynecology utilizes B-mode, or brightness mode, meaning that each echo returned to the transducer provides a “brightnessmodulated” display. B-scans are B-mode displays that provide a cross-section of objects in real time. In the early days of sonography, the B-mode machines only provided static or frozen images. Modern machines allow movement to be visualized; these scans are termed “real-time” scans.
M-mode is a graphic B-mode display in a single dimension that represents the motion of an object, such as cardiac activity. M-mode measures distance over time, allowing the calculation of fetal heart rate. M-mode is primarily used in fetal echocardiography.
The echoes returning from tissue and bone have different degrees of reflection that produce the shades of gray in the image seen on the monitor or in the film or print. The denser the tissue, the greater amount of returning echoes, and the whiter or brighter appearing image. Fluid-filled organs lack the necessary density to reflect echoes back to the transducer; the majority of the echoes pass right through. Therefore, fluid appears black. Such structures are referred to as being anechoic or hypoechoic.
DOPPLER ULTRASOUND TRANSDUCER OPERATION
There are two basic types of Doppler transducer operation in medical ultrasound: continuous-wave Doppler and pulsed-wave Doppler. Continuous-wave systems detect both the transmission and reception of sound wave simultaneously. Both continuous- and pulsedwave Doppler studies are used to detect the presence and direction of blood flow through vessels. This is referred to as the Doppler shift, which measures the difference in the frequency of the reflected sound compared to the frequency of the transmitted sound. Doppler shift depends on the insonating frequency, the velocity of moving blood, and the angle between the sound beam and the direction of the moving blood. If the sound beam is perpendicular to the direction of blood flow, there will be no Doppler shift and therefore no display of flow in the vessel. The angle of the sound beam should be less than 60 degrees at all times.
Pulsed transducers or pulse-echo ultrasound transducers send short bursts of sound energy into the imaged area. Return echoes are produced by the different characteristics or densities of the material being studied.
Color Flow Doppler Ultrasound
Color flow Doppler is a form of pulsed-wave Doppler in which the energy of the returning echoes is displayed as an assigned color. By convention, echoes representing flow toward the transducer are typically seen as shades of red, and those representing flow away from the transducer are seen as shades of blue. Color Doppler ultrasound (also referred to as color flow ultrasound) is a technique for visualizing the direction or presence of motion (typically blood flow) within an image plane. The color display is superimposed on the B-mode image, thus allowing simultaneous visualization of anatomy and flow dynamics.
Spectral Doppler Ultrasound
Spectral Doppler is a form of ultrasound image display in which the spectrum of flow velocities is represented graphically on the Y-axis with time displayed on the X-axis; both pulsed-wave and continuous-wave Doppler are displayed in this way.
Duplex Doppler Ultrasound
Duplex Doppler is an image display in which both spectral and color flow are used simultaneously. This facilitates accurate anatomical location of the blood flow under investigation.
Transducers
The choice of which transducer should be used depends on the depth of the structure being imaged. The higher the frequency of the transducer crystal, the less penetration it has but the better the resolution and vice versa.
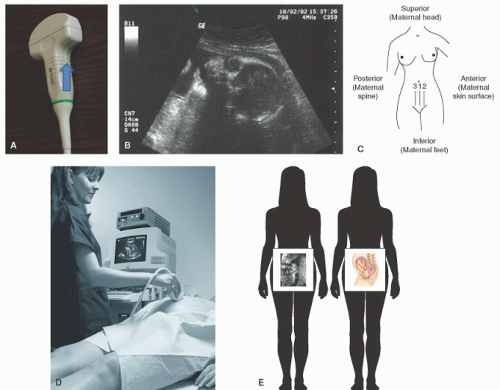
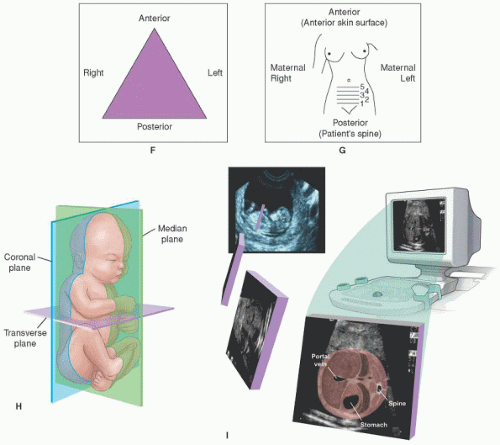
All transducers have an indicator ridge, button, or arrow that distinguishes orientation. The indicator ridge on the transducer corresponds with the indicator on the monitor (upper left of the image, sometimes the corporate logo) so that the operator can determine which side of the body is being imaged. Ultrasound images are typically displayed as a mirror image. Depending on transducer orientation, when facing the monitor, the left side of the screen in the image is the patient’s right (in the transverse plane) or the patient’s head (longitudinal plane). (Refer to scan plane section for additional information.) The top of the screen is where the transducer is located on the body. It is recommended that the operator hold the ridge under the thumb so as to not confuse direction during scanning. If the monitor doesn’t have an indicator mark, generally, the left side of screen corresponds to the side of transducer under the thumb (Figure 9-1A). Figure 9-1 (B-H) demonstrates the visual progression as the transducer receives the image and how it will then appear to the operator.
Each transducer has an inherent frequency that is a function of its crystal composition and shape. Many of the newer probes offer several frequencies within one probe. The frequency of the probe is determined by the propagation speed of the transducer material
and the thickness of the transducer element. There are basically four different probe shapes used in obstetrical imaging: linear, sector, curved linear, and the intracavity or endovaginal transducer. These probes typically range in frequency from 2.5 MHz, which is 2.5 million cycles per second, to 10 MHz, which is 10 million cycles per second. Probe selection is based on imaging needs.
and the thickness of the transducer element. There are basically four different probe shapes used in obstetrical imaging: linear, sector, curved linear, and the intracavity or endovaginal transducer. These probes typically range in frequency from 2.5 MHz, which is 2.5 million cycles per second, to 10 MHz, which is 10 million cycles per second. Probe selection is based on imaging needs.
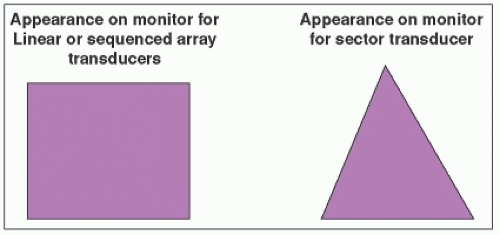
The display or shape of the screen varies depending on the type of transducer used. The sector transducer produces more of a wedge-type format whereas linear transducers produce a rectangular format (Figure 9-2).
Transducers for transabdominal OB/GYN imaging generally range from 3 to 6 MHz, whereas endovaginal transducers use a higher frequency, to 5 to 10 MHz. Transducers are expensive, often in the $10,000 price range because of their specialized functions. The transducer is also the most often and most easily damaged component of the machine. If a transducer is dropped, the piezoelectric elements or “crystals” can be easily damaged.
The difference in transducers is the resolution of the image it produces and the ability to delineate various tissue densities. For instance, a fluid-filled bladder or an area of fresh blood will have no or minimal echoes (anechoic or hypoechoic) returned to the transducer, so the image displayed is darker than the surrounding tissues or black. As blood begins to clot, more echoes will be returned to the transducer and will be displayed as different shades of gray. The denser the tissue or reflector, the whiter or brighter (hyperechoic) the image will be. A combination of fluid and tissue will appear in varying degrees of black, gray, or white.
An important concept to remember when choosing the appropriate transducer is that the higher the frequency of the transducer, the greater the resolution but the shallower the penetration. Inversely, the lower the frequency, the lower the resolution, and the greater or deeper the penetration will be. The frequency of the transducer, the transducer diameter, and the distance/depth
of the structure being examined are pivotal in the production of the image quality. Other factors that influence which transducer to choose include the type of ultrasound exam to be performed. These include the approach (abdominal versus vaginal), fetal gestational age, amount of abdominal adipose tissue, and what types of transducers are available.
of the structure being examined are pivotal in the production of the image quality. Other factors that influence which transducer to choose include the type of ultrasound exam to be performed. These include the approach (abdominal versus vaginal), fetal gestational age, amount of abdominal adipose tissue, and what types of transducers are available.
The development of the transvaginal (TV) or endovaginal (EV) ultrasound has produced the greatest impact on obstetric and gynecologic imaging in recent years, especially in the first trimester. Using the TV probe, fetal cardiac activity is identifiable as early as four weeks’ postconception, and ectopic pregnancies are now more accurately diagnosed. In the gynecologic evaluation, endometrial thickness can be easily measured with the TV prove. For the woman undergoing advanced reproductive technologies, ovarian function and follicular response can be monitored and evaluated. Transvaginal imaging may even be implemented throughout pregnancy for those areas of interest that do not require deep penetration. These may include evaluation of the lower uterine segment, prior cesarean section scar evaluation, cervical length measurement, and placental evaluation in low-lying placentas or previa.
Stay updated, free articles. Join our Telegram channel

Full access? Get Clinical Tree


