The exercises presented in this chapter are meant to facilitate the integration of the didactic information contained within the text of this book into the processes of critical thinking necessary for practicing the skill of electronic fetal monitoring (EFM). In each of the following case studies, select portions of the fetal strip chart are presented along with the contemporaneous nurse’s notes. When gaps in the data occur, the passage of time is denoted at the start of the subsequent portion of the fetal strip chart.
Proper completion of the exercises includes comparison of one’s interpretation of the fetal strip with the Guide to Interpretation that is located at the end of this chapter. It is necessary to recognize that the information presented within the case studies has been preserved for the purpose of being as accurately reflective of actual circumstances as is possible without breaching confidentiality. Therefore, the interpretations and interventions presented within each case study are not necessarily reflective of the current standard of care. Comparison with the Guide to Interpretation and with current, evidence-based practice is essential in promoting appropriate clinical decision-making. It must be kept in mind that minor variations in interpretation are expected to occur as a result of multiple factors (as discussed in
Chapters 3,
7, and
8). The Guide to Interpretation is, therefore, based upon the reasoning and parameters for evaluating EFM data as have been explained throughout the preceding chapters.
For purposes of confidentiality, all proper pronouns have been removed from the case studies. All other identifying data has been altered to protect the privacy of the patient. Only the clinical designation of the person mentioned (eg, RN, CNM, MD, etc.) is presented. When multiple persons of the same title are involved in the case, such circumstances are denoted numerically, in order of their entrée into the scenario (eg, MD #1, MD #2, etc.).
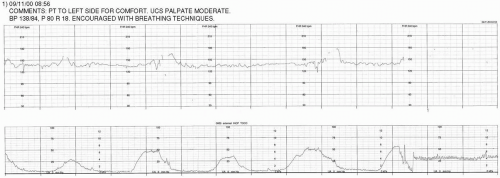
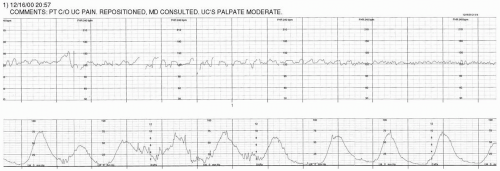
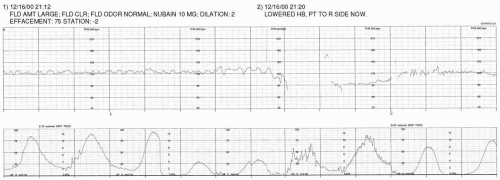
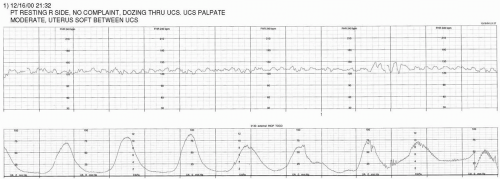
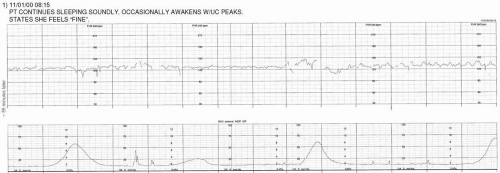
The commentary appearing above the strip chart corresponds with the numerical annotations located in the center margin of the paper strip chart. Abbreviations and nomenclature may vary from case to case, based upon regional or individual differences in expression (eg, use of the terms UC or CTX to express uterine contraction).
For the purposes of clarity and consistency, the Guide to Interpretation at the end of this chapter utilizes the terminology suggested by the National Institute of Child Health and Human Development Research Planning Workshop (see
Chapter 3). When the case studies present monitoring of uterine activity through use of an intrauterine pressure catheter (IUPC), the strength of contractions is expressed in a peak-minus-baseline format. It is necessary to recognize that the selected methods for expressing interpretation of the strip chart employed in the Guide to Interpretation may not be reflective of individual institutional standards or culture. Additionally, minor inter-observer variations in interpretation are likely to occur. Such differences should be viewed objectively and utilized as a catalyst for discussion and continued learning.
The case studies are presented on strip charts that are printed with 30-240 bpm paper scaling. As the examples are presented at 3cm/min paper speed, each regularly ocurring vertical marker represents the passage of 10 seconds of time. Every sixth vertical line is emphasized to represent the passage of one minute of time (six 10-second segments).
Case Examples
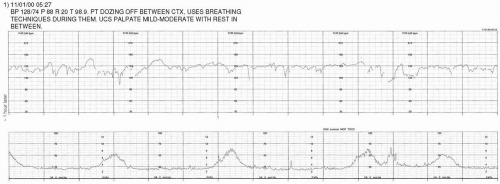
HX OF PATIENT A: 22 YO, G2P1, 40+ WKS, AWAKENED BY SPONTANEOUS LABOR AT 0400.
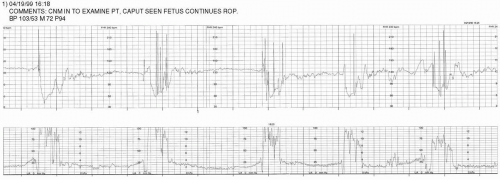
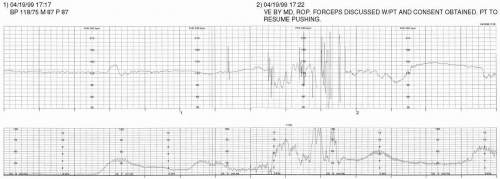
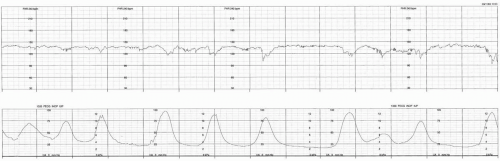
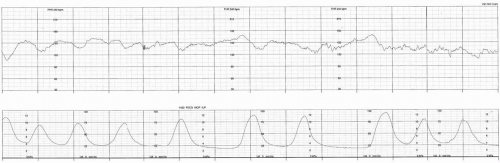
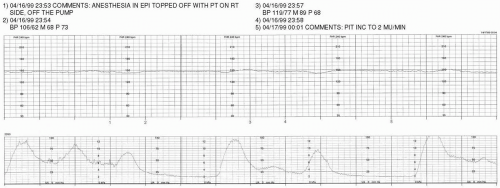
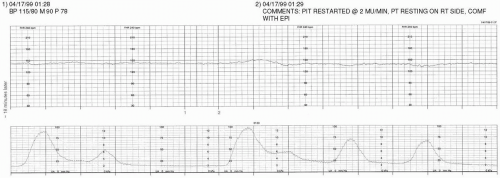
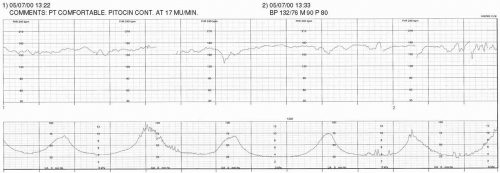
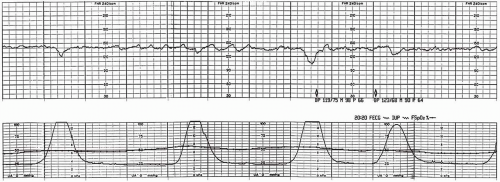
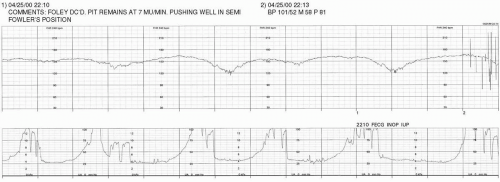
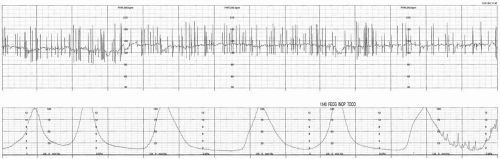
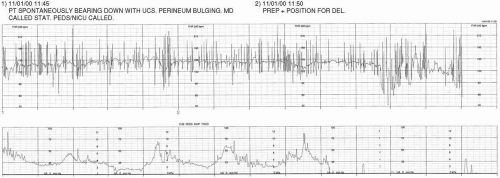
HX OF PATIENT B: 32 YO, G2P0, 39 WKS. FULLY DILATED AND ENCOURAGED TO PUSH SINCE 1600. EPIDURAL IN PLACE.
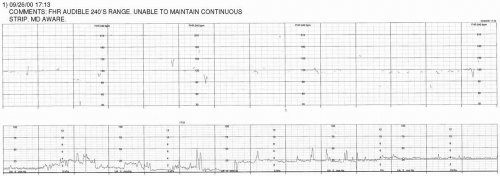
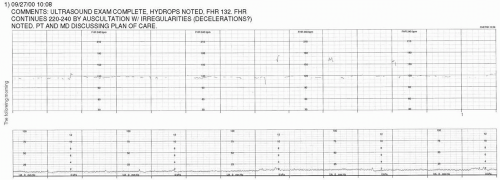
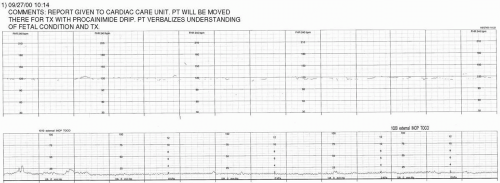
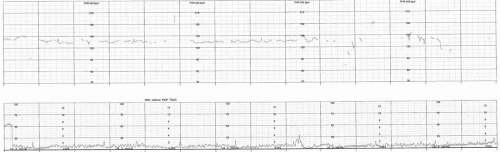
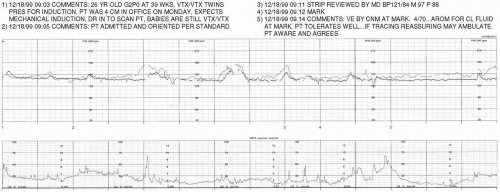
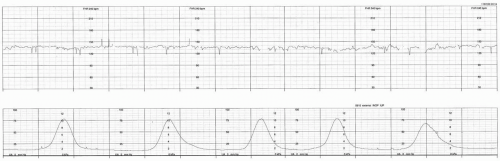
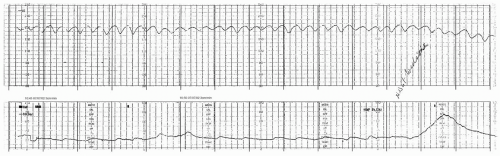
HX OF PATIENT C: 34 YO, G2P1, 28+ WKS, CHRONIC HYPERTENSIVE ADMITTED FOR TREATMENT OF FETAL SVT. FHR AUSCULTATED 200-240 BPM IN MD OFFICE, CONFIRMED BY SONOGRAPHIC EVALUATION.
HX OF PATIENT D: 29 YO, G1P0, 35+ WKS, INDUCTION FOR PIH
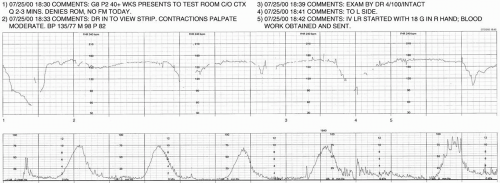
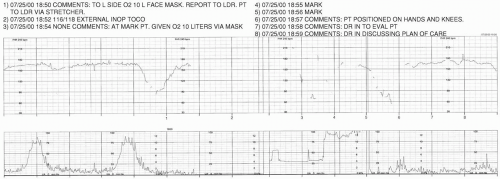
HX OF PATIENT E: 17 YO, G1P0, 42 WKS, 1/2 PPD SMOKER. INDUCTION BEGUN AT 1030 WITH PGE1 FOLLOWING ANTEPARTUM TEST RESULTS OF NONREACTIVE NST AND BPP 6/10. EPIDURAL IN PLACE SINCE 1815.
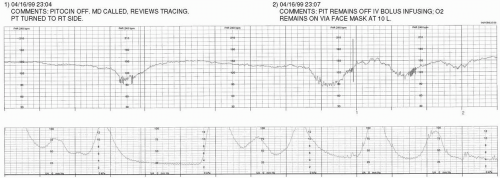
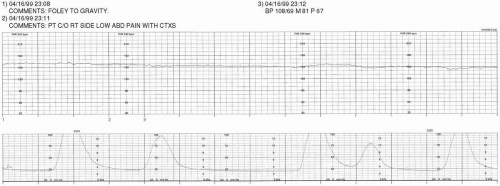
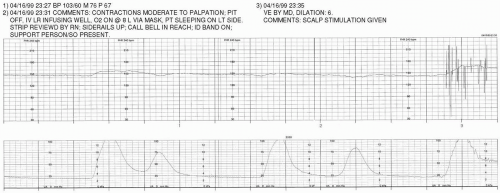
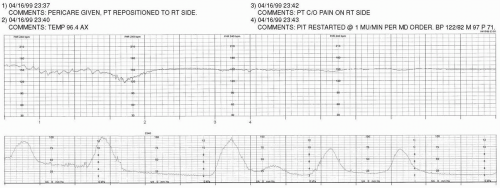
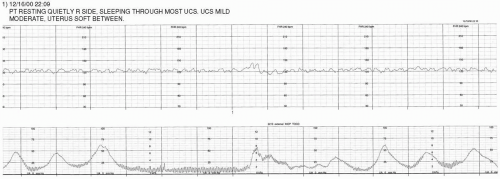
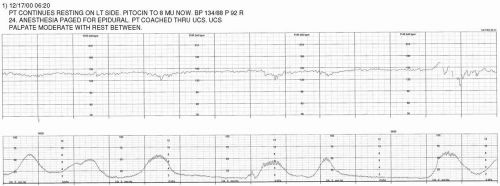
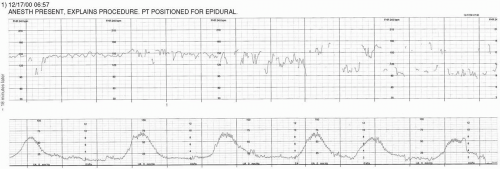
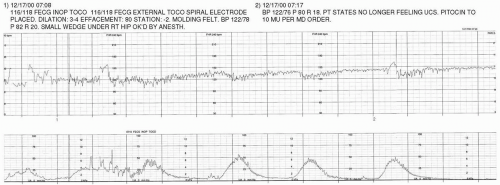
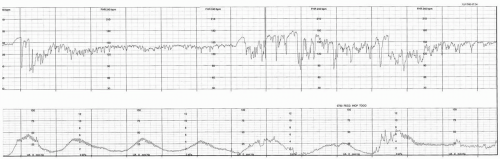
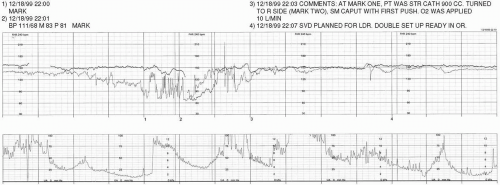
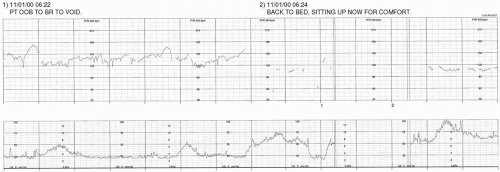
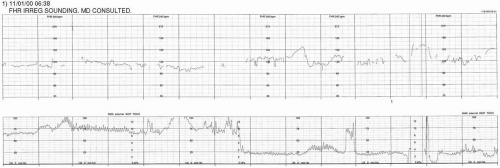
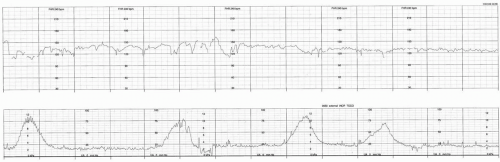
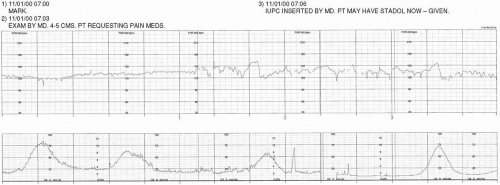
HX OF PATIENT F: 29 YO, G3P2, 39+ WKS, INDUCTION WITH OXYTOCIN BEGUN 0200 AFTER ADMIT FOR SROM (CLEAR). PAIN MANAGED WITH STADOL.
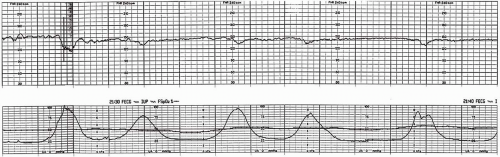
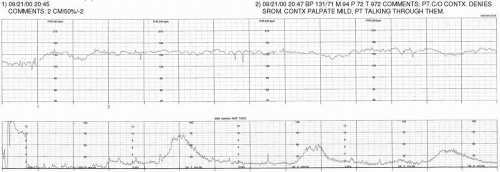
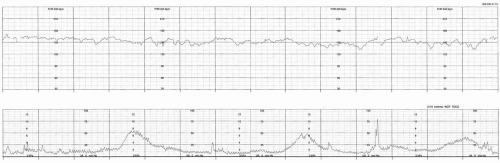
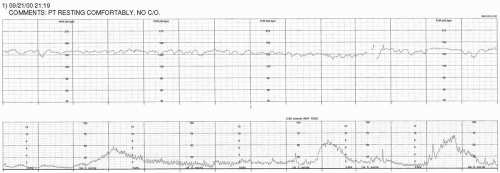
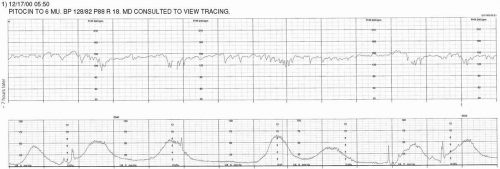
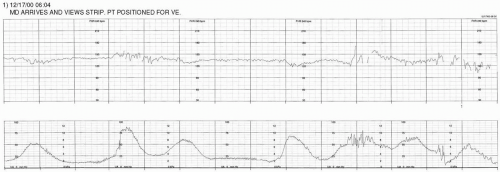
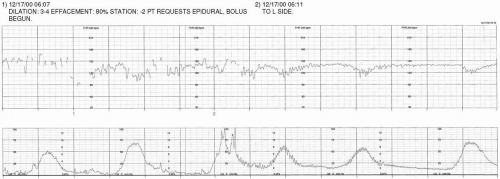
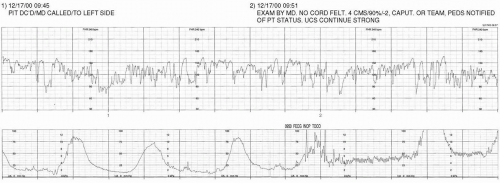
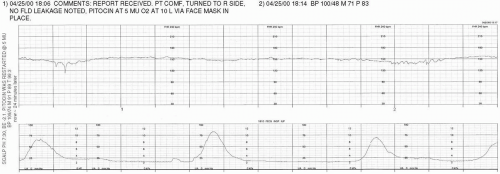
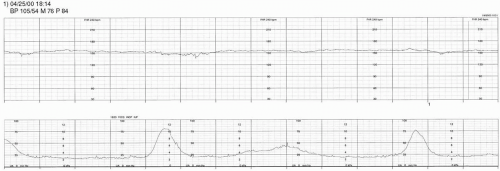
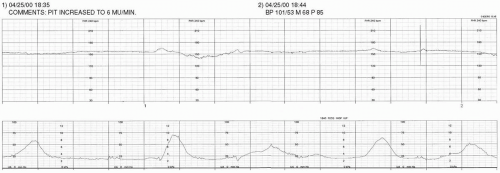
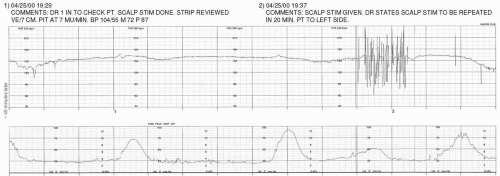
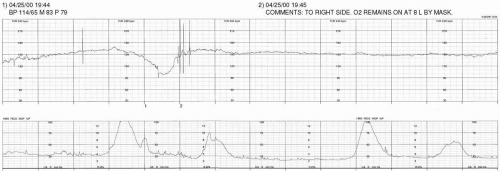
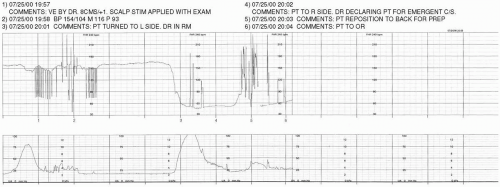
HX OF PATIENT G: 33 YO, G2P0, 38+ WKS, SROM (CLEAR) 0900. SPONTANEOUS CONTRACTIONS SINCE 1300, REGULAR SINCE 1530. 3-4 CM/60%/-2 BY MD EXAM AT 1955.
HX OF PATIENT H: 18 YO, G4P1, 39 WKS, GDM. PRESENTS FOR R/O LABOR.
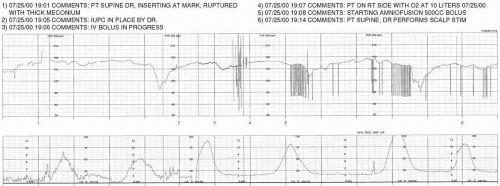
HX OF PATIENT I: 38 WKS, G2P1, GDM (INSULIN DEPENDENT), VBAC (PRIOR C-BIRTH FOR ARREST OF DESCENT AND MACROSOMIA). INDUCTION WITH OXYTOCIN @ 1800, AROM @ 1830 (LIGHT MECONIUM).
HX OF PATIENT J: 23 YO, G2P1, 40 WKS, SPONTANEOUS LABOR SINCE 0430. OXYTOCIN BEGUN AT 1200
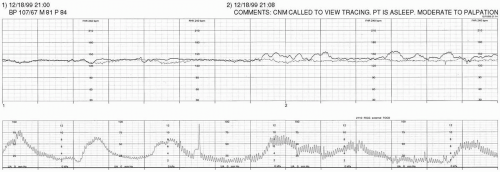
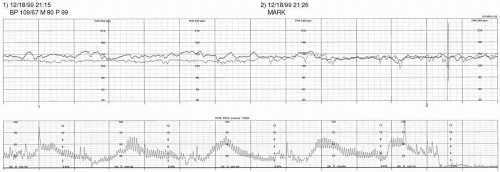
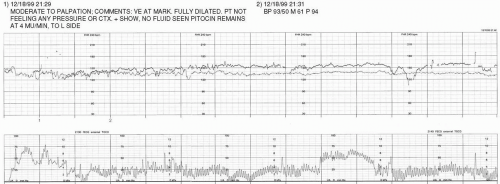
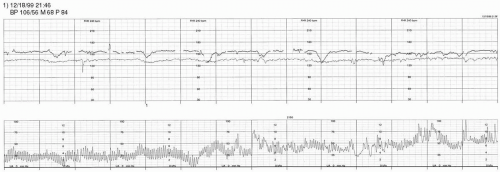
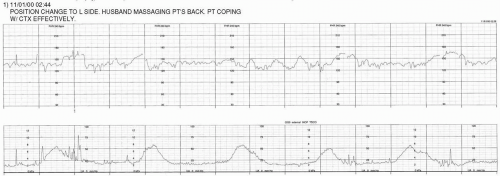
HX OF PATIENT L: 36 YO, G1P0, 40+ WKS, ADMITTED FOR SPONTANEOUS LABOR. SROM AT 1100, CLEAR. 3 CMS ON ADMIT AT 0200.
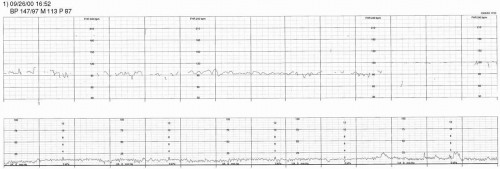
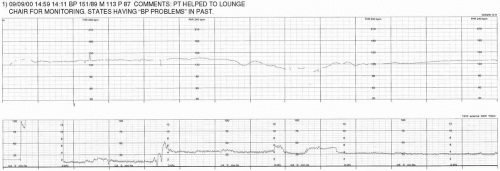
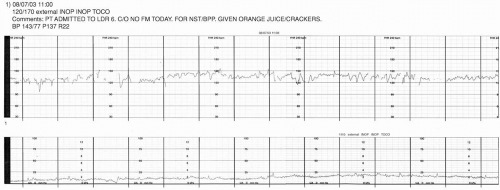
HX OF PATIENT N: G3P2, WITH INCONSISTENT PRENATAL CARE. PRESENTED FOR APPOINTMENT AT -30 WKS BY DATES. NO COMPLAINTS. PLACED ON EFM FOR ROUTINE TESTING.
HX OF PATIENT O: 37 YO, G2P1, 39+ WKS, MILD PIH. CALLED MD AT 10:00 WITH C/O DECREASED FETAL MOVEMENT. LAST EVALUATION TWO DAYS PRIOR: NST REACTIVE & REASSURING, BPP 8/8.
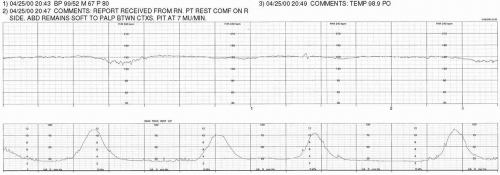
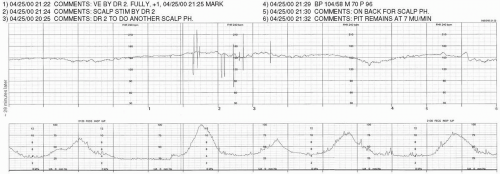
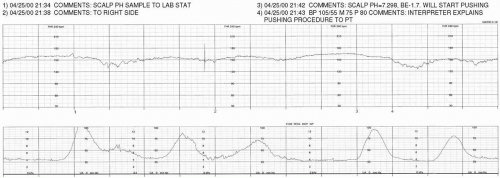
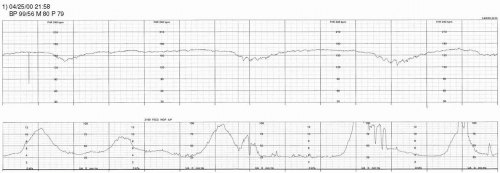
HX OF PATIENT P: 36 YO, G3P2, 37+ WKS. PRESENTS WITH BRIGHT RED VAGINAL BLEEDING X I HOUR; DENIES PAIN, DENIES CONTRACTIONS. ABDOMEN SOFT, NON-TENDER.
Guide to Interpretation
Discussion
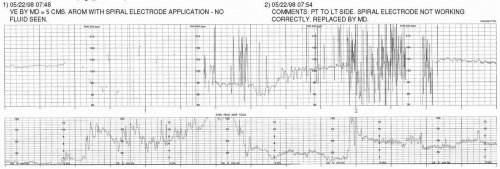
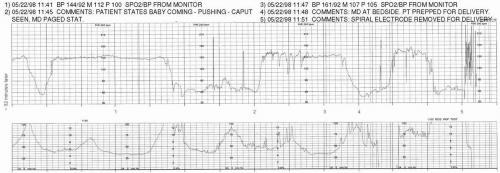
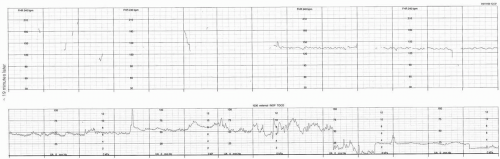
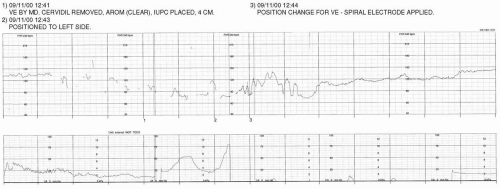
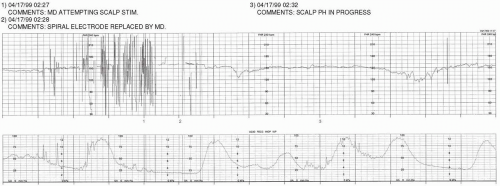
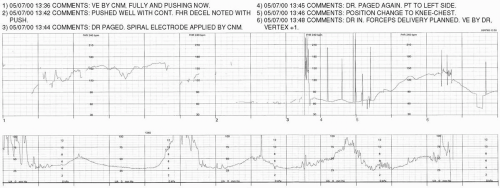
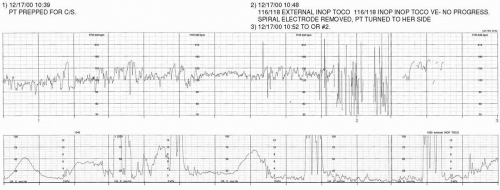
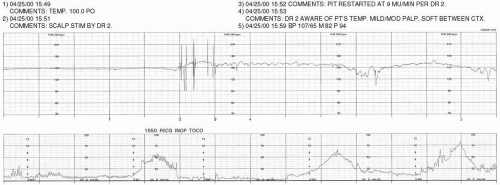
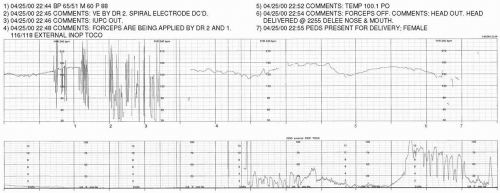
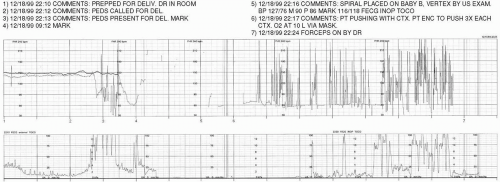
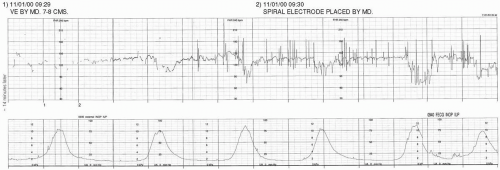
Artifact noted with use of spiral electrode to perform AROM. Spiral electrode should be placed after membranes are either spontaneously or artificially ruptured.
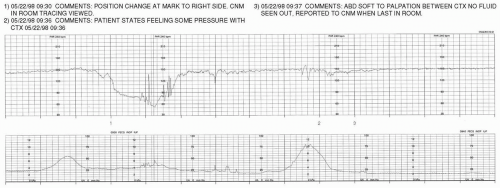
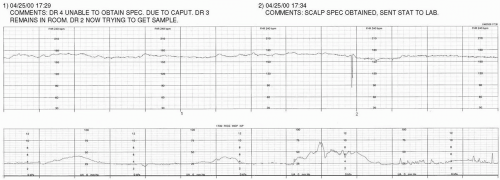
When no fluid is seen on AROM, it is appropriate to consider the presence of meconium or decreased fluid volume.
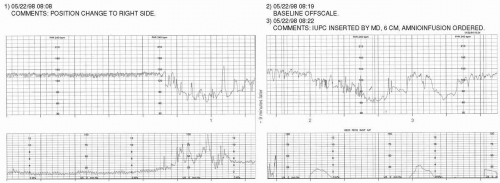
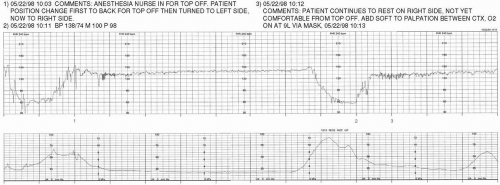
The tocotransducer should be adjusted in order to facilitate interpretation of uterine activity.
Discussion:
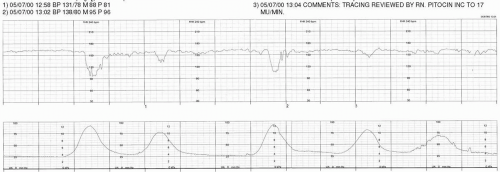
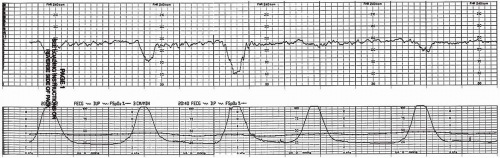
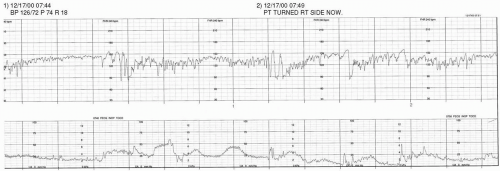
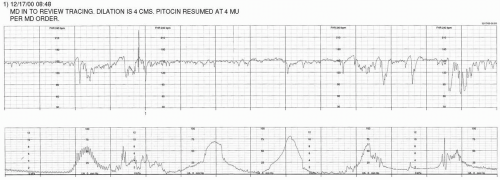
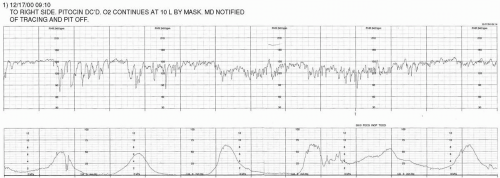
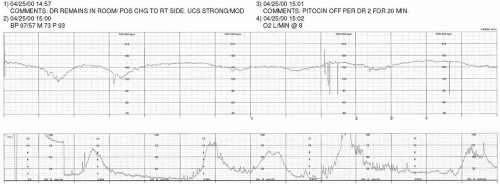
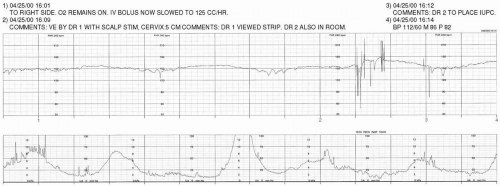
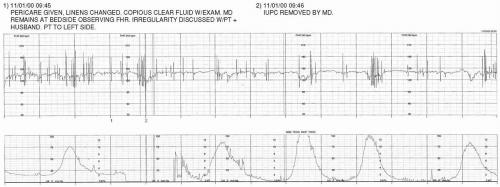
It appears that uterine hyperstimulation has resulted in a pattern of prolonged deceleration.
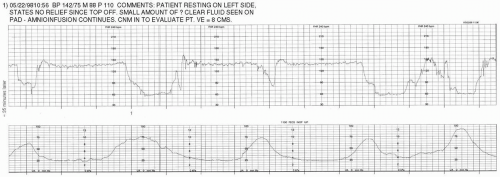
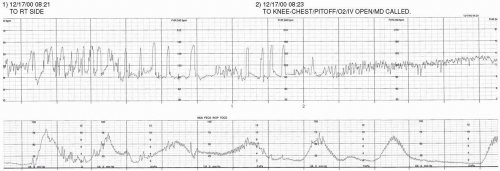
An amnioinfusion was ordered for treatment of variable decelerations. The IUPC (placed during the interval between the two portions of tracing displayed) should be rezeroed.
Discussion:
Discussion:
Discussion:
Discussion:
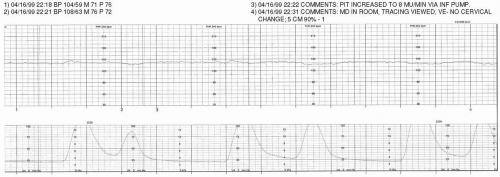
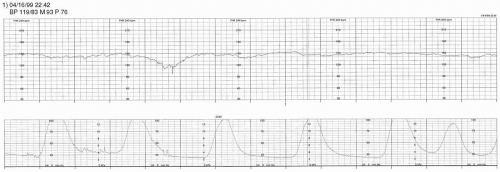
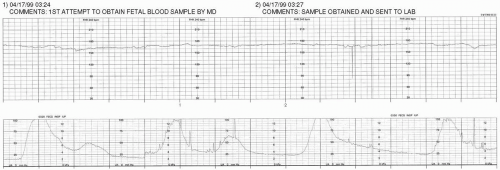
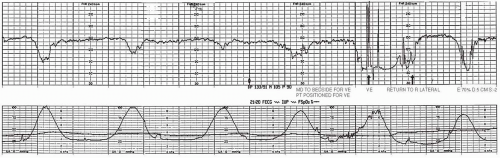
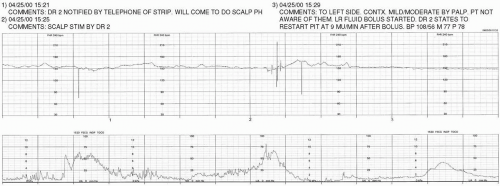
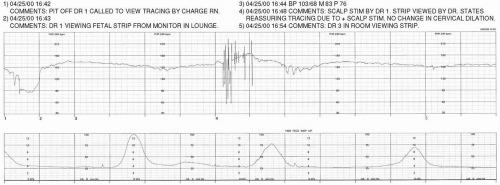
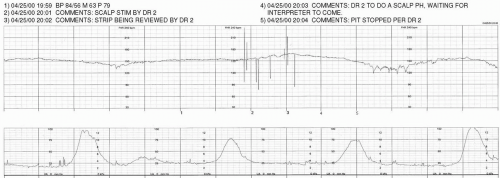
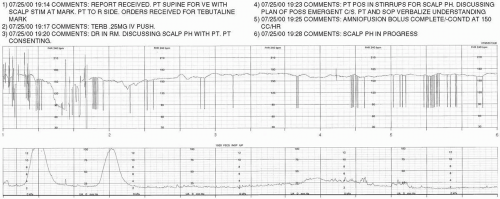
The FHR baseline continues to exhibit nonreassuring signs (minimal variability; variable, late and prolonged decelerations). In such an instance, it may be helpful to use adjunct means to assess fetal acid-base status.
Discussion:
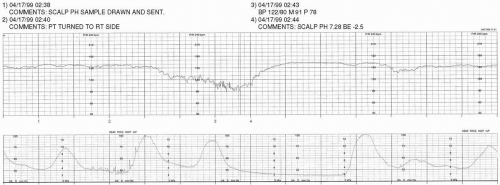
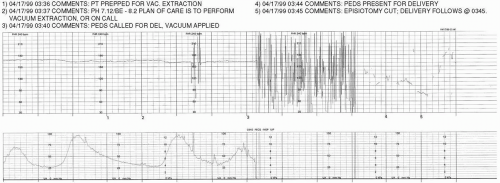
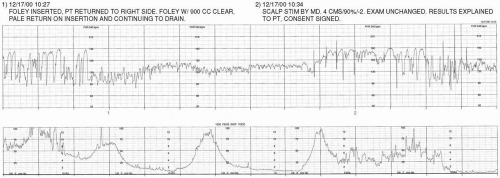
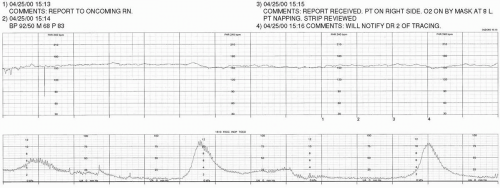
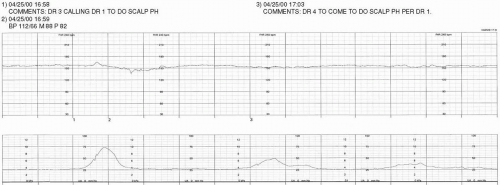
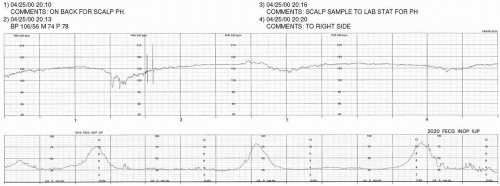
The FHR continues to exhibit nonreassurring signs.
Cervical progress has been made.
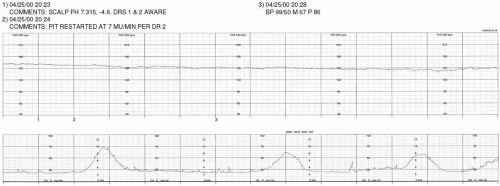
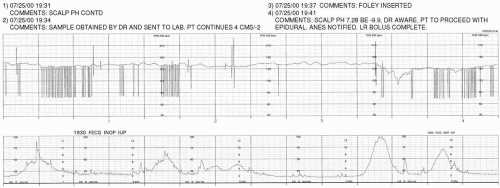
The fetal acid-base status continues to be unknown.
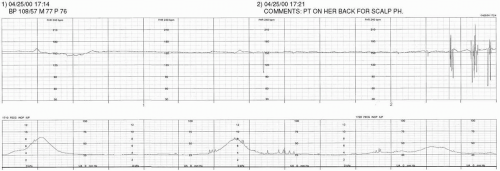
These variable decelerations exhibit shoulders.
Discussion
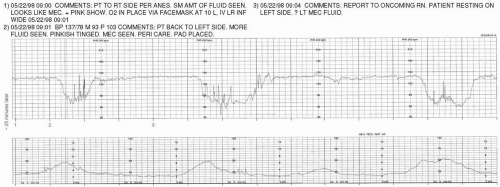
OUTCOME:
SVD live male at 11:57. Apgars 7/9, nuchal cord × 2. Cord pH 7.21/BE-2. Resuscitation—tactile stimulation, blow-by O2.
Discussion
Considerations:
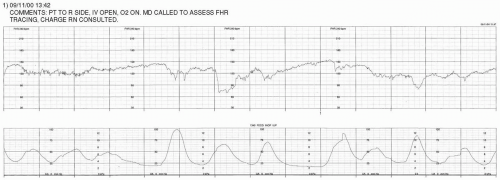
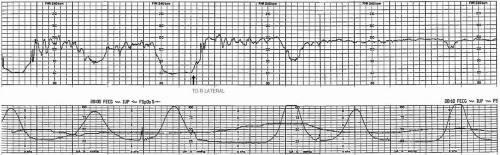
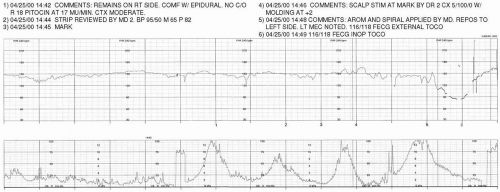
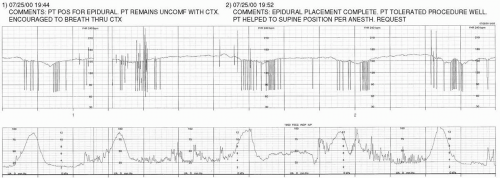
Position changes to assist in rotating fetus to OA and possibly decrease the severity of the variable decelerations.
Decrease stress on the fetus by allowing it to passively descend (the patient has an epidural in place).
If patient does have a strong urge to push, she can be encouraged not to push with every contraction to allow the fetus recovery time.
Amnioinfusion is not an option while the patient is actively pushing.
Discussion:
Discussion:
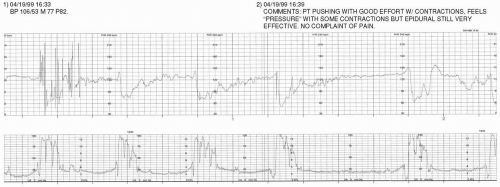
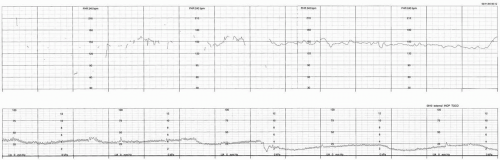
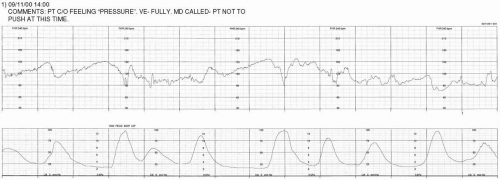
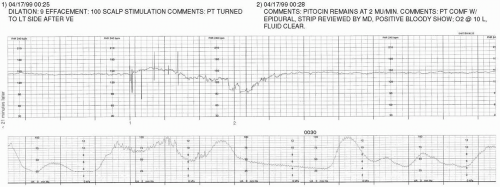
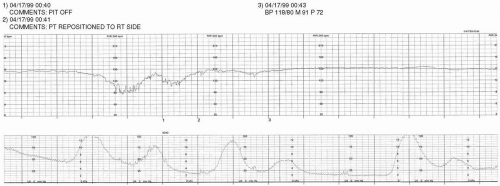
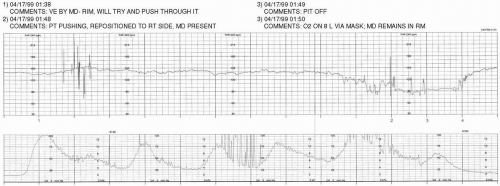
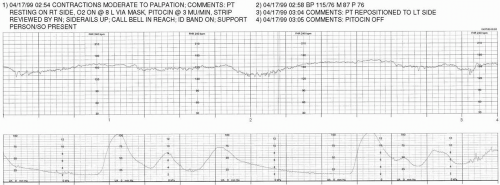
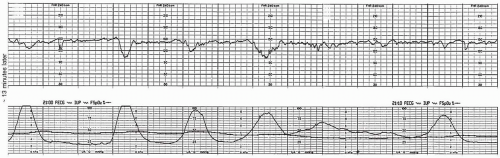
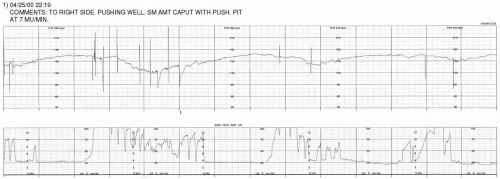
Variable decelerations continue to present with shoulders.
Position changes, not pushing with every contraction, and rest and descend (passive descent) should be considered to minimize the stress of contractions and pushing on the fetus.
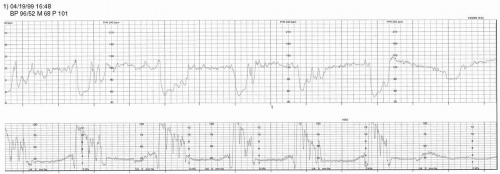
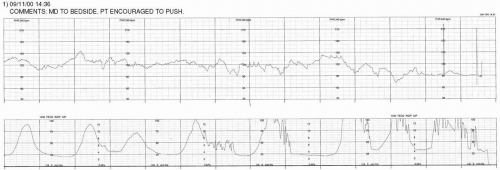
The frequency of the contractions/pushing coupled with the presence of decelerations makes interpretation of the FHR baseline difficult.
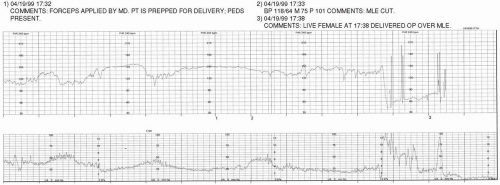
Discussion
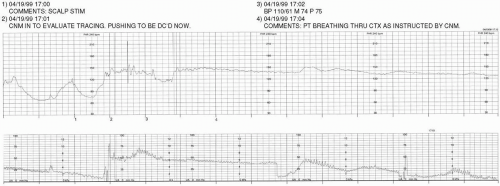
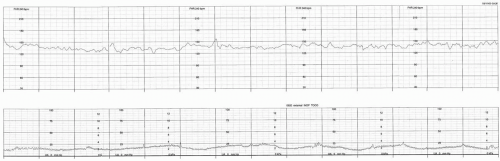
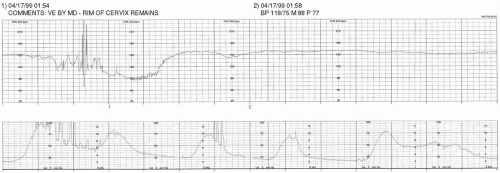
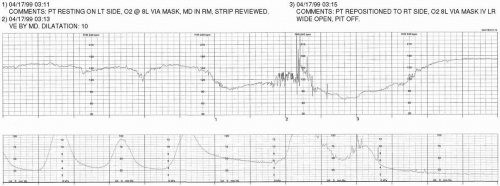
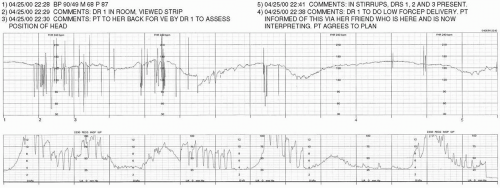
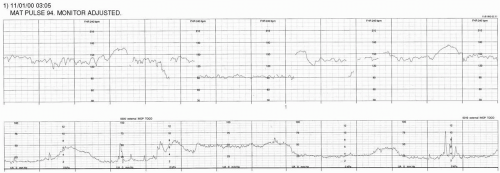
It is difficult to determine the characteristics of the FHR without a clear recording of uterine activity—the tocotransducer should be adjusted.
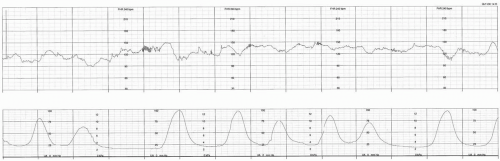
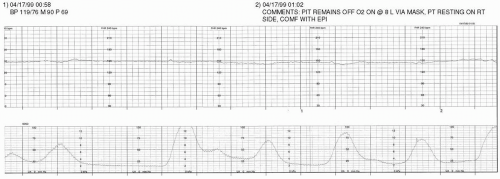
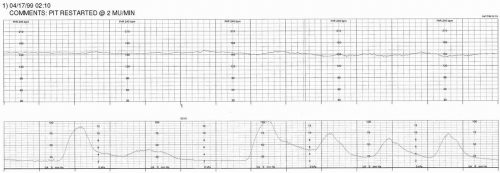
The FHR is improving with the discontinuation of pushing efforts.
Discussion:
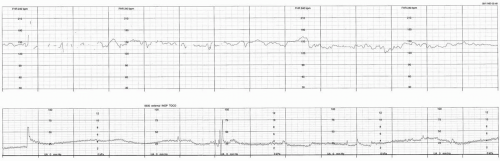
OUTCOME:
Live female at 17:38. Cord pH 7.35/BE-5.0, Apgars 8/9. 3487 grams (7 lbs 11 oz). Spontaneous cry, no resuscitation necessary.
Discussion:
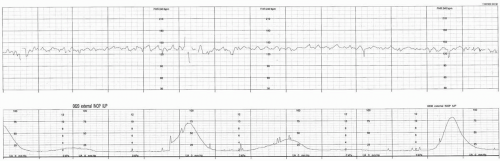
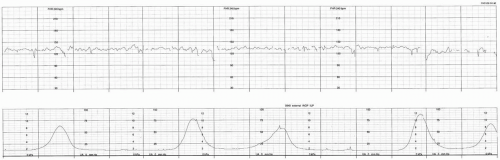
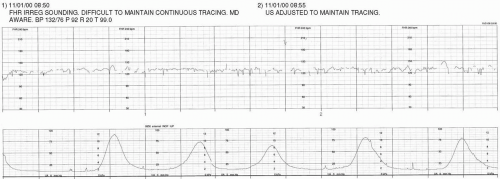
Continous electronic fetal monitoring accomplished through use of an ultrasound transducer may not be the most effective means for monitoring the fetus with a dysrhythmia. As this example demonstrates, the rapid heart rate of this fetus with SVT exceeds the processing capabilities of this mode of monitoring. This results in half-counting of the FHR as it is recorded on the strip chart. Both rapidity and irregularity of the FHR pose a challenge to maintaining a continuous and useful FHR tracing.
Discussion:
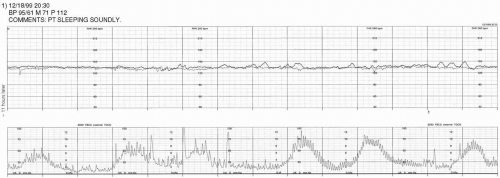
The tocotransducer needs to be adjusted so that uterine activity can be recorded and assessed.
Without uterine activity data, it is not possible to accurately assess the FHR baseline, variability, or the presence of periodic/episodic changes. In this case, gaps in the data should be considered suspicious and may be suggestive of decelerations.
Discussion:
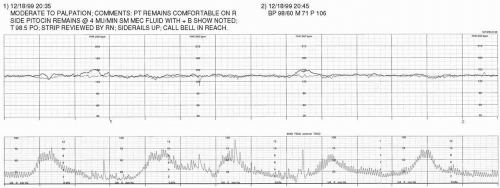
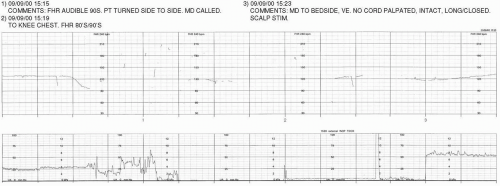
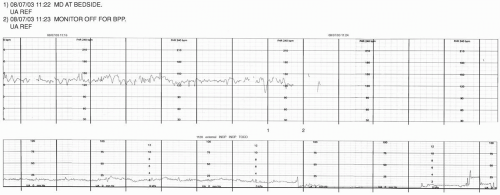
The tocotransducer has not been readjusted since the patient’s last position change. Lack of uterine activity data makes assessment of FHR baseline and periodic/episodic changes difficult.
The gaps in the data continue to be suspicious and may be suggestive of decelerations.
Discussion:
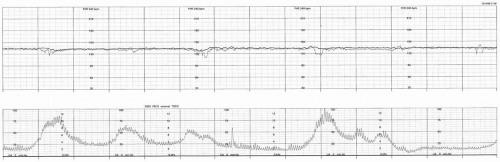
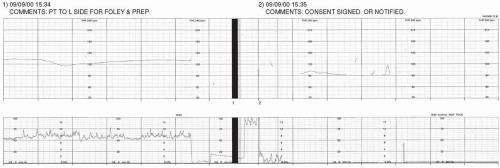
Because uterine activity remains unclear, it is impossible to definitively determine the FHR baseline, variability, and the presence of periodic/episodic changes.
Uterine contractions appear to be recorded as an inverted waveform.
Discussion:
Discussion:
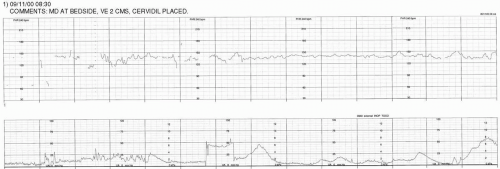
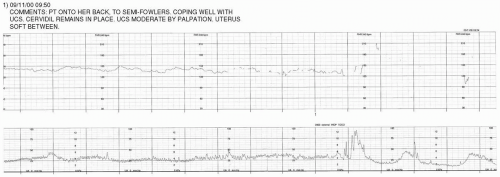
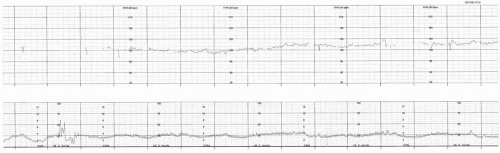
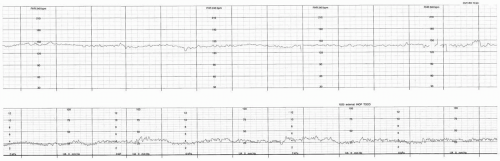
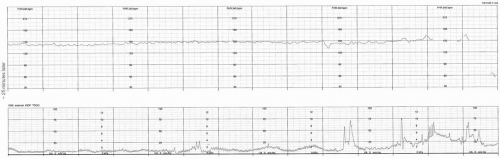
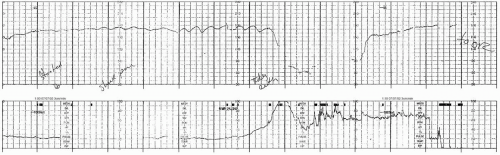
While the data presented is unclear, this tracing is strongly suspicious of uterine hyperstimulation resulting in a prolonged deceleration. This patient needs closer observation, particularly since Cervidil is in place. The external transducers need to be attended to more closely, and if a clinically significant signal cannot be obtained, internal monitoring should be considered. Additionally, the care provider should be made aware of the suspicious findings.
Discussion:
Discussion
Discussion:
Discussion:
Discussion:
Discussion:
Discussion:
Discussion:
Discussion
Discussion:
Discussion:
Discussion:
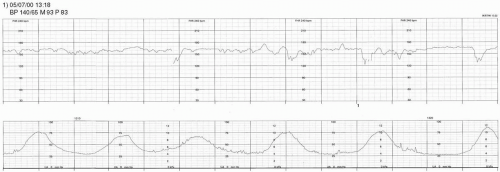
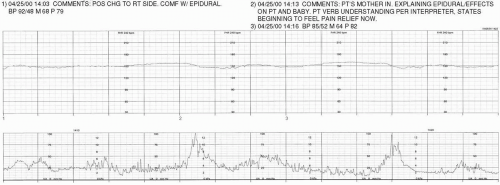
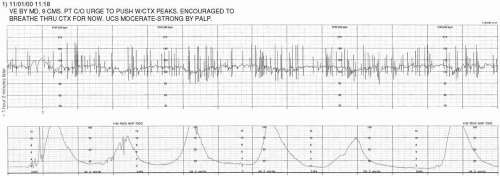
It is difficult to accurately determine the FHR baseline due to the frequency of contractions and decelerations.
The patient is a primigravida and has progressed from 4 cm to full dilation in ˜1 hour and 20 minutes.
Discussion:
Discussion
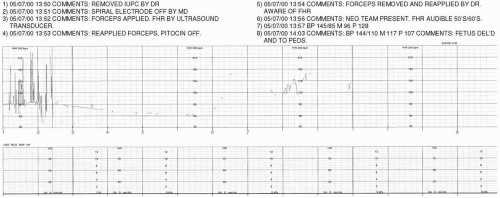
OUTCOME:
Live female at 14:45. Apgars 5/7. Resuscitation: positive pressure ventilation with 100% O2, tactile stimulation, and blow-by O2. One hour postnally, the baby was tachypneic, had ↓ O2 saturation, ↓ sugars, and was sent to the NICU. A full recovery eventually occurred.