Evaluating and Using Laboratory Tests
Cynthia S. Minkovitz
Lawrence S. Wissow
Health care spending in the United States for clinical laboratory services continues to increase as new and more complex laboratory tests are developed and aggressively marketed. Also increasing is the concern that not all of this spending is in the best interest of good medical care. Laboratory tests can be powerful aids in diagnosis and patient management, but evidence shows that many physicians know little about the tests they commonly order. The result is often extra expense and, at times, avoidable morbidity.
The common use of most laboratory tests has preceded study of how well they perform and in what settings they should be used. This chapter has two goals:
To list the characteristics of laboratory tests and identify how the clinician can use these characteristics to select the appropriate test
To describe how laboratory tests fit into the larger process of medical management
DEFINITIONS
In this chapter, the term test means a laboratory or clinical procedure, such as a determination of serum sodium concentration or a urinalysis. The concepts discussed here apply equally to most other procedures used to gather clinical information. For example, questions in a medical history or maneuvers in a physical examination can be considered tests for which performance characteristics can be defined and measured.
Test characteristics also can be incorporated into a technique called decision analysis. Decision analysis can be used to outline variations in the process and outcome of care for a particular condition. It can facilitate understanding how patient signs and symptoms, tests, patient preferences, and alternative outcomes contribute to diagnosis or treatment decisions. This technique also prompts decision makers to incorporate the probabilities that particular events will occur and to quantify the value placed on each outcome.
CHARACTERISTICS OF TESTS
Practical Considerations
One major class of decisions involved in choosing a test is practicality. Sometimes little choice exists; only one test or method offers the possibility of obtaining the needed information. Alternatively, choices may be guided by the existence of practice guidelines or critical pathways at institutions in which the provider practices. Most of the time, however, a variety of tests are possible, and they vary in cost, availability, risk to the patient, and speed of obtaining results.
Equipment
The skill or equipment required to perform the tests may vary, requiring the clinician to choose carefully which laboratory or machine to entrust with the analysis. Economic incentives often play a major role in this decision. For example, clinicians may help control costs, generate revenue for themselves, and obtain quicker answers by installing relatively simple laboratory equipment in their offices. These machines may measure the same parameters (e.g., hemoglobin, blood protoporphyrin) as more complicated central laboratory equipment, but they may use different methods that do not always yield parallel results over the entire range of clinically important values. They also require constant upkeep and testing using standard specimens, a task usually taken for granted when tests are performed in organized laboratories. Even simple office laboratory equipment such as centrifuges, timers, and incubators must be monitored consistently to ensure proper functioning.
Quality-Control Issues
Most texts on clinical laboratory methods suggest quality-control measures and programs suitable for office laboratories. The importance of quality control and method-to-method variation cannot be overemphasized. In 1985, for example, the American College of Pathologists sent aliquots from a standardized blood sample for serum cholesterol determination to more than 5,000 clinical laboratories. Reported results ranged from 197 to 379 mg/dL compared with a reference laboratory determination of 263 mg/dL. Wide variations, even among laboratories using identical autoanalyzers, suggested that uneven quality-control procedures rather than methodologic differences were responsible for most of the discrepancies. Physicians should determine whether the laboratory to which they regularly send specimens participates in externally run quality-control programs and how closely quality is monitored internally.
Concerns about quality control led to the Clinical Laboratory Improvement Amendments of 1988 (CLIA). This federal legislation was enacted in an effort to improve patient care by ensuring the accuracy of laboratory tests performed in physician offices and other sites. Under CLIA, all facilities performing laboratory tests on human specimens must receive a CLIA certificate indicating which tests the laboratory is approved to perform. CLIA regulations initially were thought to have decreased the testing available in practitioners’ offices; however, Benjamin suggests that this trend may be reversing because of the growth of waived tests, such as rapid identification of group A streptococcus, tests for detection of pregnancy and ovulation, and spun hematocrit tests. In addition, revisions to CLIA regulations have decreased the burden of inspections for laboratories where the only procedure performed is the provider’s own use of a microscope. Technologic advances also have created more accurate testing kits, making it easier to stay in compliance with CLIA standards.
CLIA regulations and site-specific requirements, such as accreditation requirements for hospital laboratories, may limit the availability of on-site laboratory testing. Decisions to pursue laboratory testing increasingly may need to incorporate patient preferences for travel to off-site facilities and provider concerns about the convenience of obtaining results, as well as the usual considerations of the appropriateness of obtaining additional laboratory information.
Performance Characteristics of Tests
How well a test performs can be described by several parameters, each of which is important in determining when the test may be useful. A test’s precision reflects how much difference to expect if the same specimen was tested repeatedly. For example, a clinician needs to know whether a change from 20% to 30% of neutrophils on a patient’s differential white blood cell (WBC) count reflects a resolution of the patient’s neutropenia or is likely to be a variation in test performance.
A test’s precision is not always related to its accuracy (i.e., the relationship of test result to true value of the measured parameter). A machine may measure serum potassium with great precision, but values are meaningless if one does not recognize that hemolysis may render them inaccurate.
Sensitivity and Specificity
Test characteristics derived from the sums and ratios of the four cell values (see Box 12.1) determine how well a test performs a diagnostic task. Sensitivity is the likelihood that a test will be positive in the presence of a targeted disease. Sensitivity is defined as A/(A + C) [i.e., the proportion of all individuals with disease X who have a positive result on test 1 (see Fig. 12.1)], or the probability that test 1 will be positive in the presence of disease X. Test sensitivity is critical in screening for asymptomatic disease and ruling out specific diagnoses. When A is large compared to C [i.e., when A/(A + C) is greater than 0.99], relative confidence exists that if the result of test 1 is negative, an individual does not have disease X. As explained below, this alone, however, does not make any claims for what a positive test result means.
Specificity is the likelihood of a test to be negative in individuals who do not have the disease. Specificity is defined as D/(B + D) (see Fig. 12.1), the probability of a negative test result in an individual without disease X. Very specific tests often are used to confirm or rule in a suspected diagnosis. When D is very large compared to B [i.e., D/(B + D) is close to 1], a positive result is unlikely to occur in an individual who truly does not have disease X. Specificity alone does not make any claims for what a negative test result means.
BOX 12.1 Two-by-Two Table
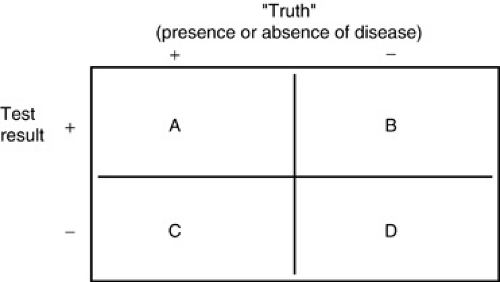
The following paragraphs refer to Figure 1, the standard two-by-two cross-tabulation frequently used to describe basic test characteristics. Suppose test 1 is designed to detect disease X. The columns in Figure 1 represent two groups of individuals: Those on the left (+) are known to have disease X; those on the right (–) are known to be free of the condition. The rows classify individuals based on results of test 1: The top row (+) counts all those whose test results were positive; the bottom row (–) counts all those whose test results were negative. Each cell (A, B, C, D) divides the group of tested individuals into four categories:
|
If the test worked perfectly, there would be 100% agreement between test results and true presence of disease (cells A and D only). This almost never occurs, which is a reminder in interpreting test results: A positive (or negative) test result does not guarantee that a disease is (or is not) present. The test helps us estimate how great a chance exists that the disease is present.
 BOX 12.1. FIGURE 1. The two-by-two cross-tabulation used to describe basic test characteristics. |
Sensitivity and specificity are further diagrammed in Figure 12.1. The vertical axis corresponds to the columns of the figure in Box 12.1. Counting up the axis represents persons from the (-) column, those without disease X, and counting down represents persons from the (+) column, persons with disease X. The horizontal axis corresponds to the rows of the figure in Box 12.1. Test values considered to be positive are on the right, and test values considered to be negative are on the left. Areas beneath the two curves represent the number of individuals in each cell of the figure in Box 12.1. Two important points about sensitivity and specificity follow.
First, for most tests, some range of results exists that is shared by individuals who have the disease and those who do not. Thus, if the definition of a positive and negative test result changes, so do the relative sizes of A, B, C, and D and, consequently, the test’s sensitivity and specificity. For most tests, a change in definition that benefits sensitivity does so at the expense of specificity, and vice versa. Only changing the test, not the definition, is likely to improve both simultaneously.
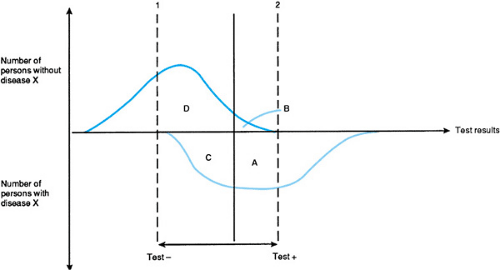 FIGURE 12.1. Sensitivity and specificity of tests (see Box 12.1). Areas enclosed by the curves and lines correspond to the number of individuals in each cell of the figure in Box 12.1. |
Second, how a test is used is determined by where the cut points are placed (dotted lines 1 and 2; see Fig. 12.1). Test results below (to the left of) the value of line 1 define a population unlikely to have disease X, whereas results above (to the right of) line 2 indicate near certainty that X is present. The following example is modified from one developed by George Comstock.
During the development of the purified protein derivative (PPD) test for tuberculosis (TB), research was directed toward
determining the optimal dose needed to detect infected individuals. Furcolow and colleagues tested increasing doses of PPD in known TB patients and in individuals who were presumed to be uninfected. A positive test result was defined as a zone of induration 10 mm in diameter surrounding the site of the PPD intradermal injection.
determining the optimal dose needed to detect infected individuals. Furcolow and colleagues tested increasing doses of PPD in known TB patients and in individuals who were presumed to be uninfected. A positive test result was defined as a zone of induration 10 mm in diameter surrounding the site of the PPD intradermal injection.
TABLE 12.1. SENSITIVITY AND SPECIFICITY OF VARYING DOSES OF PURIFIED PROTEIN DERIVATIVE AMONG CHILDREN WITH ACTIVE TUBERCULOSIS AND THOSE WITH NO KNOWN HISTORY OF EXPOSURE | ||||||||||||||||||||||||||||||||||||||||||||||||||||||
|---|---|---|---|---|---|---|---|---|---|---|---|---|---|---|---|---|---|---|---|---|---|---|---|---|---|---|---|---|---|---|---|---|---|---|---|---|---|---|---|---|---|---|---|---|---|---|---|---|---|---|---|---|---|---|
| ||||||||||||||||||||||||||||||||||||||||||||||||||||||
Table 12.1 shows the proportions of persons in each group testing positive at increasing doses of PPD. A dose of 10-4 mg appears to be a good dose for screening purposes; it identifies more than 99% of TB patients, while mistakenly showing positive results for only 8.5% of those who are not infected. This dose is equivalent to the standard 5-tuberculin-unit dose of PPD commonly used for screening today.
TB screening is more complicated, however, because in some parts of the world, false-positive PPD test results come from exposure to nontuberculous mycobacteria. In some parts of the southeastern United States, more than 70% of persons tested have PPD reactions indicating such exposure, which could make diagnosing or screening for TB difficult in such an area. PPD reactions to nontuberculous mycobacteria, however, are usually smaller than reactions to TB. Thus, the use of different cut points for screening and for diagnosis has been workable.
Figure 12.2 shows the distribution of reaction sizes to 5-tuberculin-unit PPD testing in three populations. Figure 2A shows tests results in persons with culture-proven TB; Fig. 2B shows results from Navy recruits who reported household contact with TB; and Fig. 2C shows results from recruits who did not report contacts. Dotted line 1 is at a reaction size of 5 mm, the recommended cut point for confirmatory diagnosis in patients with a history of TB exposure or with an abnormal chest roentgenogram. Applying this cut point to the population in Figure 2C, however, results in a large number of false-positive results, with the error rate increasing along with prevalence of nontuberculous mycobacteria. Thus, the recommended screening cut point is shown at dotted line 2 (10 mm), which may miss some real cases of TB (hypothetically shown in black) but greatly reduces the number of false-positive results. Some experts believe that cut points higher than 10 mm may be indicated in populations with high rates of nontuberculous infection and no history of exposure to TB.
Predictive Value
Usually, it is not enough to know that a test is very sensitive or very specific. What the clinician wants to know is how much confidence there is that a positive test result really means that disease is present or that a negative result really means that disease is absent. The most basic way to express this confidence is with two quantities, the test’s positive and negative predictive values. Positive predictive value is the proportion of persons who test positive on test 1 and who actually have disease X, or A/(A + B) (see Box 1), or the probability that disease X will be present, given a positive test result. The negative predictive value is D/(C + D) (see Box 1), or the probability that disease is not present, given a negative test result.
Stay updated, free articles. Join our Telegram channel

Full access? Get Clinical Tree


