Type 1: β-Cell destruction, usually absolute insulin deficiency
Immune-mediated
Idiopathic
Type 2: Ranges from predominantly insulin resistance to predominantly an insulin secretory defect with insulin resistance
Other types
Genetic mutations of β-cell function—MODY 1–6, others
Genetic defects in insulin action
Genetic syndromes—Down, Klinefelter, Turner
Diseases of the exocrine pancreas—pancreatitis, cystic fibrosis
Endocrinopathies—Cushing syndrome, pheochromocytoma, others
Drug or chemical induced—glucocorticosteroids, thiazides, β-adrenergic agonists, others
Infections—congenital rubella, cytomegalovirus, coxsackievirus
Gestational diabetes
 Classification During Pregnancy
Diabetes is the most common medical complication of pregnancy. Women can be separated into those who were known to have diabetes before pregnancy—pregestational or overt, and those diagnosed during pregnancy—gestational diabetes. The incidence of diabetes complicating pregnancy increased approximately 40 percent between 1989 and 2004 (Getahun, 2008). In 2006, slightly more than 179,000—4.2 percent—of American women had pregnancies coexistent with some form of diabetes (Martin, 2009). African American, Native American, Asian, and Hispanic women are at higher risk for gestational diabetes compared with white women (Ferrara, 2007). The increasing incidence of gestational diabetes during the past 15 years, shown in Figure 57-1, is reminiscent of similar statistics for obesity (Chap. 48, p. 961).
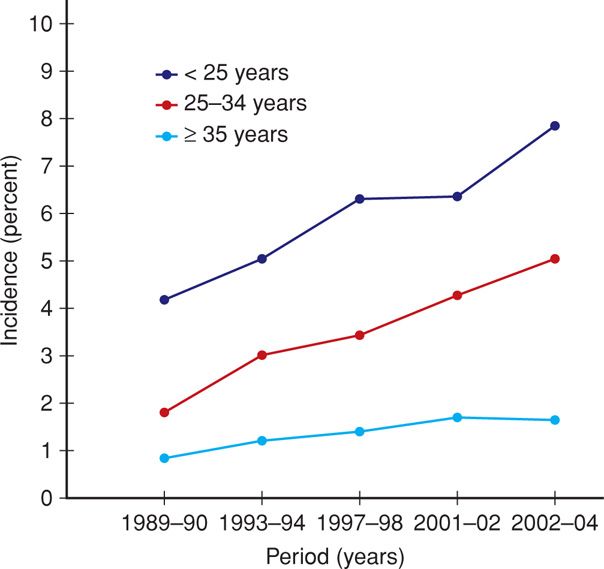
FIGURE 57-1 Age-specific incidence of gestational diabetes from National Hospital Discharge Survey Data of nearly 59 million births in the United States from 1989 to 2004. (Redrawn from Getahun, 2008.)
 White Classification in Pregnancy
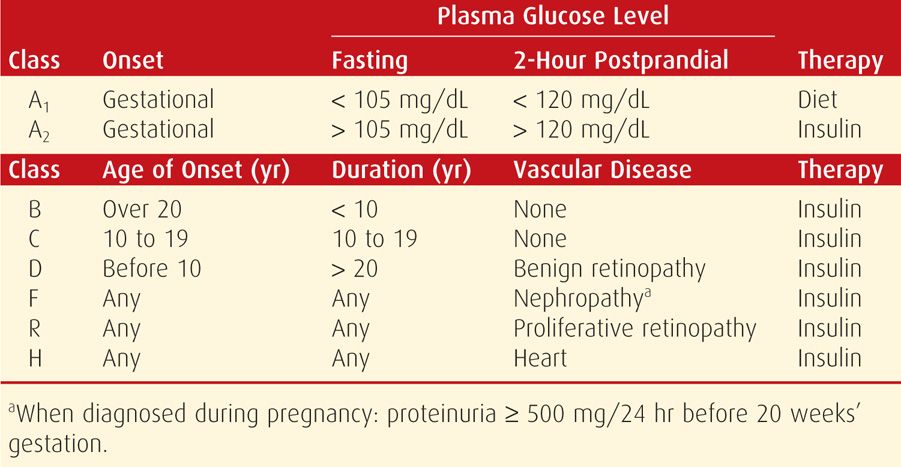
Until the mid-1990s, the classification by Priscilla White for diabetic pregnant women was the linchpin of management. Today, the White classification is used less frequently, but its role remains important. And because most currently cited literature contains data from these older classifications, the one previously recommended by the American College of Obstetricians and Gynecologists (1986) is provided in Table 57-2.
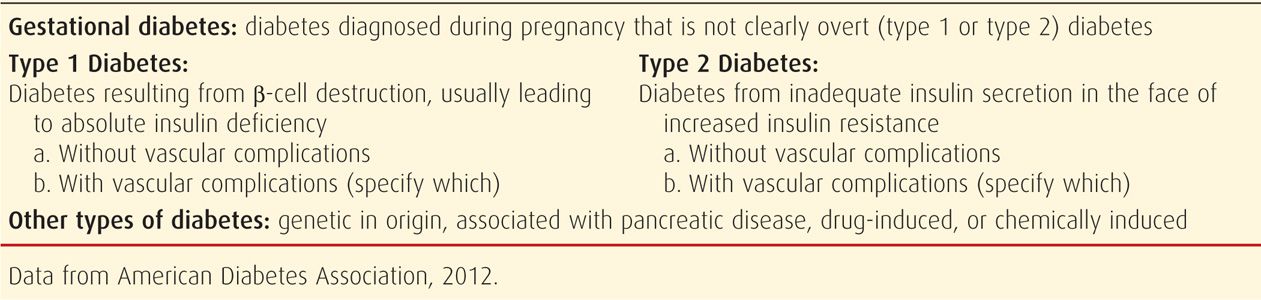
Beginning several years ago, the American College of Obstetricians and Gynecologists (2012, 2013) no longer recommended the White classification. Instead, the current focus is whether diabetes antedates pregnancy or is first diagnosed during pregnancy. Many now recommend adoption of the classification proposed by the American Diabetes Association (ADA), as shown in Table 57-3.
PREGESTATIONAL DIABETES
The increasing prevalence of type 2 diabetes in general, and in younger people in particular, has led to an increasing number of affected pregnancies (Ferrara, 2007). In Los Angeles County, Baraban and coworkers (2008) reported that the age-adjusted prevalence tripled from 14.5 cases per 1000 women in 1991 to 47.9 cases per 1000 in 2003. Thus, the number of pregnant women with diabetes that was undiagnosed before pregnancy is increasing. Many women found to have gestational diabetes are likely to have type 2 diabetes that has previously gone undiagnosed (Feig, 2002). In fact, 5 to 10 percent of women with gestational diabetes are found to have diabetes immediately after pregnancy.
 Diagnosis
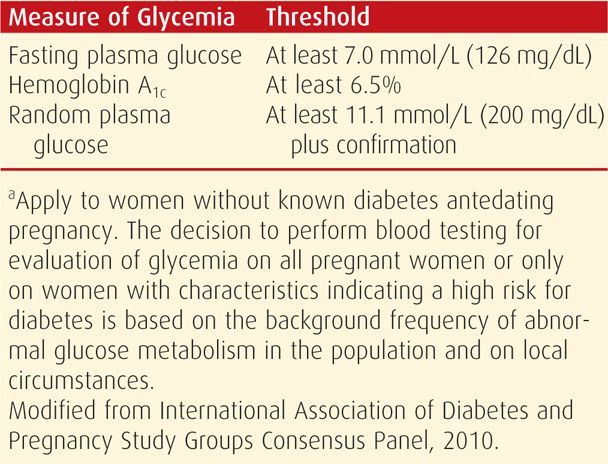
Women with high plasma glucose levels, glucosuria, and ketoacidosis present no problem in diagnosis. Similarly, women with a random plasma glucose level > 200 mg/dL plus classic signs and symptoms such as polydipsia, polyuria, and unexplained weight loss or those with a fasting glucose level exceeding 125 mg/dL are considered by the ADA (2012) to have overt diabetes. Women with only minimal metabolic derangement may be more difficult to identify. To diagnose overt diabetes in pregnancy, The International Association of Diabetes and Pregnancy Study Groups (IADPSG) Consensus Panel (2010) recommends threshold values for fasting or random plasma glucose and glycosylated hemoglobin (A1c) levels at prenatal care initiation (Table 57-4). There was no consensus on whether such testing should be universal or limited to those women classified as high risk. Regardless, the tentative diagnosis of overt diabetes during pregnancy based on these thresholds should be confirmed postpartum. Risk factors for impaired carbohydrate metabolism in pregnant women include a strong familial history of diabetes, prior delivery of a large newborn, persistent glucosuria, or unexplained fetal losses.
 Impact on Pregnancy
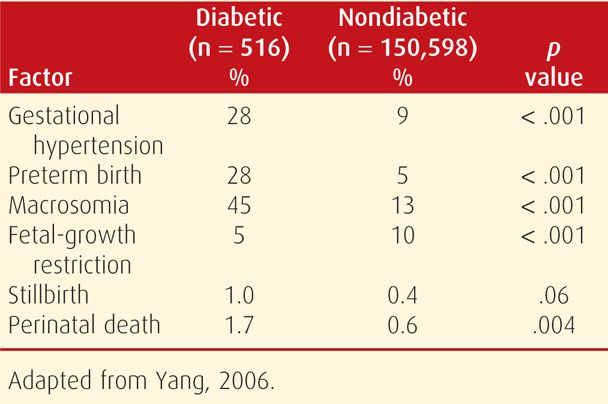
With pregestational—or overt—diabetes, the embryo, fetus, and mother frequently experience serious complications directly attributable to diabetes. The likelihood of successful outcomes with overt diabetes is related somewhat to the degree of glycemic control, but more importantly, to the degree of underlying cardiovascular or renal disease. Thus, advancing stages of the White classification, seen in Table 57-2, are inversely related to favorable pregnancy outcomes. As an example shown in Table 57-5, data from Yang and associates (2006) chronicles the deleterious pregnancy outcomes of overt diabetes. These maternal and fetal complications are described in the following sections.
TABLE 57-5. Pregnancy Outcomes of Births in Nova Scotia from 1988 to 2002 in Women with and without Pregestational Diabetes
Fetal Effects
Spontaneous Abortion. Several studies have shown that early miscarriage is associated with poor glycemic control. In 215 women with type 1 diabetes enrolled for prenatal care before 9 weeks’ gestation, 24 percent had an early pregnancy loss (Rosenn, 1994). Only those whose initial glycohemoglobin A1c concentrations were > 12 percent or whose preprandial glucose concentrations were persistently > 120 mg/dL were at increased risk. In another analysis of 127 Spanish women with pregestational diabetes, poor glycemic control, defined by glycohemoglobin A1c concentrations > 7 percent, was associated with a threefold increase in the spontaneous abortion rate (Galindo, 2006).
Preterm Delivery. Overt diabetes is an undisputed risk factor for preterm birth. Eidem and associates (2011) analyzed 1307 births in women with pregestational type 1 diabetes from the Norwegian Medical Birth Registry. More than 26 percent were delivered preterm compared with 6.8 percent in the general obstetrical population. Moreover, almost 60 percent were indicated preterm births, that is, due to obstetrical or medical complications. In the Canadian study shown in Table 57-5, the incidence of preterm birth was 28 percent—a fivefold increase compared with that of their normal population.
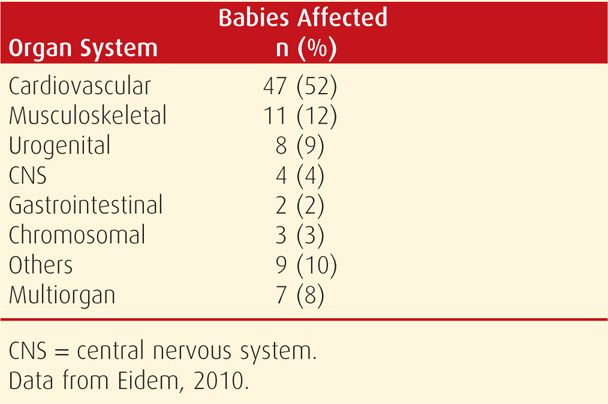
Malformations. The incidence of major malformations in women with type 1 diabetes is doubled and approximates 5 percent (Eidem, 2010; Sheffield, 2002). These account for almost half of perinatal deaths in diabetic pregnancies. A twofold increased risk of major congenital defects in Norwegian women with pregestational type 1 diabetes included cardiovascular malformations that accounted for more than half of the anomalies (Table 57-6). In the National Birth Defects Prevention Study, the risk of an isolated cardiac defect was fourfold higher in women with pregestational diabetes compared with the twofold increased risk of noncardiac defects (Correa, 2008). The caudal regression sequence is a rare malformation frequently associated with maternal diabetes (Garne, 2012).
TABLE 57-6. Congenital Anomalies in Fetuses of 91 Women with Type 1 Diabetes between 1999 and 2004 in Norway
Poorly controlled diabetes, both preconceptionally and early in pregnancy, is thought to underlie this increased severe-malformation risk. As shown in Figure 57-2, Galindo and colleagues (2006) demonstrated a clear correlation between increased maternal glycohemoglobin A1c at first prenatal visit and major malformations. Eriksson (2009) concluded that the etiology was multifactorial. At least three interrelated molecular chain reactions have been linked to maternal hyperglycemia and can potentially explain the mechanism behind poor glycemic control and increased risk for major malformations (Reece, 2012). These include alterations in cellular lipid metabolism, excess production of toxic superoxide radicals, and activation of programmed cell death. For example, Morgan and associates (2008) demonstrated that hyperglycemia-induced oxidative stress inhibited migration of cardiac neural-crest cells in embryos of diabetic mice.
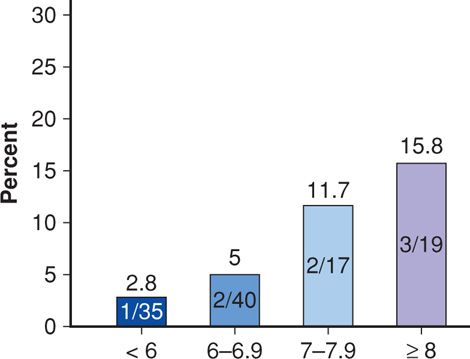
FIGURE 57-2 The frequency of major congenital malformations in newborns of women with pregestational diabetes stratified by hemoglobin A1c levels at first prenatal visit. (Data from Galindo, 2006.)
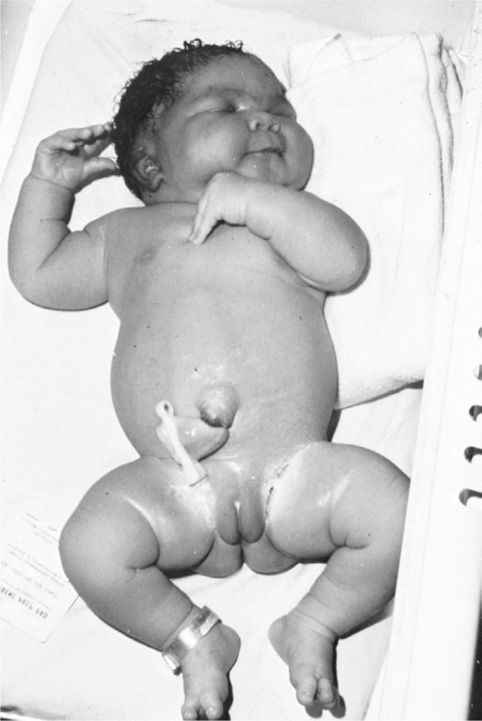
Altered Fetal Growth. Diminished growth may result from congenital malformations or from substrate deprivation due to advanced maternal vascular disease. However, fetal overgrowth is more typical of pregestational diabetes. Maternal hyperglycemia prompts fetal hyperinsulinemia, particularly during the second half of gestation. This in turn stimulates excessive somatic growth or macrosomia. Except for the brain, most fetal organs are affected by the macrosomia that characterizes the fetus of a diabetic woman. Such infants are described as being anthropometrically different from other large-for-gestational age (LGA) infants (Durnwald, 2004; McFarland, 2000). Specifically, those whose mothers are diabetic have excessive fat deposition on the shoulders and trunk, which predisposes to shoulder dystocia or cesarean delivery (Fig. 57-3).
The incidence of macrosomia rises significantly when mean maternal blood glucose concentrations chronically exceed 130 mg/dL (Hay, 2012). Hammoud and coworkers (2013) reported that the macrosomia rates for Nordic women with type 1, type 2, or gestational diabetes were 35 percent, 28 percent, and 24 percent, respectively. As shown in Figure 57-4, the birthweight distribution of neonates of diabetic mothers is skewed toward consistently heavier birthweights compared with that of normal pregnancies.
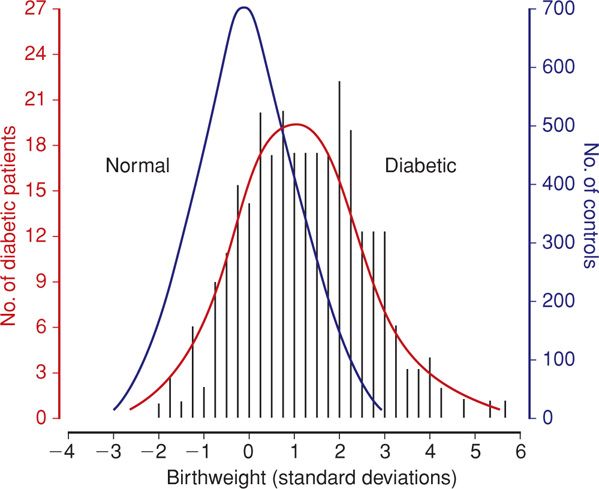
FIGURE 57-4 Distribution of birthweight standard deviation from the normal mean for gestational age in 280 infants of diabetic mothers and in 3959 infants of nondiabetic mothers. (From Bradley, 1988, with permission.)
In the study by Hammoud and colleagues (2013), fetal growth profiles from 897 sonographic examinations in 244 women with diabetes were compared with 843 examinations in 145 control women. The abdominal circumference evolved differently in the diabetic groups. Analysis of head circumference/abdominal circumference (HC/AC) ratios shows that this disproportionate growth occurs mainly in diabetic pregnancies that ultimately yield macrosomic newborns (Fig. 57-5). These findings comport with the observation that virtually all neonates of diabetic mothers are growth promoted. Ben-Haroush and associates (2007) analyzed fetal sonographic measurements between 29 and 34 weeks’ gestation in 423 diabetic pregnancies and found that accelerated fetal growth was particularly evident in women with poor glycemic control.
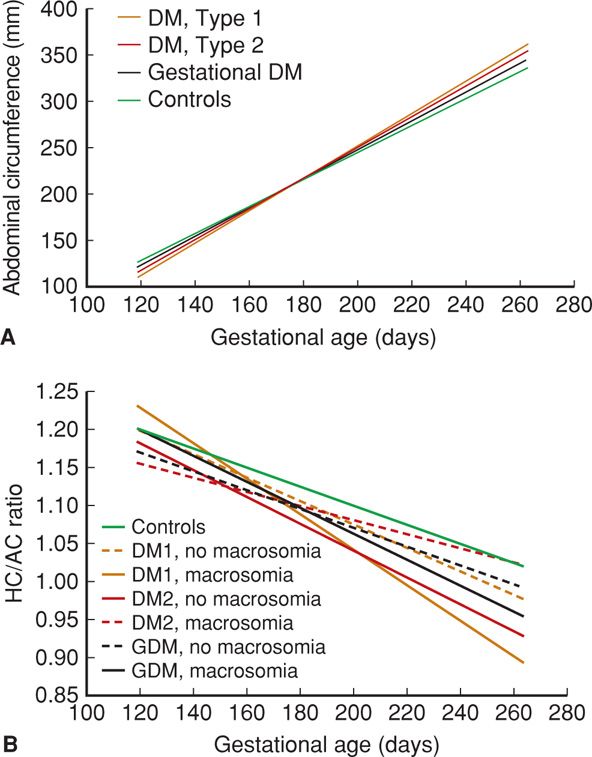
FIGURE 57-5 Comparison of sonographic fetal anatomic measurements by gestational age and subdivided according to presence or absence of macrosomia among women with various types of diabetes types and controls. A. Abdominal circumference measurements. B. Head circumference (HC)/Abdominal circumference (AC) ratio. DM = diabetes mellitus; GDM = gestational diabetes mellitus. (Redrawn from Hammoud, 2013, with permission.)
Unexplained Fetal Demise. The risk of fetal death is three to four times higher in women with type 1 diabetes compared with that of the general obstetrical population (Eidem, 2011). Stillbirth without an identifiable cause is a phenomenon relatively limited to pregnancies complicated by overt diabetes. These stillbirths are “unexplained” because common factors such as obvious placental insufficiency, abruption, fetal-growth restriction, or oligohydramnios are not identified. These infants are typically LGA and die before labor, usually after 35 weeks’ gestation or later (Garner, 1995).
These unexplained stillbirths are associated with poor glycemic control. Lauenborg and coworkers (2003) identified suboptimal glycemic control in two thirds of unexplained stillbirths between 1990 and 2000. Also, fetuses of diabetic mothers often have elevated lactic acid levels. Salvesen and colleagues (1992, 1993) analyzed fetal blood samples and reported that mean umbilical venous blood pH was lower in diabetic pregnancies and was significantly related to fetal insulin levels. Such findings support the hypothesis that hyperglycemia-mediated chronic aberrations in oxygen and fetal metabolite transport may underlie these unexplained fetal deaths (Pedersen, 1977). However, the exact mechanisms by which uncontrolled hyperglycemia leads to elevated lactic acid levels and fetal acidosis remain unclear.
Explicable stillbirths due to placental insufficiency also occur with increased frequency in women with overt diabetes, usually in association with severe preeclampsia. In a retrospective analysis of more than 500,000 singleton deliveries, Yanit and associates (2012) found that the fetal death risk was sevenfold higher in women with hypertension and pregestational diabetes compared with the threefold increased risk associated with diabetes alone. Stillbirth is also increased in women with advanced diabetes and vascular complications. Maternal ketoacidosis can also cause fetal death.
Hydramnios. Diabetic pregnancies are often complicated by excess amnionic fluid. According to Idris and coworkers (2010), 18 percent of 314 women with pregestational diabetes were identified with hydramnios, defined as an amnionic fluid index (AFI) greater than 24 cm in the third trimester. A likely—albeit unproven—explanation is that fetal hyperglycemia causes polyuria (Chap. 11, p. 234). In a study from Parkland Hospital, Dashe and colleagues (2000) found that the AFI parallels the amnionic fluid glucose level among women with diabetes. This finding suggests that the hydramnios associated with diabetes is a result of increased amnionic fluid glucose concentration. Further support for this hypothesis was provided by Vink and associates (2006), who linked poor maternal glucose control to macrosomia and hydramnios. In their retrospective analysis of diabetic pregnancies, Idris and coworkers (2010) also found that women with elevated glycohemoglobin A1c values in the third trimester were more likely to have hydramnios.
Neonatal Effects. Before tests of fetal health and maturity became available, delivery before term was deliberately selected for women with diabetes to avoid unexplained fetal death. Although this practice has been abandoned, there is still an increased frequency of preterm delivery in women with diabetes. Most are due to advanced diabetes with superimposed preeclampsia. Thankfully, modern neonatal care has largely eliminated neonatal deaths due to immaturity. Conversely, neonatal morbidity due to preterm birth continues to be a serious consequence.
Respiratory Distress Syndrome. Historically, newborns of diabetic mothers were thought to be at increased risk for respiratory distress from delayed lung maturation. Subsequent observations challenged this concept, and gestational age rather than overt diabetes is likely the most significant factor associated with respiratory distress syndrome. Indeed, in their analysis of 19,399 very-low-birthweight neonates delivered between 24 and 33 weeks’ gestation, Bental and colleagues (2011) were unable to demonstrate an increased rate of respiratory distress syndrome in newborns of diabetic mothers. This is discussed further in Chapter 33 (p. 637).
Hypoglycemia. Newborns of a diabetic mother experience a rapid drop in plasma glucose concentration after delivery. This is attributed to hyperplasia of the fetal β-islet cells induced by chronic maternal hyperglycemia. Low glucose concentrations—defined as < 45 mg/dL—are particularly common in newborns of women with unstable glucose concentrations during labor (Persson, 2009). In a recent analysis of prenatal outcomes during a 20-year period in Finnish women with type 1 diabetes, the incidence of neonatal hypoglycemia declined significantly over time (Klemetti, 2012). The authors attributed this to frequent blood glucose measurements and active early feeding practices in such neonates. Prompt recognition and treatment of the hypoglycemic newborn minimizes adverse sequelae.
Hypocalcemia. Defined as a total serum calcium concentration < 8 mg/dL in term newborns, hypocalcemia is one of the potential metabolic derangements in neonates of diabetic mothers. Its cause has not been explained. Theories include aberrations in magnesium–calcium economy, asphyxia, and preterm birth. In a randomized study by DeMarini and associates (1994), 137 pregnant women with type 1 diabetes were managed with strict versus customary glucose control. Almost a third of neonates in the customary control group developed hypocalcemia compared with only 18 percent of those in the strict control group.
Hyperbilirubinemia and Polycythemia. The pathogenesis of hyperbilirubinemia in neonates of diabetic mothers is uncertain. A major contributing factor is newborn polycythemia, which increases the bilirubin load (Chap. 33, p. 643). Polycythemia is thought to be a fetal response to relative hypoxia. According to Hay (2012), the sources of this fetal hypoxia are hyperglycemia-mediated increases in maternal affinity for oxygen and fetal oxygen consumption. Together with insulin-like growth factors, this hypoxia leads to increased fetal erythropoietin levels and red cell production. Venous hematocrits of 65 to 70 volume percent have been observed in up to 40 percent of these newborns (Salvesen, 1992). Renal vein thrombosis is reported to result from polycythemia.
Cardiomyopathy. Infants of diabetic pregnancies may have hypertrophic cardiomyopathy that primarily affects the interventricular septum (Rolo, 2011). In severe cases, this cardiomyopathy may lead to obstructive cardiac failure. Russell and coworkers (2008) performed serial echocardiograms on fetuses of 26 women with pregestational diabetes. In the first trimester, fetal diastolic dysfunction was evident compared with that of nondiabetic controls. In the third trimester, the fetal interventricular septum and right ventricular wall were thicker in fetuses of diabetic mothers. The authors concluded that cardiac dysfunction precedes these structural changes. Fortunately, most affected newborns are asymptomatic following birth, and hypertrophy resolves in the months after delivery. Relief from maternal hyperglycemia is presumed to promote this resolution (Hornberger, 2006). Conversely, fetal cardiomyopathy may progress to adult cardiac disease.
Long-Term Cognitive Development. Intrauterine metabolic conditions have long been linked to neurodevelopment in offspring. This may also be true in children of diabetic mothers. Despite rigorous antepartum management, Rizzo and colleagues (1995) found numerous correlations between maternal glycemia and intellectual performance in children up to age 11 years in 139 offspring of diabetic women. In a study of more than 700,000 Swedish-born men, the intelligence quotient of those whose mothers had diabetes during pregnancy averaged 1 to 2 points lower (Fraser, 2014). DeBoer and associates (2005) demonstrated impaired memory performance in infants of diabetic mothers at age 1 year. Finally, results from the Childhood Autism Risks from Genetics and the Environment (CHARGE) study indicated that autism spectrum disorders or developmental delay were more common in children of diabetic women (Krakowiak, 2012). Although interpreting effects of the intrauterine environment on neurodevelopment is certainly confounded by postnatal events, emerging data at least support a link between maternal diabetes, glycemic control, and neurocognitive outcome.
Inheritance of Diabetes. The risk of developing type 1 diabetes if either parent is affected is 3 to 4 percent. Type 2 diabetes has a much stronger genetic component. If both parents have type 2 diabetes, the risk of developing it approaches 40 percent. McKinney and coworkers (1999) studied 196 children with type 1 diabetes and found that older maternal age and maternal type 1 diabetes are important risk factors. Plagemann and colleagues (2002) have implicated breast feeding by diabetic mothers in the genesis of childhood diabetes. Conversely, breast feeding has also been associated with a reduced risk of type 2 diabetes (Owen, 2006). The Trial to Reduce Insulin-dependent Diabetes Mellitus in the Genetically At Risk (TRIGR) was designed to analyze hydrolyzed formula use, rather than breast milk, to reduce rates of type 1 diabetes in at-risk children by age 10. This study will be complete in 2017 (Knip, 2011).
Maternal Effects
Diabetes and pregnancy interact significantly such that maternal welfare can be seriously jeopardized. With the possible exception of diabetic retinopathy, however, the long-term course of diabetes is not affected by pregnancy.
Maternal death is uncommon, but rates in women with diabetes are still increased. In an analysis of 972 women with type 1 diabetes, Leinonen and associates (2001) reported a maternal mortality rate of 0.5 percent. Deaths resulted from diabetic ketoacidosis, hypoglycemia, hypertension, and infection. Especially morbid is ischemic heart disease. Pombar and coworkers (1995) reviewed 17 women with coronary artery disease—class H diabetes—and reported that only half survived pregnancy.
Preeclampsia. Hypertension that is induced or exacerbated by pregnancy is the complication that most often forces preterm delivery in diabetic women. The incidence of chronic and gestational hypertension—and especially preeclampsia—is remarkably increased in diabetic mothers. In the study cited earlier by Yanit and colleagues (2012), preeclampsia developed three to four times more often in women with overt diabetes. Moreover, those diabetics with coexistent chronic hypertension were almost 12 times more likely to develop preeclampsia. Special risk factors for preeclampsia include any vascular complication and preexisting proteinuria, with or without chronic hypertension. As shown in Figure 57-6, women with type 1 diabetes who are in more advanced White classes of overt diabetes increasingly developed preeclampsia. This increasing risk with duration of diabetes may be related to oxidative stress, which plays a key role in the pathogenesis of diabetic complications and preeclampsia. With this in mind, the Diabetes and Preeclampsia Intervention Trial (DAPIT) randomly assigned 762 women with type 1 diabetes to antioxidant vitamin C and E supplementation or placebo in the first half of pregnancy (McCance, 2010). There were no differences in preeclampsia rates except in a few women with a low antioxidant status at baseline. Temple and coworkers (2006) prospectively studied hemoglobin A1c levels at 24 weeks’ gestation in 290 women with type 1 diabetes and found that preeclampsia was related to glucose control. Management of preeclampsia is discussed in Chapter 40 (p. 749).
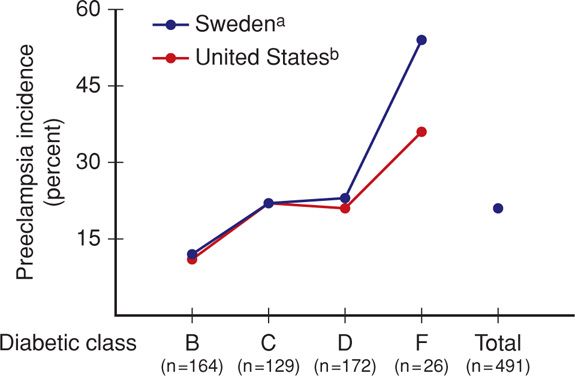
FIGURE 57-6 Incidence of preeclampsia in 491 type 1 diabetic women in Sweden and the United States. (Data from Hansona, 1993; Sibaib, 2000.)
Diabetic Nephropathy. Diabetes is the leading cause of end-stage renal disease in the United States (Chap. 53, p. 1060). Clinically detectable nephropathy begins with microalbuminuria—30 to 300 mg/24 hours. This may manifest as early as 5 years after diabetes onset. Macroalbuminuria—more than 300 mg/24 hours—develops in patients destined to have end-stage renal disease. Hypertension almost invariably develops during this period, and renal failure ensues typically in the next 5 to 10 years. The incidence of overt proteinuria is nearly 30 percent in individuals with type 1 diabetes and ranges from 4 to 20 percent in those with type 2 diabetes (Reutens, 2013). Progression from microalbuminuria is not inexorable, and regression is common. Presumably from improved glucose control, the incidence of nephropathy in individuals with type 1 diabetes has declined in the past few decades. Investigators for the Diabetes Control and Complications Trial (2002) reported that there was a 25-percent decrease in the rate of nephropathy for each 10-percent decrease in hemoglobin A1c levels.
Approximately 5 percent of pregnant women with diabetes already have renal involvement. Approximately 40 percent of these will develop preeclampsia (Vidaeff, 2008). High rates are also illustrated in Figure 57-6. However, this may not be the case with microproteinuria. In one analysis of 460 women, How and colleagues (2004) found no association between preeclampsia and microproteinuria. Nevertheless, they found that chronic hypertension with overt diabetic nephropathy increased the risk of preeclampsia to 60 percent.
In general, pregnancy does not appear to worsen diabetic nephropathy. In their prospective study of 43 women with diabetes, Young and associates (2012) could not demonstrate diabetic nephropathy progression through 12 months after delivery. Most of these women had only mild renal impairment. Conversely, pregnancy in women with moderate to severe renal impairment may accelerate progression of their disease (Vidaeff, 2008). As in women with glomerulopathies, hypertension or substantial proteinuria before or during pregnancy is a major predictive factor for progression to renal failure in women with diabetic nephropathy (Chap. 53, p. 1062).
Diabetic Retinopathy. Retinal vasculopathy is a highly specific complication of both type 1 and type 2 diabetes. In the United States, diabetic retinopathy is the most important cause of visual impairment in persons younger than age 60 years (Frank, 2004). The first and most common visible lesions are small microaneurysms followed by blot hemorrhages that form when erythrocytes escape from the aneurysms. These areas leak serous fluid that creates hard exudates. Such features are termed benign or background or nonproliferative retinopathy. With increasingly severe retinopathy, the abnormal vessels of background eye disease become occluded, leading to retinal ischemia and infarctions that appear as cotton wool exudates. These are considered preproliferative retinopathy. In response to ischemia, there is neovascularization on the retinal surface and out into the vitreous cavity. Vision is obscured when there is hemorrhage. Laser photocoagulation before hemorrhage, as shown in Figure 57-7, reduces the rate of visual loss progression and blindness by half. The procedure is performed during pregnancy when indicated.
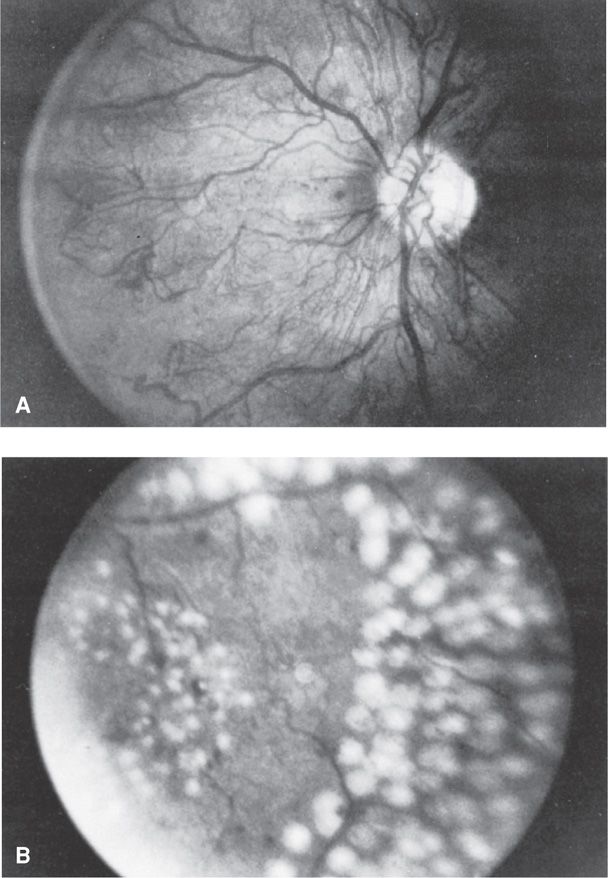
FIGURE 57-7 Retinal photographs from a 30-year-old diabetic woman. A. Optic nerve head showing severe proliferative retinopathy characterized by extensive networks of new vessels surrounding the optic disc. B. A portion of the acute photocoagulation full “scatter” pattern following argon laser treatment. (From Elman, 1990, with permission.)
Vestgaard and coworkers (2010) reported that almost two thirds of 102 pregnant women with type 1 diabetes examined by 8 weeks’ gestation had background retinal changes, proliferative retinopathy, or macular edema. A fourth of these women developed progression of retinopathy in at least one eye. The same group of investigators evaluated 80 type 2 diabetics and identified retinopathy, mostly mild, in 14 percent during early pregnancy. Progression was identified in only 14 percent (Rasmussen, 2010). This complication is believed to be a rare example of a long-term adverse effect of pregnancy. However, in a prospective postpartum 5-year surveillance of 59 type 1 diabetic women, Arun and Taylor (2008) found that baseline retinopathy was the only independent risk factor for progression.
Other risk factors that have been associated with progression of retinopathy include hypertension, higher levels of insulin-like growth factor-I, and macular edema identified in early pregnancy (Bargiota, 2011; Mathiesen, 2012; Ringholm, 2011; Vestgaard, 2010). The National Institute for Health and Clinical Excellence (2008) established guidelines recommending that pregnant women with preexisting diabetes should routinely be offered retinal assessment after the first prenatal visit. Currently, most agree that laser photocoagulation and good glycemic control during pregnancy minimize the potential for deleterious effects of pregnancy.
Ironically, “acute” rigorous metabolic control during pregnancy has been linked to acute worsening of retinopathy. In a study of 201 women with retinopathy, McElvy and associates (2001) found that almost 30 percent suffered eye disease progression during pregnancy despite intensive glucose control. That said, Wang and coworkers (1993) have observed that retinopathy worsened during the critical months of rigorous glucose control, but long term, deterioration of eye disease slowed. In their study mentioned above, Arun and Taylor (2008) found that only four women required laser photocoagulation during pregnancy, and none required laser in the next 5 years.
Diabetic Neuropathy. Peripheral symmetrical sensorimotor diabetic neuropathy is uncommon in pregnant women. But a form of this, known as diabetic gastropathy, is troublesome during pregnancy. It causes nausea and vomiting, nutritional problems, and difficulty with glucose control. Women with gastroparesis should be advised that this complication is associated with a high risk of morbidity and poor perinatal outcome (Kitzmiller, 2008). Treatment with metoclopramide and H2-receptor antagonists is sometimes successful. Hyperemesis gravidarum is further discussed in Chapter 54 (p. 1070).
Diabetic Ketoacidosis. This serious complication develops in approximately 1 percent of diabetic pregnancies (Hawthorne, 2011). It is most often encountered in women with type 1 diabetes. It is increasingly being reported in women with type 2 or even those with gestational diabetes (Sibai, 2014). Diabetic ketoacidosis (DKA) may develop with hyperemesis gravidarum, β-mimetic drugs given for tocolysis, infection, and corticosteroids given to induce fetal lung maturation. DKA results from an insulin deficiency combined with an excess in counter-regulatory hormones such as glucagon. This leads to gluconeogenesis and ketone body formation. The ketone body β-hydroxybutyrate is synthesized at a much greater rate than acetoacetate, which is preferentially detected by commonly used ketosis detection methodologies. Therefore, serum or plasma assays for β-hydroxybutyrate more accurately reflect true ketone body levels.
The incidence of fetal loss can be as high as 20 percent with DKA. Noncompliance is a prominent factor, and this and ketoacidosis were historically considered prognostically bad signs in pregnancy (Pedersen, 1974). Pregnant women usually develop ketoacidosis at lower blood glucose thresholds than when nonpregnant. In a study from China, the mean glucose level for pregnant women with DKA was 293 mg/dL compared with 495 mg/dL for nonpregnant women (Guo, 2008). Chico and associates (2008) reported ketoacidosis in a pregnant woman whose plasma glucose was only 87 mg/dL.
One management protocol for diabetic ketoacidosis is shown in Table 57-7. An important cornerstone of management is vigorous rehydration with crystalloid solutions of normal saline or Ringer lactate.
TABLE 57-7. Protocol Recommended by the American College of Obstetricians and Gynecologists (2012) for Management of Diabetic Ketoacidosis During Pregnancy
Laboratory assessment
Obtain arterial blood gases to document degree of acidosis present; measure glucose, ketones, and electrolyte levels at 1- to 2-hour intervals
Insulin
Low-dose, intravenous
Loading dose: 0.2–0.4 U/kg
Maintenance: 2–10 U/hr
Fluids
Isotonic sodium chloride
Total replacement in first 12 hours of 4–6 L
1 L in first hour
500–1000 mL/hr for 2–4 hours
250 mL/hr until 80 percent replaced
Glucose
Begin 5-percent dextrose in normal saline when glucose plasma level reaches 250 mg/dL (14 mmol/L)
Potassium
If initially normal or reduced, an infusion rate up to 15–20 mEq/hr may be required; if elevated, wait until levels decrease into the normal range, then add to intravenous solution in a concentration of 20–30 mEq/L
Bicarbonate
Add one ampule (44 mEq) to 1 L of 0.45 normal saline if pH is < 7.1
Infections. Almost all types of infections are increased in diabetic pregnancies. Stamler and coworkers (1990) reported that almost 80 percent of women with type 1 diabetes develop at least one infection during pregnancy compared with only 25 percent in those without diabetes. Common infections include Candida vulvovaginitis, urinary and respiratory tract infections, and puerperal pelvic sepsis. In their population-based study of almost 200,000 pregnancies, Sheiner and colleagues (2009) found a twofold increased risk of asymptomatic bacteruria in women with diabetes. Similarly, Alvarez and associates (2010) reported positive urine cultures in a fourth of diabetic women compared with 10 percent of nondiabetic pregnant women. In a 2-year analysis of pyelonephritis at Parkland Hospital, 5 percent of women with diabetes developed pyelonephritis compared with 1.3 percent of the nondiabetic population (Hill, 2005). Fortunately, these latter infections can be minimized by screening and eradication of asymptomatic bacteriuria (Chap. 53, p. 1053). Takoudes and colleagues (2004) found that pregestational diabetes is associated with a two- to threefold increase in wound complications after cesarean delivery.
 Management of Diabetes in Pregnancy
Because of the relationship between pregnancy complications and maternal glycemic control, efforts to achieve glucose targets are typically more aggressive during pregnancy. Management preferably should begin before pregnancy and include specific goals during each trimester.
Preconceptional Care
To minimize early pregnancy loss and congenital malformations in offspring of diabetic mothers, optimal medical care and education are recommended before conception (Chap. 8, p. 157). Unfortunately, nearly half of pregnancies in the United States are unplanned, and many diabetic women frequently begin pregnancy with suboptimal glucose control (Finer, 2011; Kim, 2005).
The ADA has defined optimal preconceptional glucose control using insulin to include self-monitored preprandial glucose levels of 70 to 100 mg/dL, peak postprandial values of 100 to 129 mg/dL, and mean daily glucose concentrations < 110 mg/dL (Kitzmiller, 2008). Glycosylated hemoglobin measurement, which reflects an average of circulating glucose for the past 4 to 8 weeks, is useful to assess early metabolic control. The ADA (2012) defines optimal values to be < 7 percent. In their prospective population-based study of 933 pregnant women with type 1 diabetes, Jensen and colleagues (2010) found the risk of congenital malformations was not demonstrably higher with glycosylated hemoglobin levels < 6.9 percent compared with that in more than 70,000 nondiabetic controls. They also identified a substantial fourfold increased risk for malformations at levels > 10 percent.
If indicated, evaluation and treatment for diabetic complications such as retinopathy or nephropathy should also be instituted before pregnancy. Finally, folate, 400 μg/day orally is given periconceptionally and during early pregnancy to decrease the risk of neural-tube defects.
First Trimester
Careful monitoring of glucose control is essential. For this reason, many clinicians hospitalize overtly diabetic women during early pregnancy to initiate an individualized glucose control program and offer education. It also provides an opportunity to assess the extent of diabetic vascular complications and precisely establish gestational age.
Insulin Treatment
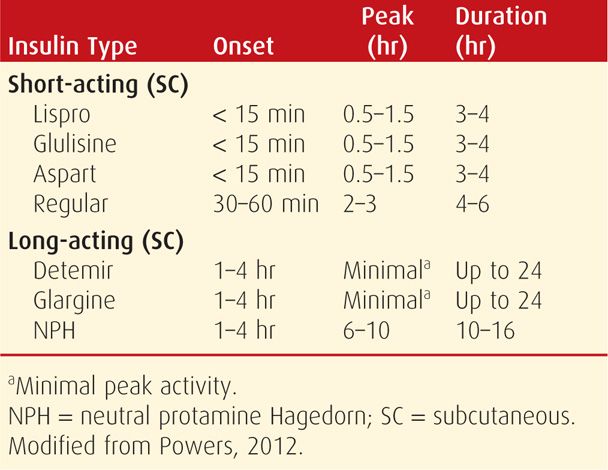
The overtly diabetic pregnant woman is best treated with insulin. Although oral hypoglycemic agents have been used successfully for gestational diabetes (p. 1141), these agents are not currently recommended for overt diabetes except for limited and individualized use (American College of Obstetricians and Gynecologists, 2012). Maternal glycemic control can usually be achieved with multiple daily insulin injections and adjustment of dietary intake. The action profiles of commonly used short- and long-term insulins are shown in Table 57-8.
Stay updated, free articles. Join our Telegram channel

Full access? Get Clinical Tree


